

Key Insights
The global golf buggy market is experiencing robust growth, driven by increasing popularity of golf as a leisure activity, rising disposable incomes in developing economies, and a growing preference for eco-friendly transportation options within golf courses. The market is segmented by type (gas-powered, electric), application (personal use, commercial rentals), and region. Electric golf buggies are witnessing particularly strong growth due to environmental concerns and advancements in battery technology, resulting in longer ranges and improved performance. Leading manufacturers are focusing on innovation, including features like GPS navigation, smartphone integration, and enhanced safety systems, to cater to the evolving demands of consumers. This competitive landscape fosters continuous improvements in product design and functionality, fueling further market expansion. Furthermore, the increasing adoption of lithium-ion batteries is improving the range and performance of electric golf buggies, making them a more attractive alternative to gas-powered models. The market is expected to see continued expansion throughout the forecast period, driven by these factors.
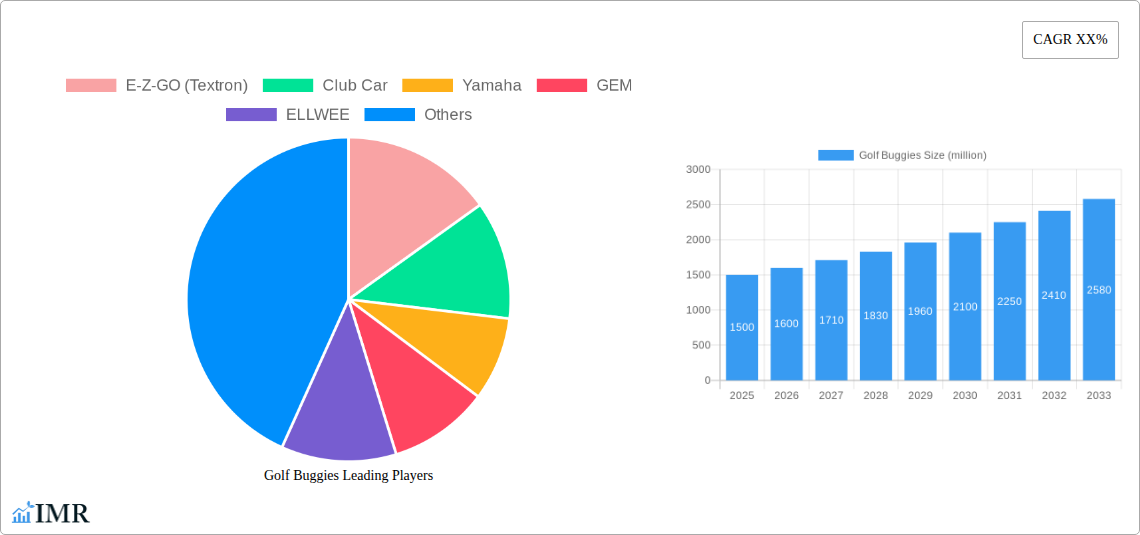
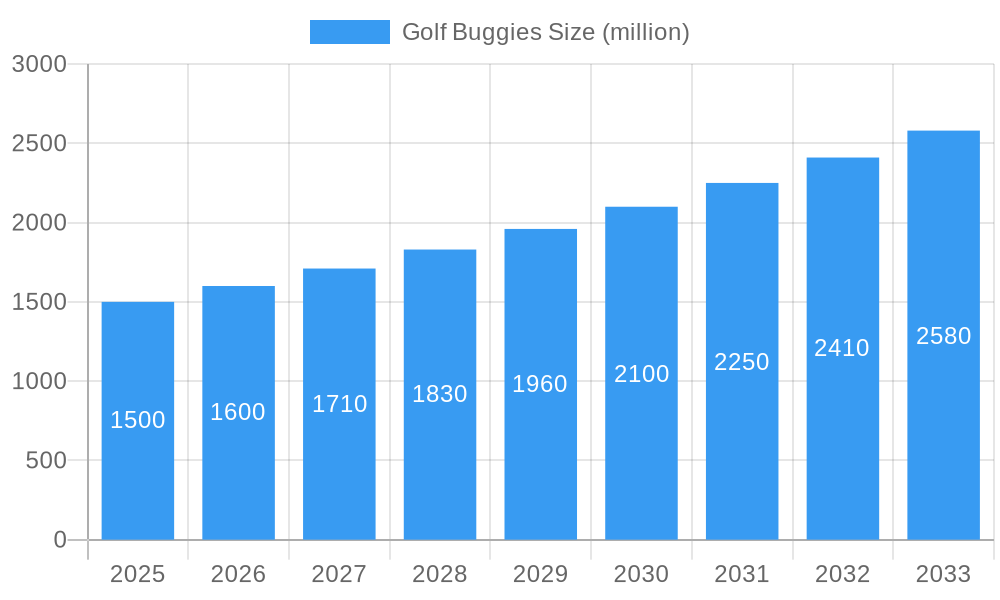
Golf Buggies Market Size (In Billion)
The market's growth trajectory is influenced by several factors, including technological advancements, changing consumer preferences, and economic conditions. Restraints include the high initial cost of golf buggies, particularly the premium models with advanced features, and the availability of public transportation alternatives in some regions. However, ongoing improvements in battery technology and the introduction of more affordable models are expected to mitigate these challenges. Regional differences in market growth are expected, with North America and Europe maintaining significant market share due to established golfing culture and high disposable incomes. However, Asia-Pacific and other emerging markets are anticipated to show significant growth potential in the coming years as golf participation increases and infrastructure develops. Strategic partnerships and mergers & acquisitions among key players will continue to shape the market dynamics.
Golf Buggies Company Market Share
Golf Buggies Market Report: 2019-2033
This comprehensive report provides an in-depth analysis of the global golf buggies market, encompassing market dynamics, growth trends, regional segmentation, product landscape, and key players. The study period spans 2019-2033, with a base year of 2025 and a forecast period of 2025-2033. The report leverages extensive market research and data analysis to provide actionable insights for industry professionals and stakeholders. The market is segmented into various types and applications, offering a detailed view of the parent market (golf carts) and its child markets (electric, gasoline, etc.). The total market size is estimated to be xx million units in 2025 and is projected to reach xx million units by 2033.
Golf Buggies Market Dynamics & Structure
This section analyzes the competitive landscape, technological advancements, regulatory influences, and market trends within the golf buggy industry. The market is moderately concentrated, with key players holding significant market share, but also with room for smaller, specialized players. Technological innovation, particularly in electric vehicle technology and automation, is a primary growth driver. Regulatory frameworks concerning emissions and safety standards are shaping product development and market access. The rise of electric golf buggies is a significant factor, gradually replacing traditional gasoline-powered models. Mergers and acquisitions (M&A) activity is moderate, with larger players occasionally acquiring smaller companies to expand their product lines or geographic reach.
- Market Concentration: Moderately concentrated, with the top 5 players holding approximately 60% market share in 2025.
- Technological Innovation: Electric powertrains, advanced battery technologies, autonomous features are key innovation drivers.
- Regulatory Frameworks: Emission standards and safety regulations influence design and manufacturing.
- Competitive Substitutes: Walking, riding carts (non-golf specific) pose limited competition.
- End-User Demographics: Primarily golf courses, resorts, and private owners. Aging population increasing demand for ease of mobility.
- M&A Trends: Moderate activity, driven by expansion into new markets and technologies. Approximately xx M&A deals were recorded between 2019 and 2024.
Golf Buggies Growth Trends & Insights
The global golf buggies market has experienced steady growth over the past years, driven by increasing golf participation, particularly in developing economies. The adoption rate of electric golf buggies is accelerating due to environmental concerns and technological advancements resulting in lower operating costs. Technological disruptions, such as the introduction of autonomous features, are expected to further boost market growth. Consumer behavior is shifting towards more technologically advanced and environmentally friendly options.
- Market Size Evolution: The market grew from xx million units in 2019 to xx million units in 2024, with a CAGR of xx%.
- Adoption Rates: Electric golf buggies are gaining significant traction with an adoption rate of xx% in 2024, projected to increase to xx% by 2033.
- Technological Disruptions: Autonomous navigation and smart features are gaining popularity.
- Consumer Behavior Shifts: Preference for electric, quieter, and technologically advanced models is increasing.
Dominant Regions, Countries, or Segments in Golf Buggies
North America holds the largest market share in the golf buggy industry, driven by high golf participation rates and a strong presence of established manufacturers. Europe and Asia-Pacific are also significant markets, showing robust growth potential due to increasing disposable income and rising popularity of golf. The electric golf buggy segment is the fastest-growing, reflecting the global shift towards sustainable transportation.
- Key Drivers:
- North America: High golf course density, established manufacturers, high disposable incomes.
- Europe: Growing popularity of golf, government incentives for electric vehicles.
- Asia-Pacific: Rising disposable incomes, increasing golf participation, government investments in sports infrastructure.
- Dominance Factors: Market size, growth rate, technological advancements, government support, and consumer preferences.
Golf Buggies Product Landscape
Golf buggies are evolving from simple transportation vehicles to sophisticated machines incorporating advanced technologies. Electric models are dominating the market, offering quiet operation, lower running costs, and reduced environmental impact. Key features include enhanced battery technology, improved suspension, and optional accessories like GPS navigation systems and cup holders. Unique selling propositions vary, but often include speed, range, comfort, and technological features.
Key Drivers, Barriers & Challenges in Golf Buggies
Key Drivers: Rising disposable incomes, increasing popularity of golf, technological advancements in electric vehicle technology, government incentives for eco-friendly vehicles, and the desire for enhanced comfort and convenience on the golf course.
Key Challenges & Restraints: High initial costs of electric golf buggies, limited charging infrastructure in some regions, potential supply chain disruptions impacting component availability, and intense competition among established manufacturers. The impact of these challenges is estimated to reduce market growth by approximately xx% by 2033.
Emerging Opportunities in Golf Buggies
Untapped markets in developing countries, the integration of smart technologies like IoT and connectivity, and the rise of customized and luxury golf buggies are key emerging opportunities. The development of autonomous features and improved battery technologies will further enhance market potential. Expanding into related markets, such as commercial and recreational applications, presents further growth opportunities.
Growth Accelerators in the Golf Buggies Industry
Technological breakthroughs in battery technology and autonomous driving systems are crucial growth accelerators. Strategic partnerships between manufacturers and golf course operators will expand market reach. Expansion into new markets and diversification of product offerings are key long-term growth strategies.
Key Players Shaping the Golf Buggies Market
- E-Z-GO (Textron)
- Club Car
- Yamaha
- GEM
- ELLWEE
- Garia
- JH Global Services
- HDK ELECTRIC VEHICLES
- American Custom Golf Carts
- Columbia Vehicles
- Speedways Electric
- Bintelli Electric Vehicles
- CitEcar Electric Vehicles
- AGT Electric Cars
- Suzhou Eagle Electric Vehicle Manufacturing
- Guangdong Lvtong
- Marshell
Notable Milestones in Golf Buggies Sector
- 2020: E-Z-GO launched its first fully electric golf buggy with extended range.
- 2022: Club Car introduced a new model with advanced GPS navigation and autonomous features.
- 2023: Yamaha partnered with a technology company to develop advanced battery technology for golf buggies. (Further milestones could be added here based on available data).
In-Depth Golf Buggies Market Outlook
The golf buggy market is poised for sustained growth, driven by technological advancements, increasing demand, and expanding into new applications. Strategic partnerships, product innovation, and entry into emerging markets will be key to success. The focus on electric models and incorporation of smart technologies will reshape the market landscape, creating new opportunities for both established and emerging players. The market is expected to grow at a CAGR of xx% from 2025 to 2033, reaching a projected xx million units.
Golf Buggies Segmentation
-
1. Application
- 1.1. Individual
- 1.2. Commercial
-
2. Types
- 2.1. Small Electric Golf Buggy (Below 2 Seaters)
- 2.2. Middle Electric Golf Buggy (2-6 Seaters)
- 2.3. Large Electric Golf Buggy (Above 6 Seaters)
Golf Buggies Segmentation By Geography
-
1. North America
- 1.1. United States
- 1.2. Canada
- 1.3. Mexico
-
2. South America
- 2.1. Brazil
- 2.2. Argentina
- 2.3. Rest of South America
-
3. Europe
- 3.1. United Kingdom
- 3.2. Germany
- 3.3. France
- 3.4. Italy
- 3.5. Spain
- 3.6. Russia
- 3.7. Benelux
- 3.8. Nordics
- 3.9. Rest of Europe
-
4. Middle East & Africa
- 4.1. Turkey
- 4.2. Israel
- 4.3. GCC
- 4.4. North Africa
- 4.5. South Africa
- 4.6. Rest of Middle East & Africa
-
5. Asia Pacific
- 5.1. China
- 5.2. India
- 5.3. Japan
- 5.4. South Korea
- 5.5. ASEAN
- 5.6. Oceania
- 5.7. Rest of Asia Pacific
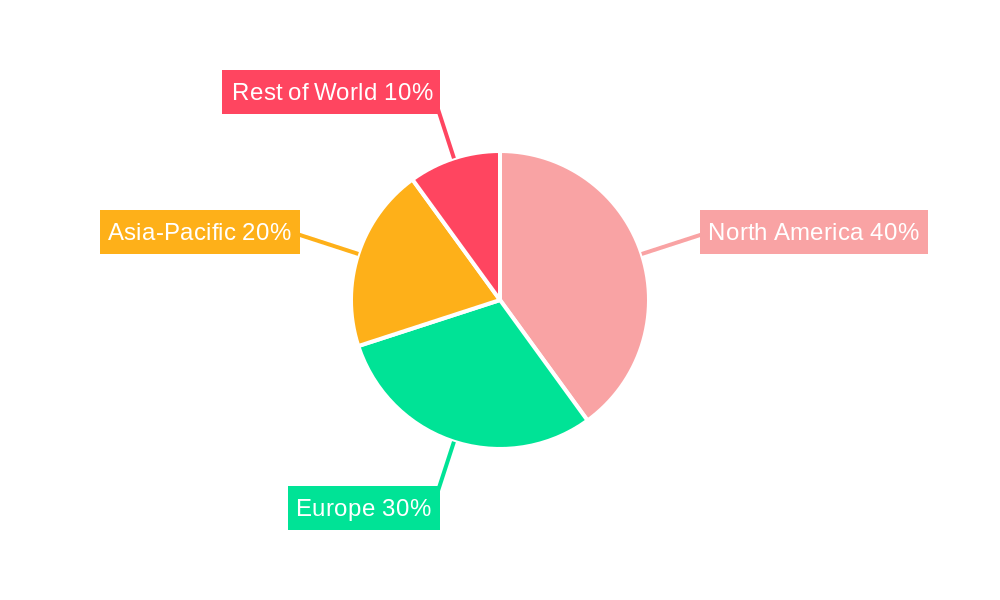
Golf Buggies Regional Market Share
Geographic Coverage of Golf Buggies
Golf Buggies REPORT HIGHLIGHTS
| Aspects | Details |
|---|---|
| Study Period | 2020-2034 |
| Base Year | 2025 |
| Estimated Year | 2026 |
| Forecast Period | 2026-2034 |
| Historical Period | 2020-2025 |
| Growth Rate | CAGR of 7.5% from 2020-2034 |
| Segmentation |
|
Table of Contents
- 1. Introduction
- 1.1. Research Scope
- 1.2. Market Segmentation
- 1.3. Research Objective
- 1.4. Definitions and Assumptions
- 2. Executive Summary
- 2.1. Market Snapshot
- 3. Market Dynamics
- 3.1. Market Drivers
- 3.2. Market Restrains
- 3.3. Market Trends
- 3.4. Market Opportunities
- 4. Market Factor Analysis
- 4.1. Porters Five Forces
- 4.1.1. Bargaining Power of Suppliers
- 4.1.2. Bargaining Power of Buyers
- 4.1.3. Threat of New Entrants
- 4.1.4. Threat of Substitutes
- 4.1.5. Competitive Rivalry
- 4.2. PESTEL analysis
- 4.3. BCG Analysis
- 4.3.1. Stars (High Growth, High Market Share)
- 4.3.2. Cash Cows (Low Growth, High Market Share)
- 4.3.3. Question Mark (High Growth, Low Market Share)
- 4.3.4. Dogs (Low Growth, Low Market Share)
- 4.4. Ansoff Matrix Analysis
- 4.5. Supply Chain Analysis
- 4.6. Regulatory Landscape
- 4.7. Current Market Potential and Opportunity Assessment (TAM–SAM–SOM Framework)
- 4.8. IMR Analyst Note
- 4.1. Porters Five Forces
- 5. Market Analysis, Insights and Forecast 2021-2033
- 5.1. Market Analysis, Insights and Forecast - by Application
- 5.1.1. Individual
- 5.1.2. Commercial
- 5.2. Market Analysis, Insights and Forecast - by Types
- 5.2.1. Small Electric Golf Buggy (Below 2 Seaters)
- 5.2.2. Middle Electric Golf Buggy (2-6 Seaters)
- 5.2.3. Large Electric Golf Buggy (Above 6 Seaters)
- 5.3. Market Analysis, Insights and Forecast - by Region
- 5.3.1. North America
- 5.3.2. South America
- 5.3.3. Europe
- 5.3.4. Middle East & Africa
- 5.3.5. Asia Pacific
- 5.1. Market Analysis, Insights and Forecast - by Application
- 6. Global Golf Buggies Analysis, Insights and Forecast, 2021-2033
- 6.1. Market Analysis, Insights and Forecast - by Application
- 6.1.1. Individual
- 6.1.2. Commercial
- 6.2. Market Analysis, Insights and Forecast - by Types
- 6.2.1. Small Electric Golf Buggy (Below 2 Seaters)
- 6.2.2. Middle Electric Golf Buggy (2-6 Seaters)
- 6.2.3. Large Electric Golf Buggy (Above 6 Seaters)
- 6.1. Market Analysis, Insights and Forecast - by Application
- 7. North America Golf Buggies Analysis, Insights and Forecast, 2020-2032
- 7.1. Market Analysis, Insights and Forecast - by Application
- 7.1.1. Individual
- 7.1.2. Commercial
- 7.2. Market Analysis, Insights and Forecast - by Types
- 7.2.1. Small Electric Golf Buggy (Below 2 Seaters)
- 7.2.2. Middle Electric Golf Buggy (2-6 Seaters)
- 7.2.3. Large Electric Golf Buggy (Above 6 Seaters)
- 7.1. Market Analysis, Insights and Forecast - by Application
- 8. South America Golf Buggies Analysis, Insights and Forecast, 2020-2032
- 8.1. Market Analysis, Insights and Forecast - by Application
- 8.1.1. Individual
- 8.1.2. Commercial
- 8.2. Market Analysis, Insights and Forecast - by Types
- 8.2.1. Small Electric Golf Buggy (Below 2 Seaters)
- 8.2.2. Middle Electric Golf Buggy (2-6 Seaters)
- 8.2.3. Large Electric Golf Buggy (Above 6 Seaters)
- 8.1. Market Analysis, Insights and Forecast - by Application
- 9. Europe Golf Buggies Analysis, Insights and Forecast, 2020-2032
- 9.1. Market Analysis, Insights and Forecast - by Application
- 9.1.1. Individual
- 9.1.2. Commercial
- 9.2. Market Analysis, Insights and Forecast - by Types
- 9.2.1. Small Electric Golf Buggy (Below 2 Seaters)
- 9.2.2. Middle Electric Golf Buggy (2-6 Seaters)
- 9.2.3. Large Electric Golf Buggy (Above 6 Seaters)
- 9.1. Market Analysis, Insights and Forecast - by Application
- 10. Middle East & Africa Golf Buggies Analysis, Insights and Forecast, 2020-2032
- 10.1. Market Analysis, Insights and Forecast - by Application
- 10.1.1. Individual
- 10.1.2. Commercial
- 10.2. Market Analysis, Insights and Forecast - by Types
- 10.2.1. Small Electric Golf Buggy (Below 2 Seaters)
- 10.2.2. Middle Electric Golf Buggy (2-6 Seaters)
- 10.2.3. Large Electric Golf Buggy (Above 6 Seaters)
- 10.1. Market Analysis, Insights and Forecast - by Application
- 11. Asia Pacific Golf Buggies Analysis, Insights and Forecast, 2020-2032
- 11.1. Market Analysis, Insights and Forecast - by Application
- 11.1.1. Individual
- 11.1.2. Commercial
- 11.2. Market Analysis, Insights and Forecast - by Types
- 11.2.1. Small Electric Golf Buggy (Below 2 Seaters)
- 11.2.2. Middle Electric Golf Buggy (2-6 Seaters)
- 11.2.3. Large Electric Golf Buggy (Above 6 Seaters)
- 11.1. Market Analysis, Insights and Forecast - by Application
- 12. Competitive Analysis
- 12.1. Company Profiles
- 12.1.1 E-Z-GO (Textron)
- 12.1.1.1. Company Overview
- 12.1.1.2. Products
- 12.1.1.3. Company Financials
- 12.1.1.4. SWOT Analysis
- 12.1.2 Club Car
- 12.1.2.1. Company Overview
- 12.1.2.2. Products
- 12.1.2.3. Company Financials
- 12.1.2.4. SWOT Analysis
- 12.1.3 Yamaha
- 12.1.3.1. Company Overview
- 12.1.3.2. Products
- 12.1.3.3. Company Financials
- 12.1.3.4. SWOT Analysis
- 12.1.4 GEM
- 12.1.4.1. Company Overview
- 12.1.4.2. Products
- 12.1.4.3. Company Financials
- 12.1.4.4. SWOT Analysis
- 12.1.5 ELLWEE
- 12.1.5.1. Company Overview
- 12.1.5.2. Products
- 12.1.5.3. Company Financials
- 12.1.5.4. SWOT Analysis
- 12.1.6 Garia
- 12.1.6.1. Company Overview
- 12.1.6.2. Products
- 12.1.6.3. Company Financials
- 12.1.6.4. SWOT Analysis
- 12.1.7 JH Global Services
- 12.1.7.1. Company Overview
- 12.1.7.2. Products
- 12.1.7.3. Company Financials
- 12.1.7.4. SWOT Analysis
- 12.1.8 HDK ELECTRIC VEHICLES
- 12.1.8.1. Company Overview
- 12.1.8.2. Products
- 12.1.8.3. Company Financials
- 12.1.8.4. SWOT Analysis
- 12.1.9 American Custom Golf Carts
- 12.1.9.1. Company Overview
- 12.1.9.2. Products
- 12.1.9.3. Company Financials
- 12.1.9.4. SWOT Analysis
- 12.1.10 Columbia Vehicles
- 12.1.10.1. Company Overview
- 12.1.10.2. Products
- 12.1.10.3. Company Financials
- 12.1.10.4. SWOT Analysis
- 12.1.11 Speedways Electric
- 12.1.11.1. Company Overview
- 12.1.11.2. Products
- 12.1.11.3. Company Financials
- 12.1.11.4. SWOT Analysis
- 12.1.12 Bintelli Electric Vehicles
- 12.1.12.1. Company Overview
- 12.1.12.2. Products
- 12.1.12.3. Company Financials
- 12.1.12.4. SWOT Analysis
- 12.1.13 CitEcar Electric Vehicles
- 12.1.13.1. Company Overview
- 12.1.13.2. Products
- 12.1.13.3. Company Financials
- 12.1.13.4. SWOT Analysis
- 12.1.14 AGT Electric Cars
- 12.1.14.1. Company Overview
- 12.1.14.2. Products
- 12.1.14.3. Company Financials
- 12.1.14.4. SWOT Analysis
- 12.1.15 Suzhou Eagle Electric Vehicle Manufacturing
- 12.1.15.1. Company Overview
- 12.1.15.2. Products
- 12.1.15.3. Company Financials
- 12.1.15.4. SWOT Analysis
- 12.1.16 Guangdong Lvtong
- 12.1.16.1. Company Overview
- 12.1.16.2. Products
- 12.1.16.3. Company Financials
- 12.1.16.4. SWOT Analysis
- 12.1.17 Marshell
- 12.1.17.1. Company Overview
- 12.1.17.2. Products
- 12.1.17.3. Company Financials
- 12.1.17.4. SWOT Analysis
- 12.1.1 E-Z-GO (Textron)
- 12.2. Market Entropy
- 12.2.1 Company's Key Areas Served
- 12.2.2 Recent Developments
- 12.3. Company Market Share Analysis 2025
- 12.3.1 Top 5 Companies Market Share Analysis
- 12.3.2 Top 3 Companies Market Share Analysis
- 12.4. List of Potential Customers
- 13. Research Methodology
List of Figures
- Figure 1: Global Golf Buggies Revenue Breakdown (undefined, %) by Region 2025 & 2033
- Figure 2: North America Golf Buggies Revenue (undefined), by Application 2025 & 2033
- Figure 3: North America Golf Buggies Revenue Share (%), by Application 2025 & 2033
- Figure 4: North America Golf Buggies Revenue (undefined), by Types 2025 & 2033
- Figure 5: North America Golf Buggies Revenue Share (%), by Types 2025 & 2033
- Figure 6: North America Golf Buggies Revenue (undefined), by Country 2025 & 2033
- Figure 7: North America Golf Buggies Revenue Share (%), by Country 2025 & 2033
- Figure 8: South America Golf Buggies Revenue (undefined), by Application 2025 & 2033
- Figure 9: South America Golf Buggies Revenue Share (%), by Application 2025 & 2033
- Figure 10: South America Golf Buggies Revenue (undefined), by Types 2025 & 2033
- Figure 11: South America Golf Buggies Revenue Share (%), by Types 2025 & 2033
- Figure 12: South America Golf Buggies Revenue (undefined), by Country 2025 & 2033
- Figure 13: South America Golf Buggies Revenue Share (%), by Country 2025 & 2033
- Figure 14: Europe Golf Buggies Revenue (undefined), by Application 2025 & 2033
- Figure 15: Europe Golf Buggies Revenue Share (%), by Application 2025 & 2033
- Figure 16: Europe Golf Buggies Revenue (undefined), by Types 2025 & 2033
- Figure 17: Europe Golf Buggies Revenue Share (%), by Types 2025 & 2033
- Figure 18: Europe Golf Buggies Revenue (undefined), by Country 2025 & 2033
- Figure 19: Europe Golf Buggies Revenue Share (%), by Country 2025 & 2033
- Figure 20: Middle East & Africa Golf Buggies Revenue (undefined), by Application 2025 & 2033
- Figure 21: Middle East & Africa Golf Buggies Revenue Share (%), by Application 2025 & 2033
- Figure 22: Middle East & Africa Golf Buggies Revenue (undefined), by Types 2025 & 2033
- Figure 23: Middle East & Africa Golf Buggies Revenue Share (%), by Types 2025 & 2033
- Figure 24: Middle East & Africa Golf Buggies Revenue (undefined), by Country 2025 & 2033
- Figure 25: Middle East & Africa Golf Buggies Revenue Share (%), by Country 2025 & 2033
- Figure 26: Asia Pacific Golf Buggies Revenue (undefined), by Application 2025 & 2033
- Figure 27: Asia Pacific Golf Buggies Revenue Share (%), by Application 2025 & 2033
- Figure 28: Asia Pacific Golf Buggies Revenue (undefined), by Types 2025 & 2033
- Figure 29: Asia Pacific Golf Buggies Revenue Share (%), by Types 2025 & 2033
- Figure 30: Asia Pacific Golf Buggies Revenue (undefined), by Country 2025 & 2033
- Figure 31: Asia Pacific Golf Buggies Revenue Share (%), by Country 2025 & 2033
List of Tables
- Table 1: Global Golf Buggies Revenue undefined Forecast, by Application 2020 & 2033
- Table 2: Global Golf Buggies Revenue undefined Forecast, by Types 2020 & 2033
- Table 3: Global Golf Buggies Revenue undefined Forecast, by Region 2020 & 2033
- Table 4: Global Golf Buggies Revenue undefined Forecast, by Application 2020 & 2033
- Table 5: Global Golf Buggies Revenue undefined Forecast, by Types 2020 & 2033
- Table 6: Global Golf Buggies Revenue undefined Forecast, by Country 2020 & 2033
- Table 7: United States Golf Buggies Revenue (undefined) Forecast, by Application 2020 & 2033
- Table 8: Canada Golf Buggies Revenue (undefined) Forecast, by Application 2020 & 2033
- Table 9: Mexico Golf Buggies Revenue (undefined) Forecast, by Application 2020 & 2033
- Table 10: Global Golf Buggies Revenue undefined Forecast, by Application 2020 & 2033
- Table 11: Global Golf Buggies Revenue undefined Forecast, by Types 2020 & 2033
- Table 12: Global Golf Buggies Revenue undefined Forecast, by Country 2020 & 2033
- Table 13: Brazil Golf Buggies Revenue (undefined) Forecast, by Application 2020 & 2033
- Table 14: Argentina Golf Buggies Revenue (undefined) Forecast, by Application 2020 & 2033
- Table 15: Rest of South America Golf Buggies Revenue (undefined) Forecast, by Application 2020 & 2033
- Table 16: Global Golf Buggies Revenue undefined Forecast, by Application 2020 & 2033
- Table 17: Global Golf Buggies Revenue undefined Forecast, by Types 2020 & 2033
- Table 18: Global Golf Buggies Revenue undefined Forecast, by Country 2020 & 2033
- Table 19: United Kingdom Golf Buggies Revenue (undefined) Forecast, by Application 2020 & 2033
- Table 20: Germany Golf Buggies Revenue (undefined) Forecast, by Application 2020 & 2033
- Table 21: France Golf Buggies Revenue (undefined) Forecast, by Application 2020 & 2033
- Table 22: Italy Golf Buggies Revenue (undefined) Forecast, by Application 2020 & 2033
- Table 23: Spain Golf Buggies Revenue (undefined) Forecast, by Application 2020 & 2033
- Table 24: Russia Golf Buggies Revenue (undefined) Forecast, by Application 2020 & 2033
- Table 25: Benelux Golf Buggies Revenue (undefined) Forecast, by Application 2020 & 2033
- Table 26: Nordics Golf Buggies Revenue (undefined) Forecast, by Application 2020 & 2033
- Table 27: Rest of Europe Golf Buggies Revenue (undefined) Forecast, by Application 2020 & 2033
- Table 28: Global Golf Buggies Revenue undefined Forecast, by Application 2020 & 2033
- Table 29: Global Golf Buggies Revenue undefined Forecast, by Types 2020 & 2033
- Table 30: Global Golf Buggies Revenue undefined Forecast, by Country 2020 & 2033
- Table 31: Turkey Golf Buggies Revenue (undefined) Forecast, by Application 2020 & 2033
- Table 32: Israel Golf Buggies Revenue (undefined) Forecast, by Application 2020 & 2033
- Table 33: GCC Golf Buggies Revenue (undefined) Forecast, by Application 2020 & 2033
- Table 34: North Africa Golf Buggies Revenue (undefined) Forecast, by Application 2020 & 2033
- Table 35: South Africa Golf Buggies Revenue (undefined) Forecast, by Application 2020 & 2033
- Table 36: Rest of Middle East & Africa Golf Buggies Revenue (undefined) Forecast, by Application 2020 & 2033
- Table 37: Global Golf Buggies Revenue undefined Forecast, by Application 2020 & 2033
- Table 38: Global Golf Buggies Revenue undefined Forecast, by Types 2020 & 2033
- Table 39: Global Golf Buggies Revenue undefined Forecast, by Country 2020 & 2033
- Table 40: China Golf Buggies Revenue (undefined) Forecast, by Application 2020 & 2033
- Table 41: India Golf Buggies Revenue (undefined) Forecast, by Application 2020 & 2033
- Table 42: Japan Golf Buggies Revenue (undefined) Forecast, by Application 2020 & 2033
- Table 43: South Korea Golf Buggies Revenue (undefined) Forecast, by Application 2020 & 2033
- Table 44: ASEAN Golf Buggies Revenue (undefined) Forecast, by Application 2020 & 2033
- Table 45: Oceania Golf Buggies Revenue (undefined) Forecast, by Application 2020 & 2033
- Table 46: Rest of Asia Pacific Golf Buggies Revenue (undefined) Forecast, by Application 2020 & 2033
Frequently Asked Questions
1. What is the projected Compound Annual Growth Rate (CAGR) of the Golf Buggies?
The projected CAGR is approximately 7.5%.
2. Which companies are prominent players in the Golf Buggies?
Key companies in the market include E-Z-GO (Textron), Club Car, Yamaha, GEM, ELLWEE, Garia, JH Global Services, HDK ELECTRIC VEHICLES, American Custom Golf Carts, Columbia Vehicles, Speedways Electric, Bintelli Electric Vehicles, CitEcar Electric Vehicles, AGT Electric Cars, Suzhou Eagle Electric Vehicle Manufacturing, Guangdong Lvtong, Marshell.
3. What are the main segments of the Golf Buggies?
The market segments include Application, Types.
4. Can you provide details about the market size?
The market size is estimated to be USD XXX N/A as of 2022.
5. What are some drivers contributing to market growth?
N/A
6. What are the notable trends driving market growth?
N/A
7. Are there any restraints impacting market growth?
N/A
8. Can you provide examples of recent developments in the market?
N/A
9. What pricing options are available for accessing the report?
Pricing options include single-user, multi-user, and enterprise licenses priced at USD 2900.00, USD 4350.00, and USD 5800.00 respectively.
10. Is the market size provided in terms of value or volume?
The market size is provided in terms of value, measured in N/A.
11. Are there any specific market keywords associated with the report?
Yes, the market keyword associated with the report is "Golf Buggies," which aids in identifying and referencing the specific market segment covered.
12. How do I determine which pricing option suits my needs best?
The pricing options vary based on user requirements and access needs. Individual users may opt for single-user licenses, while businesses requiring broader access may choose multi-user or enterprise licenses for cost-effective access to the report.
13. Are there any additional resources or data provided in the Golf Buggies report?
While the report offers comprehensive insights, it's advisable to review the specific contents or supplementary materials provided to ascertain if additional resources or data are available.
14. How can I stay updated on further developments or reports in the Golf Buggies?
To stay informed about further developments, trends, and reports in the Golf Buggies, consider subscribing to industry newsletters, following relevant companies and organizations, or regularly checking reputable industry news sources and publications.
Methodology
Step 1 - Identification of Relevant Samples Size from Population Database


Step 2 - Approaches for Defining Global Market Size (Value, Volume* & Price*)

Note*: In applicable scenarios
Step 3 - Data Sources
Primary Research
- Web Analytics
- Survey Reports
- Research Institute
- Latest Research Reports
- Opinion Leaders
Secondary Research
- Annual Reports
- White Paper
- Latest Press Release
- Industry Association
- Paid Database
- Investor Presentations

Step 4 - Data Triangulation
Involves using different sources of information in order to increase the validity of a study
These sources are likely to be stakeholders in a program - participants, other researchers, program staff, other community members, and so on.
Then we put all data in single framework & apply various statistical tools to find out the dynamic on the market.
During the analysis stage, feedback from the stakeholder groups would be compared to determine areas of agreement as well as areas of divergence