

Key Insights
The healthy chips market is poised for significant expansion, propelled by heightened consumer health awareness and a growing demand for nutrient-rich snacking alternatives. The market, valued at $15.18 billion in the base year 2025, is forecast to achieve a Compound Annual Growth Rate (CAGR) of 7.8% from 2025 to 2033. This growth trajectory is underpinned by key drivers, including the increasing adoption of innovative, health-focused ingredients such as lentil, chickpea, and vegetable-based formulations. The rising availability of gluten-free and vegan options, alongside a consumer preference for snacks with reduced sodium, fat, and saturated fat, further fuels market momentum. Leading industry players are strategically diversifying their product portfolios and engaging in acquisitions to capitalize on these evolving trends.
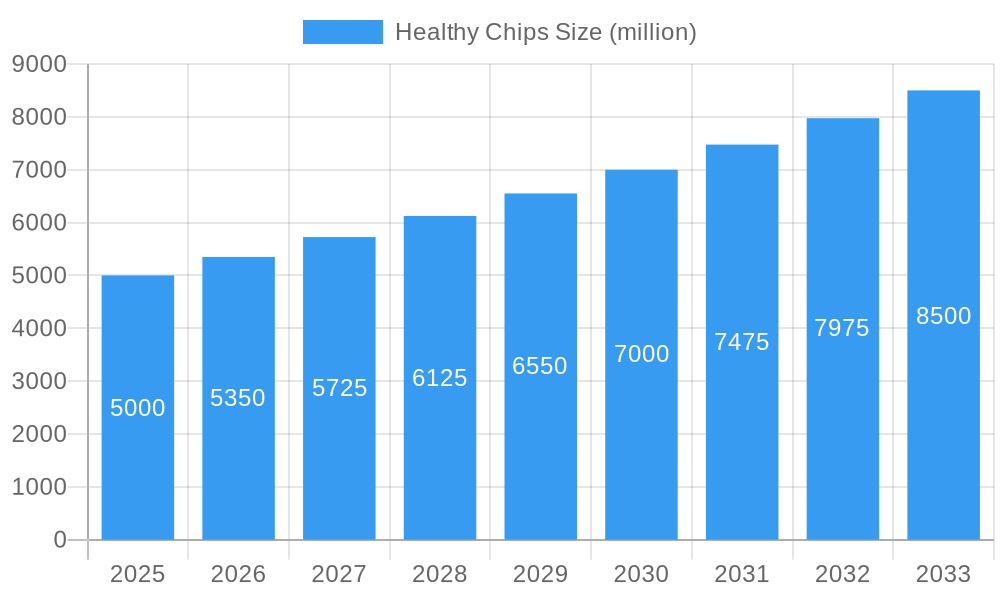
Healthy Chips Market Size (In Billion)
Despite the promising outlook, the market confronts challenges such as the premium pricing of healthy chip alternatives, which may impact adoption among price-sensitive demographics. Intensifying competition from both established brands and emerging players presents another dynamic. Furthermore, maintaining optimal product quality and taste while adhering to stringent health-conscious formulations remains a critical operational hurdle. Effectively addressing these challenges will be paramount for sustained market development. Market segmentation encompasses diverse ingredient bases (e.g., vegetable, bean, lentil), flavor profiles, and packaging formats. Regional disparities in consumer preferences and dietary habits also play a role in shaping market dynamics.
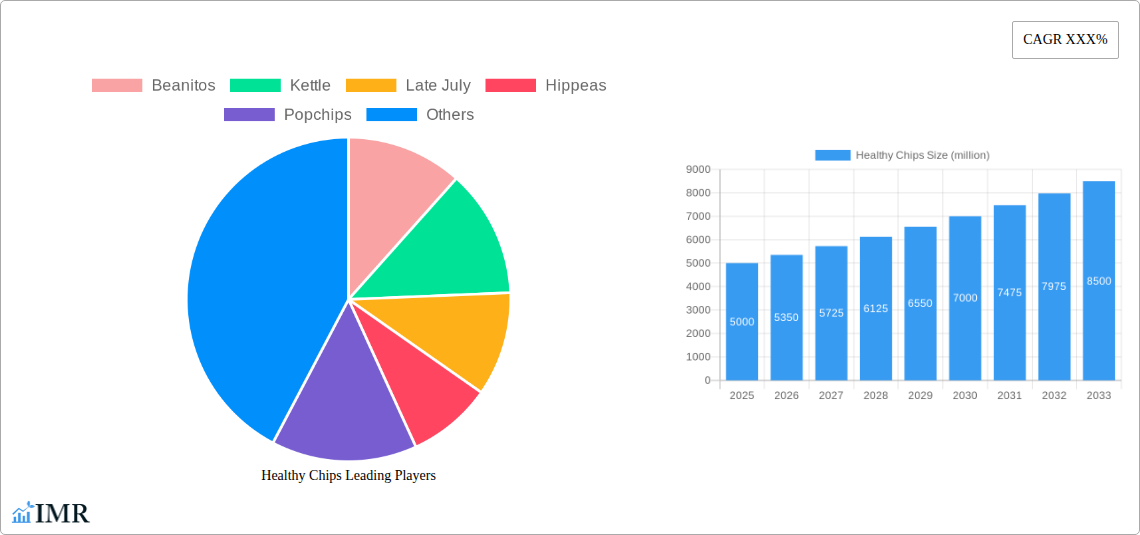
Healthy Chips Company Market Share
Healthy Chips Market Report: 2019-2033
This comprehensive report provides a detailed analysis of the global healthy chips market, encompassing market dynamics, growth trends, regional analysis, competitive landscape, and future outlook. The report covers the historical period (2019-2024), base year (2025), and forecast period (2025-2033), offering valuable insights for industry professionals, investors, and strategic decision-makers. The parent market is the broader snack food market, while the child market focuses specifically on the segment of healthy, better-for-you snack chips. The report analyzes key players like Frito-Lay, Kettle, and others, providing detailed competitive intelligence to facilitate informed strategic planning.
Healthy Chips Market Dynamics & Structure
The healthy chips market, valued at $XX billion in 2025, is characterized by moderate concentration, with key players holding significant market share but facing increasing competition from smaller, innovative brands. Technological innovation, particularly in ingredient sourcing and processing, is a key driver, while stringent regulatory frameworks regarding labeling and ingredient claims influence product development. The market exhibits a strong preference for natural, organic, and gluten-free options, driving growth in specific segments. M&A activity remains moderate, with larger players strategically acquiring smaller brands to expand their product portfolios and enhance market reach.
- Market Concentration: Moderately concentrated, with top 5 players holding approximately XX% market share in 2025.
- Technological Innovation: Focus on healthier ingredients (e.g., ancient grains, legumes), improved processing techniques for enhanced nutritional value, and sustainable packaging.
- Regulatory Framework: Stringent regulations regarding labeling, allergen information, and health claims influence product formulation and marketing strategies.
- Competitive Substitutes: Other healthy snacks (e.g., nuts, seeds, fruit) compete for consumer spending.
- End-User Demographics: Growing demand among health-conscious consumers, particularly millennials and Gen Z, drives market expansion.
- M&A Trends: Strategic acquisitions of smaller, innovative brands by larger players for portfolio diversification and expansion into niche segments (XX deals recorded between 2019-2024).
Healthy Chips Growth Trends & Insights
The global healthy chips market has witnessed robust growth throughout the historical period (2019-2024), driven by increasing consumer awareness of health and wellness, shifting dietary preferences towards healthier snack options, and the rise of convenience-focused lifestyles. The market is expected to exhibit a Compound Annual Growth Rate (CAGR) of XX% during the forecast period (2025-2033), reaching an estimated value of $XX billion by 2033. This growth is primarily fueled by the increasing adoption of plant-based diets, growing demand for gluten-free and allergen-free options, and the emergence of innovative product formats and flavors. Market penetration of healthy chips within the broader snack food market is projected to increase from XX% in 2025 to XX% by 2033. Technological disruptions, such as advancements in food processing and packaging technologies, are contributing to increased product variety and improved shelf life. Consumer behavior shifts towards healthier and more sustainable food choices further reinforce this growth trend.
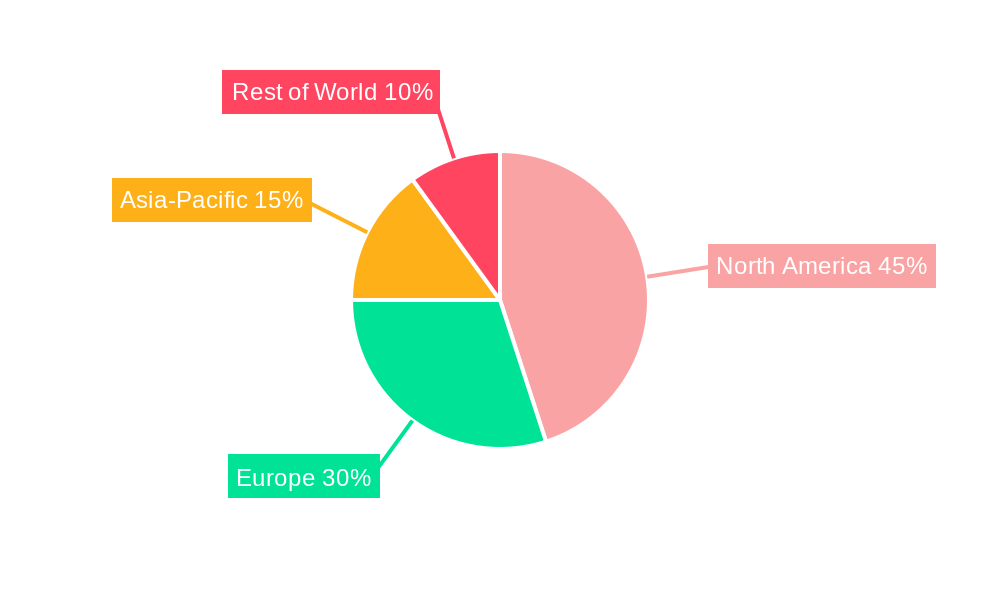
Dominant Regions, Countries, or Segments in Healthy Chips
North America currently holds the largest market share in the global healthy chips market, driven by high consumer demand for healthy snack options, strong distribution networks, and a robust economy. However, Asia-Pacific is projected to witness the fastest growth rate during the forecast period due to rising disposable incomes, increasing health awareness, and expanding distribution channels. Within specific segments, the organic and gluten-free chips sub-segments are exhibiting particularly strong growth, fueled by increasing consumer preference for clean-label products.
- Key Drivers in North America: High consumer awareness of health and wellness, established distribution infrastructure, strong regulatory frameworks supporting healthy food products.
- Key Drivers in Asia-Pacific: Rising disposable incomes, increasing health consciousness amongst young consumers, expanding retail infrastructure.
- Dominant Segment: The organic and gluten-free segment is experiencing rapid growth due to increasing consumer demand for clean-label and health-conscious products.
Healthy Chips Product Landscape
The healthy chips market showcases a diverse product landscape featuring various ingredients, flavors, and formats. Innovations focus on using healthier ingredients like lentils, chickpeas, and quinoa, often incorporating unique flavor profiles to appeal to a broad range of consumer preferences. Technological advancements in processing ensure optimal texture and shelf life while maintaining nutritional value. Unique selling propositions often emphasize the use of non-GMO ingredients, organic farming practices, and low-sodium formulations. The market is seeing a move toward more sustainable and eco-friendly packaging options.
Key Drivers, Barriers & Challenges in Healthy Chips
Key Drivers:
- Increasing consumer demand for healthy and convenient snacks.
- Growing awareness of the health benefits of plant-based diets.
- Technological advancements in food processing and packaging.
- Favorable government regulations promoting healthy food consumption.
Challenges & Restraints:
- Higher production costs compared to conventional chips.
- Limited shelf life of some healthy chip varieties.
- Intense competition from established players and emerging brands.
- Fluctuations in raw material prices. (e.g., a 10% increase in legume prices could reduce profitability by XX%).
Emerging Opportunities in Healthy Chips
Emerging opportunities include expansion into untapped markets (e.g., developing economies), development of innovative product formats (e.g., baked chips, veggie chips), exploration of functional ingredients (e.g., added probiotics, prebiotics), and catering to specific dietary needs (e.g., ketogenic, vegan). Personalized nutrition and customized flavor profiles represent significant future opportunities.
Growth Accelerators in the Healthy Chips Industry
Technological advancements in ingredient processing and packaging, coupled with strategic partnerships between manufacturers and ingredient suppliers, are key growth accelerators. Aggressive expansion strategies focused on emerging markets and the development of innovative products targeting niche consumer segments will further drive market expansion. Successful marketing campaigns highlighting health benefits and sustainability will play a crucial role in capturing growing consumer interest.
Notable Milestones in Healthy Chips Sector
- 2020: Increased focus on sustainable packaging among major brands.
- 2021: Launch of several new product lines featuring plant-based proteins and ancient grains.
- 2022: Significant investment in research and development for improved processing techniques.
- 2023: Several key mergers and acquisitions among smaller players.
- 2024: Growing adoption of direct-to-consumer marketing strategies.
In-Depth Healthy Chips Market Outlook
The healthy chips market is poised for sustained growth, driven by several key factors. Technological advancements, strategic partnerships, and a continued focus on product innovation will shape the market landscape. Opportunities abound in expanding into new geographic regions, particularly in developing economies. The focus on clean-label ingredients, sustainable practices, and tailored products for specific dietary needs will continue to fuel demand, leading to a robust and dynamic market in the years to come.
Healthy Chips Segmentation
-
1. Application
- 1.1. Online Sales
- 1.2. Offline Sales
-
2. Type
- 2.1. Vegetable Chips
- 2.2. Grain Chips
- 2.3. Fruit Chips
- 2.4. Bean Chips
- 2.5. Others
Healthy Chips Segmentation By Geography
-
1. North America
- 1.1. United States
- 1.2. Canada
- 1.3. Mexico
-
2. South America
- 2.1. Brazil
- 2.2. Argentina
- 2.3. Rest of South America
-
3. Europe
- 3.1. United Kingdom
- 3.2. Germany
- 3.3. France
- 3.4. Italy
- 3.5. Spain
- 3.6. Russia
- 3.7. Benelux
- 3.8. Nordics
- 3.9. Rest of Europe
-
4. Middle East & Africa
- 4.1. Turkey
- 4.2. Israel
- 4.3. GCC
- 4.4. North Africa
- 4.5. South Africa
- 4.6. Rest of Middle East & Africa
-
5. Asia Pacific
- 5.1. China
- 5.2. India
- 5.3. Japan
- 5.4. South Korea
- 5.5. ASEAN
- 5.6. Oceania
- 5.7. Rest of Asia Pacific
Healthy Chips Regional Market Share
Geographic Coverage of Healthy Chips
Healthy Chips REPORT HIGHLIGHTS
| Aspects | Details |
|---|---|
| Study Period | 2020-2034 |
| Base Year | 2025 |
| Estimated Year | 2026 |
| Forecast Period | 2026-2034 |
| Historical Period | 2020-2025 |
| Growth Rate | CAGR of 7.8% from 2020-2034 |
| Segmentation |
|
Table of Contents
- 1. Introduction
- 1.1. Research Scope
- 1.2. Market Segmentation
- 1.3. Research Methodology
- 1.4. Definitions and Assumptions
- 2. Executive Summary
- 2.1. Introduction
- 3. Market Dynamics
- 3.1. Introduction
- 3.2. Market Drivers
- 3.3. Market Restrains
- 3.4. Market Trends
- 4. Market Factor Analysis
- 4.1. Porters Five Forces
- 4.2. Supply/Value Chain
- 4.3. PESTEL analysis
- 4.4. Market Entropy
- 4.5. Patent/Trademark Analysis
- 5. Global Healthy Chips Analysis, Insights and Forecast, 2020-2032
- 5.1. Market Analysis, Insights and Forecast - by Application
- 5.1.1. Online Sales
- 5.1.2. Offline Sales
- 5.2. Market Analysis, Insights and Forecast - by Type
- 5.2.1. Vegetable Chips
- 5.2.2. Grain Chips
- 5.2.3. Fruit Chips
- 5.2.4. Bean Chips
- 5.2.5. Others
- 5.3. Market Analysis, Insights and Forecast - by Region
- 5.3.1. North America
- 5.3.2. South America
- 5.3.3. Europe
- 5.3.4. Middle East & Africa
- 5.3.5. Asia Pacific
- 5.1. Market Analysis, Insights and Forecast - by Application
- 6. North America Healthy Chips Analysis, Insights and Forecast, 2020-2032
- 6.1. Market Analysis, Insights and Forecast - by Application
- 6.1.1. Online Sales
- 6.1.2. Offline Sales
- 6.2. Market Analysis, Insights and Forecast - by Type
- 6.2.1. Vegetable Chips
- 6.2.2. Grain Chips
- 6.2.3. Fruit Chips
- 6.2.4. Bean Chips
- 6.2.5. Others
- 6.1. Market Analysis, Insights and Forecast - by Application
- 7. South America Healthy Chips Analysis, Insights and Forecast, 2020-2032
- 7.1. Market Analysis, Insights and Forecast - by Application
- 7.1.1. Online Sales
- 7.1.2. Offline Sales
- 7.2. Market Analysis, Insights and Forecast - by Type
- 7.2.1. Vegetable Chips
- 7.2.2. Grain Chips
- 7.2.3. Fruit Chips
- 7.2.4. Bean Chips
- 7.2.5. Others
- 7.1. Market Analysis, Insights and Forecast - by Application
- 8. Europe Healthy Chips Analysis, Insights and Forecast, 2020-2032
- 8.1. Market Analysis, Insights and Forecast - by Application
- 8.1.1. Online Sales
- 8.1.2. Offline Sales
- 8.2. Market Analysis, Insights and Forecast - by Type
- 8.2.1. Vegetable Chips
- 8.2.2. Grain Chips
- 8.2.3. Fruit Chips
- 8.2.4. Bean Chips
- 8.2.5. Others
- 8.1. Market Analysis, Insights and Forecast - by Application
- 9. Middle East & Africa Healthy Chips Analysis, Insights and Forecast, 2020-2032
- 9.1. Market Analysis, Insights and Forecast - by Application
- 9.1.1. Online Sales
- 9.1.2. Offline Sales
- 9.2. Market Analysis, Insights and Forecast - by Type
- 9.2.1. Vegetable Chips
- 9.2.2. Grain Chips
- 9.2.3. Fruit Chips
- 9.2.4. Bean Chips
- 9.2.5. Others
- 9.1. Market Analysis, Insights and Forecast - by Application
- 10. Asia Pacific Healthy Chips Analysis, Insights and Forecast, 2020-2032
- 10.1. Market Analysis, Insights and Forecast - by Application
- 10.1.1. Online Sales
- 10.1.2. Offline Sales
- 10.2. Market Analysis, Insights and Forecast - by Type
- 10.2.1. Vegetable Chips
- 10.2.2. Grain Chips
- 10.2.3. Fruit Chips
- 10.2.4. Bean Chips
- 10.2.5. Others
- 10.1. Market Analysis, Insights and Forecast - by Application
- 11. Competitive Analysis
- 11.1. Global Market Share Analysis 2025
- 11.2. Company Profiles
- 11.2.1 Beanitos
- 11.2.1.1. Overview
- 11.2.1.2. Products
- 11.2.1.3. SWOT Analysis
- 11.2.1.4. Recent Developments
- 11.2.1.5. Financials (Based on Availability)
- 11.2.2 Kettle
- 11.2.2.1. Overview
- 11.2.2.2. Products
- 11.2.2.3. SWOT Analysis
- 11.2.2.4. Recent Developments
- 11.2.2.5. Financials (Based on Availability)
- 11.2.3 Late July
- 11.2.3.1. Overview
- 11.2.3.2. Products
- 11.2.3.3. SWOT Analysis
- 11.2.3.4. Recent Developments
- 11.2.3.5. Financials (Based on Availability)
- 11.2.4 Hippeas
- 11.2.4.1. Overview
- 11.2.4.2. Products
- 11.2.4.3. SWOT Analysis
- 11.2.4.4. Recent Developments
- 11.2.4.5. Financials (Based on Availability)
- 11.2.5 Popchips
- 11.2.5.1. Overview
- 11.2.5.2. Products
- 11.2.5.3. SWOT Analysis
- 11.2.5.4. Recent Developments
- 11.2.5.5. Financials (Based on Availability)
- 11.2.6 SunChips
- 11.2.6.1. Overview
- 11.2.6.2. Products
- 11.2.6.3. SWOT Analysis
- 11.2.6.4. Recent Developments
- 11.2.6.5. Financials (Based on Availability)
- 11.2.7 Terra
- 11.2.7.1. Overview
- 11.2.7.2. Products
- 11.2.7.3. SWOT Analysis
- 11.2.7.4. Recent Developments
- 11.2.7.5. Financials (Based on Availability)
- 11.2.8 Boulder Canyon
- 11.2.8.1. Overview
- 11.2.8.2. Products
- 11.2.8.3. SWOT Analysis
- 11.2.8.4. Recent Developments
- 11.2.8.5. Financials (Based on Availability)
- 11.2.9 Frito-Lay
- 11.2.9.1. Overview
- 11.2.9.2. Products
- 11.2.9.3. SWOT Analysis
- 11.2.9.4. Recent Developments
- 11.2.9.5. Financials (Based on Availability)
- 11.2.10 Siete
- 11.2.10.1. Overview
- 11.2.10.2. Products
- 11.2.10.3. SWOT Analysis
- 11.2.10.4. Recent Developments
- 11.2.10.5. Financials (Based on Availability)
- 11.2.11 PopCorners
- 11.2.11.1. Overview
- 11.2.11.2. Products
- 11.2.11.3. SWOT Analysis
- 11.2.11.4. Recent Developments
- 11.2.11.5. Financials (Based on Availability)
- 11.2.12 Jackson's Honest
- 11.2.12.1. Overview
- 11.2.12.2. Products
- 11.2.12.3. SWOT Analysis
- 11.2.12.4. Recent Developments
- 11.2.12.5. Financials (Based on Availability)
- 11.2.13 Tattooed Chef
- 11.2.13.1. Overview
- 11.2.13.2. Products
- 11.2.13.3. SWOT Analysis
- 11.2.13.4. Recent Developments
- 11.2.13.5. Financials (Based on Availability)
- 11.2.14 Utz
- 11.2.14.1. Overview
- 11.2.14.2. Products
- 11.2.14.3. SWOT Analysis
- 11.2.14.4. Recent Developments
- 11.2.14.5. Financials (Based on Availability)
- 11.2.15 Barnana
- 11.2.15.1. Overview
- 11.2.15.2. Products
- 11.2.15.3. SWOT Analysis
- 11.2.15.4. Recent Developments
- 11.2.15.5. Financials (Based on Availability)
- 11.2.16 Tia Lupita
- 11.2.16.1. Overview
- 11.2.16.2. Products
- 11.2.16.3. SWOT Analysis
- 11.2.16.4. Recent Developments
- 11.2.16.5. Financials (Based on Availability)
- 11.2.17 Bare
- 11.2.17.1. Overview
- 11.2.17.2. Products
- 11.2.17.3. SWOT Analysis
- 11.2.17.4. Recent Developments
- 11.2.17.5. Financials (Based on Availability)
- 11.2.18 Popadelics
- 11.2.18.1. Overview
- 11.2.18.2. Products
- 11.2.18.3. SWOT Analysis
- 11.2.18.4. Recent Developments
- 11.2.18.5. Financials (Based on Availability)
- 11.2.1 Beanitos
List of Figures
- Figure 1: Global Healthy Chips Revenue Breakdown (billion, %) by Region 2025 & 2033
- Figure 2: Global Healthy Chips Volume Breakdown (K, %) by Region 2025 & 2033
- Figure 3: North America Healthy Chips Revenue (billion), by Application 2025 & 2033
- Figure 4: North America Healthy Chips Volume (K), by Application 2025 & 2033
- Figure 5: North America Healthy Chips Revenue Share (%), by Application 2025 & 2033
- Figure 6: North America Healthy Chips Volume Share (%), by Application 2025 & 2033
- Figure 7: North America Healthy Chips Revenue (billion), by Type 2025 & 2033
- Figure 8: North America Healthy Chips Volume (K), by Type 2025 & 2033
- Figure 9: North America Healthy Chips Revenue Share (%), by Type 2025 & 2033
- Figure 10: North America Healthy Chips Volume Share (%), by Type 2025 & 2033
- Figure 11: North America Healthy Chips Revenue (billion), by Country 2025 & 2033
- Figure 12: North America Healthy Chips Volume (K), by Country 2025 & 2033
- Figure 13: North America Healthy Chips Revenue Share (%), by Country 2025 & 2033
- Figure 14: North America Healthy Chips Volume Share (%), by Country 2025 & 2033
- Figure 15: South America Healthy Chips Revenue (billion), by Application 2025 & 2033
- Figure 16: South America Healthy Chips Volume (K), by Application 2025 & 2033
- Figure 17: South America Healthy Chips Revenue Share (%), by Application 2025 & 2033
- Figure 18: South America Healthy Chips Volume Share (%), by Application 2025 & 2033
- Figure 19: South America Healthy Chips Revenue (billion), by Type 2025 & 2033
- Figure 20: South America Healthy Chips Volume (K), by Type 2025 & 2033
- Figure 21: South America Healthy Chips Revenue Share (%), by Type 2025 & 2033
- Figure 22: South America Healthy Chips Volume Share (%), by Type 2025 & 2033
- Figure 23: South America Healthy Chips Revenue (billion), by Country 2025 & 2033
- Figure 24: South America Healthy Chips Volume (K), by Country 2025 & 2033
- Figure 25: South America Healthy Chips Revenue Share (%), by Country 2025 & 2033
- Figure 26: South America Healthy Chips Volume Share (%), by Country 2025 & 2033
- Figure 27: Europe Healthy Chips Revenue (billion), by Application 2025 & 2033
- Figure 28: Europe Healthy Chips Volume (K), by Application 2025 & 2033
- Figure 29: Europe Healthy Chips Revenue Share (%), by Application 2025 & 2033
- Figure 30: Europe Healthy Chips Volume Share (%), by Application 2025 & 2033
- Figure 31: Europe Healthy Chips Revenue (billion), by Type 2025 & 2033
- Figure 32: Europe Healthy Chips Volume (K), by Type 2025 & 2033
- Figure 33: Europe Healthy Chips Revenue Share (%), by Type 2025 & 2033
- Figure 34: Europe Healthy Chips Volume Share (%), by Type 2025 & 2033
- Figure 35: Europe Healthy Chips Revenue (billion), by Country 2025 & 2033
- Figure 36: Europe Healthy Chips Volume (K), by Country 2025 & 2033
- Figure 37: Europe Healthy Chips Revenue Share (%), by Country 2025 & 2033
- Figure 38: Europe Healthy Chips Volume Share (%), by Country 2025 & 2033
- Figure 39: Middle East & Africa Healthy Chips Revenue (billion), by Application 2025 & 2033
- Figure 40: Middle East & Africa Healthy Chips Volume (K), by Application 2025 & 2033
- Figure 41: Middle East & Africa Healthy Chips Revenue Share (%), by Application 2025 & 2033
- Figure 42: Middle East & Africa Healthy Chips Volume Share (%), by Application 2025 & 2033
- Figure 43: Middle East & Africa Healthy Chips Revenue (billion), by Type 2025 & 2033
- Figure 44: Middle East & Africa Healthy Chips Volume (K), by Type 2025 & 2033
- Figure 45: Middle East & Africa Healthy Chips Revenue Share (%), by Type 2025 & 2033
- Figure 46: Middle East & Africa Healthy Chips Volume Share (%), by Type 2025 & 2033
- Figure 47: Middle East & Africa Healthy Chips Revenue (billion), by Country 2025 & 2033
- Figure 48: Middle East & Africa Healthy Chips Volume (K), by Country 2025 & 2033
- Figure 49: Middle East & Africa Healthy Chips Revenue Share (%), by Country 2025 & 2033
- Figure 50: Middle East & Africa Healthy Chips Volume Share (%), by Country 2025 & 2033
- Figure 51: Asia Pacific Healthy Chips Revenue (billion), by Application 2025 & 2033
- Figure 52: Asia Pacific Healthy Chips Volume (K), by Application 2025 & 2033
- Figure 53: Asia Pacific Healthy Chips Revenue Share (%), by Application 2025 & 2033
- Figure 54: Asia Pacific Healthy Chips Volume Share (%), by Application 2025 & 2033
- Figure 55: Asia Pacific Healthy Chips Revenue (billion), by Type 2025 & 2033
- Figure 56: Asia Pacific Healthy Chips Volume (K), by Type 2025 & 2033
- Figure 57: Asia Pacific Healthy Chips Revenue Share (%), by Type 2025 & 2033
- Figure 58: Asia Pacific Healthy Chips Volume Share (%), by Type 2025 & 2033
- Figure 59: Asia Pacific Healthy Chips Revenue (billion), by Country 2025 & 2033
- Figure 60: Asia Pacific Healthy Chips Volume (K), by Country 2025 & 2033
- Figure 61: Asia Pacific Healthy Chips Revenue Share (%), by Country 2025 & 2033
- Figure 62: Asia Pacific Healthy Chips Volume Share (%), by Country 2025 & 2033
List of Tables
- Table 1: Global Healthy Chips Revenue billion Forecast, by Application 2020 & 2033
- Table 2: Global Healthy Chips Volume K Forecast, by Application 2020 & 2033
- Table 3: Global Healthy Chips Revenue billion Forecast, by Type 2020 & 2033
- Table 4: Global Healthy Chips Volume K Forecast, by Type 2020 & 2033
- Table 5: Global Healthy Chips Revenue billion Forecast, by Region 2020 & 2033
- Table 6: Global Healthy Chips Volume K Forecast, by Region 2020 & 2033
- Table 7: Global Healthy Chips Revenue billion Forecast, by Application 2020 & 2033
- Table 8: Global Healthy Chips Volume K Forecast, by Application 2020 & 2033
- Table 9: Global Healthy Chips Revenue billion Forecast, by Type 2020 & 2033
- Table 10: Global Healthy Chips Volume K Forecast, by Type 2020 & 2033
- Table 11: Global Healthy Chips Revenue billion Forecast, by Country 2020 & 2033
- Table 12: Global Healthy Chips Volume K Forecast, by Country 2020 & 2033
- Table 13: United States Healthy Chips Revenue (billion) Forecast, by Application 2020 & 2033
- Table 14: United States Healthy Chips Volume (K) Forecast, by Application 2020 & 2033
- Table 15: Canada Healthy Chips Revenue (billion) Forecast, by Application 2020 & 2033
- Table 16: Canada Healthy Chips Volume (K) Forecast, by Application 2020 & 2033
- Table 17: Mexico Healthy Chips Revenue (billion) Forecast, by Application 2020 & 2033
- Table 18: Mexico Healthy Chips Volume (K) Forecast, by Application 2020 & 2033
- Table 19: Global Healthy Chips Revenue billion Forecast, by Application 2020 & 2033
- Table 20: Global Healthy Chips Volume K Forecast, by Application 2020 & 2033
- Table 21: Global Healthy Chips Revenue billion Forecast, by Type 2020 & 2033
- Table 22: Global Healthy Chips Volume K Forecast, by Type 2020 & 2033
- Table 23: Global Healthy Chips Revenue billion Forecast, by Country 2020 & 2033
- Table 24: Global Healthy Chips Volume K Forecast, by Country 2020 & 2033
- Table 25: Brazil Healthy Chips Revenue (billion) Forecast, by Application 2020 & 2033
- Table 26: Brazil Healthy Chips Volume (K) Forecast, by Application 2020 & 2033
- Table 27: Argentina Healthy Chips Revenue (billion) Forecast, by Application 2020 & 2033
- Table 28: Argentina Healthy Chips Volume (K) Forecast, by Application 2020 & 2033
- Table 29: Rest of South America Healthy Chips Revenue (billion) Forecast, by Application 2020 & 2033
- Table 30: Rest of South America Healthy Chips Volume (K) Forecast, by Application 2020 & 2033
- Table 31: Global Healthy Chips Revenue billion Forecast, by Application 2020 & 2033
- Table 32: Global Healthy Chips Volume K Forecast, by Application 2020 & 2033
- Table 33: Global Healthy Chips Revenue billion Forecast, by Type 2020 & 2033
- Table 34: Global Healthy Chips Volume K Forecast, by Type 2020 & 2033
- Table 35: Global Healthy Chips Revenue billion Forecast, by Country 2020 & 2033
- Table 36: Global Healthy Chips Volume K Forecast, by Country 2020 & 2033
- Table 37: United Kingdom Healthy Chips Revenue (billion) Forecast, by Application 2020 & 2033
- Table 38: United Kingdom Healthy Chips Volume (K) Forecast, by Application 2020 & 2033
- Table 39: Germany Healthy Chips Revenue (billion) Forecast, by Application 2020 & 2033
- Table 40: Germany Healthy Chips Volume (K) Forecast, by Application 2020 & 2033
- Table 41: France Healthy Chips Revenue (billion) Forecast, by Application 2020 & 2033
- Table 42: France Healthy Chips Volume (K) Forecast, by Application 2020 & 2033
- Table 43: Italy Healthy Chips Revenue (billion) Forecast, by Application 2020 & 2033
- Table 44: Italy Healthy Chips Volume (K) Forecast, by Application 2020 & 2033
- Table 45: Spain Healthy Chips Revenue (billion) Forecast, by Application 2020 & 2033
- Table 46: Spain Healthy Chips Volume (K) Forecast, by Application 2020 & 2033
- Table 47: Russia Healthy Chips Revenue (billion) Forecast, by Application 2020 & 2033
- Table 48: Russia Healthy Chips Volume (K) Forecast, by Application 2020 & 2033
- Table 49: Benelux Healthy Chips Revenue (billion) Forecast, by Application 2020 & 2033
- Table 50: Benelux Healthy Chips Volume (K) Forecast, by Application 2020 & 2033
- Table 51: Nordics Healthy Chips Revenue (billion) Forecast, by Application 2020 & 2033
- Table 52: Nordics Healthy Chips Volume (K) Forecast, by Application 2020 & 2033
- Table 53: Rest of Europe Healthy Chips Revenue (billion) Forecast, by Application 2020 & 2033
- Table 54: Rest of Europe Healthy Chips Volume (K) Forecast, by Application 2020 & 2033
- Table 55: Global Healthy Chips Revenue billion Forecast, by Application 2020 & 2033
- Table 56: Global Healthy Chips Volume K Forecast, by Application 2020 & 2033
- Table 57: Global Healthy Chips Revenue billion Forecast, by Type 2020 & 2033
- Table 58: Global Healthy Chips Volume K Forecast, by Type 2020 & 2033
- Table 59: Global Healthy Chips Revenue billion Forecast, by Country 2020 & 2033
- Table 60: Global Healthy Chips Volume K Forecast, by Country 2020 & 2033
- Table 61: Turkey Healthy Chips Revenue (billion) Forecast, by Application 2020 & 2033
- Table 62: Turkey Healthy Chips Volume (K) Forecast, by Application 2020 & 2033
- Table 63: Israel Healthy Chips Revenue (billion) Forecast, by Application 2020 & 2033
- Table 64: Israel Healthy Chips Volume (K) Forecast, by Application 2020 & 2033
- Table 65: GCC Healthy Chips Revenue (billion) Forecast, by Application 2020 & 2033
- Table 66: GCC Healthy Chips Volume (K) Forecast, by Application 2020 & 2033
- Table 67: North Africa Healthy Chips Revenue (billion) Forecast, by Application 2020 & 2033
- Table 68: North Africa Healthy Chips Volume (K) Forecast, by Application 2020 & 2033
- Table 69: South Africa Healthy Chips Revenue (billion) Forecast, by Application 2020 & 2033
- Table 70: South Africa Healthy Chips Volume (K) Forecast, by Application 2020 & 2033
- Table 71: Rest of Middle East & Africa Healthy Chips Revenue (billion) Forecast, by Application 2020 & 2033
- Table 72: Rest of Middle East & Africa Healthy Chips Volume (K) Forecast, by Application 2020 & 2033
- Table 73: Global Healthy Chips Revenue billion Forecast, by Application 2020 & 2033
- Table 74: Global Healthy Chips Volume K Forecast, by Application 2020 & 2033
- Table 75: Global Healthy Chips Revenue billion Forecast, by Type 2020 & 2033
- Table 76: Global Healthy Chips Volume K Forecast, by Type 2020 & 2033
- Table 77: Global Healthy Chips Revenue billion Forecast, by Country 2020 & 2033
- Table 78: Global Healthy Chips Volume K Forecast, by Country 2020 & 2033
- Table 79: China Healthy Chips Revenue (billion) Forecast, by Application 2020 & 2033
- Table 80: China Healthy Chips Volume (K) Forecast, by Application 2020 & 2033
- Table 81: India Healthy Chips Revenue (billion) Forecast, by Application 2020 & 2033
- Table 82: India Healthy Chips Volume (K) Forecast, by Application 2020 & 2033
- Table 83: Japan Healthy Chips Revenue (billion) Forecast, by Application 2020 & 2033
- Table 84: Japan Healthy Chips Volume (K) Forecast, by Application 2020 & 2033
- Table 85: South Korea Healthy Chips Revenue (billion) Forecast, by Application 2020 & 2033
- Table 86: South Korea Healthy Chips Volume (K) Forecast, by Application 2020 & 2033
- Table 87: ASEAN Healthy Chips Revenue (billion) Forecast, by Application 2020 & 2033
- Table 88: ASEAN Healthy Chips Volume (K) Forecast, by Application 2020 & 2033
- Table 89: Oceania Healthy Chips Revenue (billion) Forecast, by Application 2020 & 2033
- Table 90: Oceania Healthy Chips Volume (K) Forecast, by Application 2020 & 2033
- Table 91: Rest of Asia Pacific Healthy Chips Revenue (billion) Forecast, by Application 2020 & 2033
- Table 92: Rest of Asia Pacific Healthy Chips Volume (K) Forecast, by Application 2020 & 2033
Frequently Asked Questions
1. What is the projected Compound Annual Growth Rate (CAGR) of the Healthy Chips?
The projected CAGR is approximately 7.8%.
2. Which companies are prominent players in the Healthy Chips?
Key companies in the market include Beanitos, Kettle, Late July, Hippeas, Popchips, SunChips, Terra, Boulder Canyon, Frito-Lay, Siete, PopCorners, Jackson's Honest, Tattooed Chef, Utz, Barnana, Tia Lupita, Bare, Popadelics.
3. What are the main segments of the Healthy Chips?
The market segments include Application, Type.
4. Can you provide details about the market size?
The market size is estimated to be USD 15.18 billion as of 2022.
5. What are some drivers contributing to market growth?
N/A
6. What are the notable trends driving market growth?
N/A
7. Are there any restraints impacting market growth?
N/A
8. Can you provide examples of recent developments in the market?
N/A
9. What pricing options are available for accessing the report?
Pricing options include single-user, multi-user, and enterprise licenses priced at USD 3950.00, USD 5925.00, and USD 7900.00 respectively.
10. Is the market size provided in terms of value or volume?
The market size is provided in terms of value, measured in billion and volume, measured in K.
11. Are there any specific market keywords associated with the report?
Yes, the market keyword associated with the report is "Healthy Chips," which aids in identifying and referencing the specific market segment covered.
12. How do I determine which pricing option suits my needs best?
The pricing options vary based on user requirements and access needs. Individual users may opt for single-user licenses, while businesses requiring broader access may choose multi-user or enterprise licenses for cost-effective access to the report.
13. Are there any additional resources or data provided in the Healthy Chips report?
While the report offers comprehensive insights, it's advisable to review the specific contents or supplementary materials provided to ascertain if additional resources or data are available.
14. How can I stay updated on further developments or reports in the Healthy Chips?
To stay informed about further developments, trends, and reports in the Healthy Chips, consider subscribing to industry newsletters, following relevant companies and organizations, or regularly checking reputable industry news sources and publications.
Methodology
Step 1 - Identification of Relevant Samples Size from Population Database


Step 2 - Approaches for Defining Global Market Size (Value, Volume* & Price*)

Note*: In applicable scenarios
Step 3 - Data Sources
Primary Research
- Web Analytics
- Survey Reports
- Research Institute
- Latest Research Reports
- Opinion Leaders
Secondary Research
- Annual Reports
- White Paper
- Latest Press Release
- Industry Association
- Paid Database
- Investor Presentations

Step 4 - Data Triangulation
Involves using different sources of information in order to increase the validity of a study
These sources are likely to be stakeholders in a program - participants, other researchers, program staff, other community members, and so on.
Then we put all data in single framework & apply various statistical tools to find out the dynamic on the market.
During the analysis stage, feedback from the stakeholder groups would be compared to determine areas of agreement as well as areas of divergence