

Key Insights
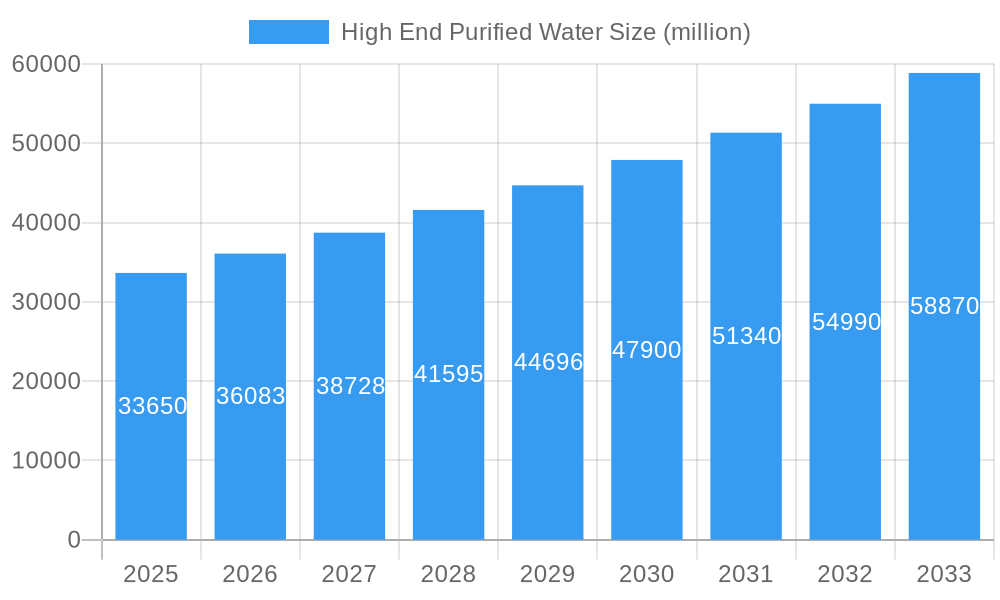
The high-end purified water market, valued at $33,650 million in 2025, is projected to experience robust growth, driven by increasing health consciousness, rising disposable incomes, and a growing preference for premium, sustainably sourced water. Consumers are increasingly seeking out purified water options that offer superior taste, purity, and unique branding, moving beyond basic hydration to a more sophisticated beverage experience. This demand is fueled by the rising popularity of wellness trends and a focus on clean living, driving consumers towards premium products perceived as healthier and more luxurious than standard bottled water. Furthermore, the market benefits from innovations in packaging, sourcing, and marketing strategies, with brands emphasizing eco-friendly practices and unique brand stories to connect with discerning consumers. The competitive landscape is marked by established players like Nestlé Waters and Coca-Cola alongside emerging niche brands focusing on specific sourcing locations and unique water properties.
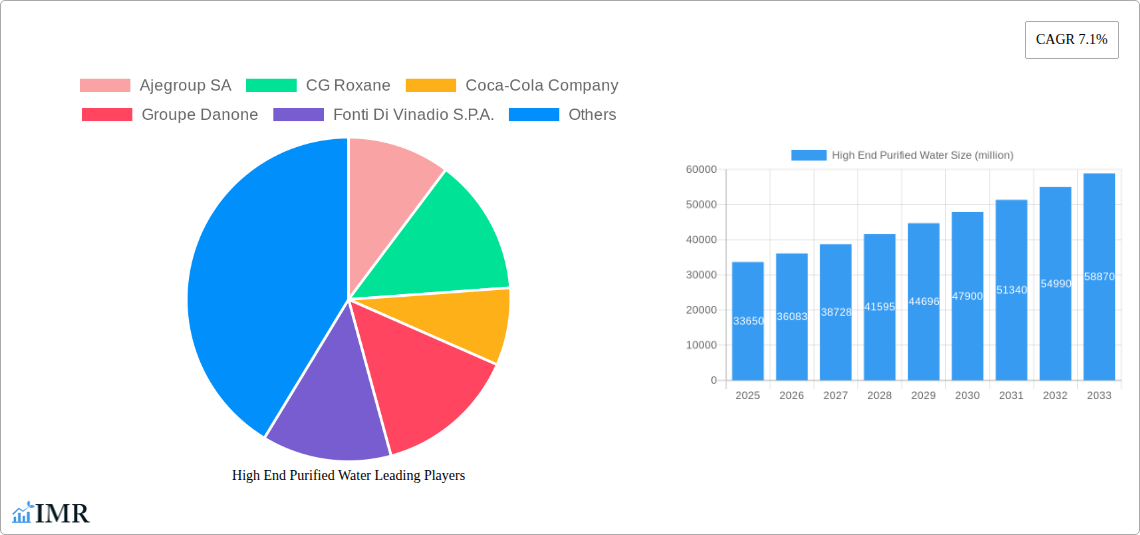
High End Purified Water Market Size (In Billion)
This market’s 7.1% CAGR suggests continued expansion through 2033. Growth will be further fueled by effective marketing campaigns highlighting the health benefits and premium positioning of these waters. While potential restraints could include fluctuating raw material costs and increasing competition, the overall market outlook remains positive, with opportunities for continued innovation and market penetration within diverse geographic regions. Strategic partnerships with high-end retailers and restaurants will also play a key role in market expansion, solidifying the perception of high-end purified water as a luxury consumable. The focus on sustainable and ethically sourced water will also become an increasingly important differentiator, attracting environmentally conscious consumers.
High End Purified Water Company Market Share
High End Purified Water Market Report: 2019-2033
This comprehensive report delivers an in-depth analysis of the High End Purified Water market, providing crucial insights for industry professionals, investors, and strategic decision-makers. The study covers the period 2019-2033, with a base year of 2025 and a forecast period of 2025-2033. This report leverages extensive market research and data analysis to offer a precise understanding of market dynamics, growth trends, and future potential within this lucrative segment of the premium beverage market. The parent market is the bottled water industry and the child market is the premium/luxury bottled water segment.
High End Purified Water Market Dynamics & Structure
This section analyzes the competitive landscape of the high-end purified water market, examining market concentration, technological advancements, regulatory landscapes, and significant M&A activities. The report provides a detailed assessment of the market's structure, identifying key players and their market share. We explore the impact of technological innovation on product development and consumer preferences, as well as the influence of regulatory frameworks on market growth and sustainability practices. Further, we assess the prevalence of substitute products and evaluate the demographic profiles of end-users within the high-end segment.
- Market Concentration: The market is moderately concentrated, with xx% market share held by the top 5 players in 2025. This is expected to remain relatively stable through 2033.
- Technological Innovation: Advancements in filtration technology, sustainable packaging, and smart water bottling are key drivers. However, high R&D costs pose a barrier to entry for smaller players.
- Regulatory Frameworks: Government regulations concerning water purity, labeling, and sustainability impact market dynamics. xx million units in fines were levied globally for non-compliance in 2024.
- Competitive Substitutes: Premium sparkling water, functional beverages, and other luxury drinks represent key competitive substitutes.
- M&A Activity: The historical period (2019-2024) saw xx M&A deals, with a predicted xx million unit increase in deal value by 2033 due to consolidation efforts.
- End-User Demographics: Affluent consumers (age 30-55) with a high disposable income and interest in health and wellness represent the primary target demographic.
High End Purified Water Growth Trends & Insights
This in-depth analysis examines the evolution of the high-end purified water market size, penetration rates, and consumer behavior shifts. We dissect technological disruptions impacting market dynamics and provide a detailed forecast based on robust methodologies. The report explores changing consumer preferences, examining factors like brand loyalty, sustainability concerns, and the growing demand for premium, functional water. The impact of health and wellness trends are also evaluated.
- Market Size: The market size was valued at xx million units in 2024 and is projected to reach xx million units by 2033, exhibiting a CAGR of xx%.
- Adoption Rates: Adoption rates are highest in developed nations with strong economies and high consumer spending on premium beverages.
- Technological Disruptions: The emergence of innovative filtration and packaging technologies continues to reshape the market.
- Consumer Behavior: Premiumization and increased demand for sustainability are driving consumer choices in this sector.
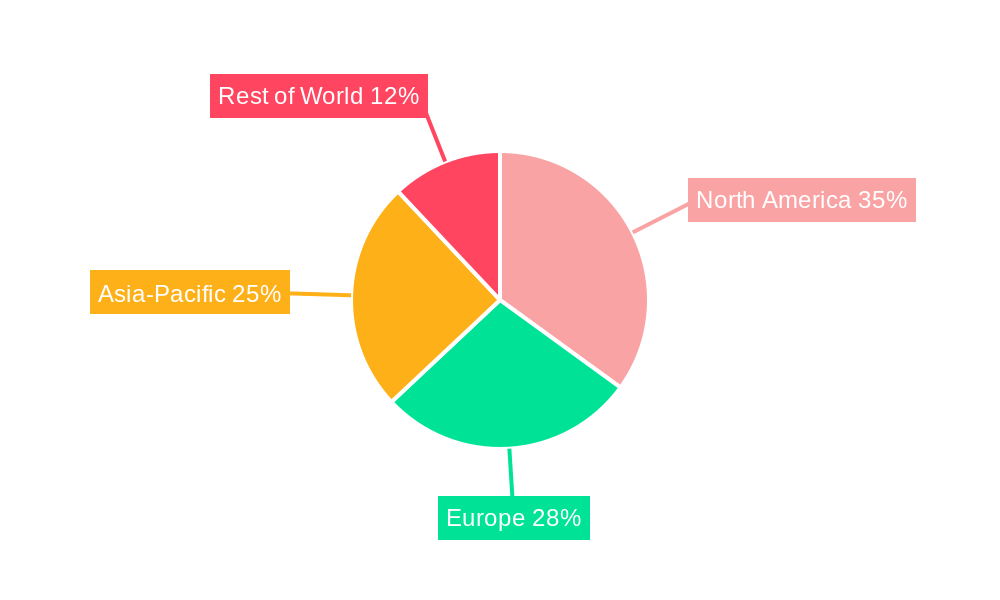
Dominant Regions, Countries, or Segments in High End Purified Water
This section pinpoints the leading geographical regions and market segments driving high-end purified water growth. A detailed analysis examines the factors fueling market dominance in these regions, including economic policies, infrastructural development, and consumer preferences. We assess the market share and growth potential of each region and segment, providing a comprehensive overview of market dynamics.
- North America: Holds the largest market share (xx%), driven by high disposable incomes and consumer preference for premium products.
- Europe: The region showcases strong growth, particularly in Western Europe (xx%), propelled by health consciousness and rising demand for natural products.
- Asia-Pacific: The region presents significant growth potential due to increasing disposable incomes and growing awareness of health and wellness (xx% growth projected).
- Key Drivers: Strong economies, robust infrastructure, and rising consumer awareness of health and wellness.
High End Purified Water Product Landscape
The high-end purified water market offers a diverse range of products with unique selling propositions and diverse applications. Technological advancements in filtration, packaging (e.g., sustainable materials), and enhanced mineral profiles cater to increasingly discerning consumer preferences. These innovations contribute to improved product quality, shelf life, and overall consumer satisfaction. Premium brands often emphasize provenance, sustainable sourcing, and unique taste profiles as key differentiators.
Key Drivers, Barriers & Challenges in High End Purified Water
Key Drivers: The market is driven by a growing demand for premium beverages, rising health consciousness, increasing disposable incomes, especially in developing nations, and escalating preference for convenience. Technological advancements also play a crucial role in creating unique product offerings and improving supply chains.
Key Challenges & Restraints: Supply chain disruptions, regulatory hurdles (e.g., labelling requirements), and intense competition from established beverage companies are significant challenges. Fluctuating raw material costs, increased transportation costs, and the growing threat of substitute products also affect the sector. These challenges create an environment where efficiency and innovation are critical for success. The potential for negative environmental impact due to plastic packaging remains a significant concern.
Emerging Opportunities in High End Purified Water
Emerging opportunities exist in untapped markets, particularly in developing regions and emerging economies. The rise of functional waters with added nutrients and electrolytes presents an area of significant growth. Innovation in packaging materials, such as sustainable alternatives to plastic, offers a pathway to meet growing consumer demands for eco-friendly products. Furthermore, the increasing trend toward personalization and customization of products allows for tailored offerings to meet niche consumer demands.
Growth Accelerators in the High End Purified Water Industry
Technological breakthroughs in filtration and water purification technologies are driving market expansion, enabling the production of increasingly pure and high-quality products. Strategic partnerships between water companies and retailers are creating stronger distribution networks and improved brand visibility. Furthermore, market expansion into new geographical regions and the successful introduction of innovative product formats contribute to enhanced growth prospects in the industry.
Key Players Shaping the High End Purified Water Market
- Ajegroup SA
- CG Roxane
- Coca-Cola Company
- Groupe Danone
- Fonti Di Vinadio S.P.A.
- Hangzhou Wahaha
- Grupo Vichy Catalan
- Icelandic Water Holdings ehf.
- Mountain Valley Spring
- Nestle Waters
- Bling H2O Inc.
- Roiwater LLC.
- Beverly Hills Drink Company, LLC.
- NEVAS GmbH.
- Lofoten Arctic Water AS.
- MINUS 181 GmbH.
- Alpine Glacier Water Inc.
- BLVD Water, LLC.
- Berg Water, LLC.
- Uisge Source Ltd.
- VEEN Water Ltd.
Notable Milestones in High End Purified Water Sector
- 2020: Introduction of a new sustainable packaging solution by Nestle Waters.
- 2021: Merger between two significant players in the European market (Company A & Company B).
- 2022: Launch of a new line of functional waters by Ajegroup SA.
- 2023: Implementation of stricter purity standards in the US market.
- 2024: Increased investment in R&D by several key players in the sector.
In-Depth High End Purified Water Market Outlook
The future of the high-end purified water market looks promising, driven by ongoing technological advancements, heightened consumer preference for healthy and premium products, and increased focus on sustainability. Expansion into emerging markets and continued innovation in product offerings will foster robust growth in the years to come. Strategic partnerships and robust marketing strategies will be crucial for companies to maintain a strong competitive edge and capitalize on the immense market potential.
High End Purified Water Segmentation
-
1. Application
- 1.1. Supermarket
- 1.2. Department Store
- 1.3. Online Retail
- 1.4. Others
-
2. Type
- 2.1. Natural Purified Water
- 2.2. Artificial Purified Water
High End Purified Water Segmentation By Geography
-
1. North America
- 1.1. United States
- 1.2. Canada
- 1.3. Mexico
-
2. South America
- 2.1. Brazil
- 2.2. Argentina
- 2.3. Rest of South America
-
3. Europe
- 3.1. United Kingdom
- 3.2. Germany
- 3.3. France
- 3.4. Italy
- 3.5. Spain
- 3.6. Russia
- 3.7. Benelux
- 3.8. Nordics
- 3.9. Rest of Europe
-
4. Middle East & Africa
- 4.1. Turkey
- 4.2. Israel
- 4.3. GCC
- 4.4. North Africa
- 4.5. South Africa
- 4.6. Rest of Middle East & Africa
-
5. Asia Pacific
- 5.1. China
- 5.2. India
- 5.3. Japan
- 5.4. South Korea
- 5.5. ASEAN
- 5.6. Oceania
- 5.7. Rest of Asia Pacific
High End Purified Water Regional Market Share
Geographic Coverage of High End Purified Water
High End Purified Water REPORT HIGHLIGHTS
| Aspects | Details |
|---|---|
| Study Period | 2020-2034 |
| Base Year | 2025 |
| Estimated Year | 2026 |
| Forecast Period | 2026-2034 |
| Historical Period | 2020-2025 |
| Growth Rate | CAGR of 7.1% from 2020-2034 |
| Segmentation |
|
Table of Contents
- 1. Introduction
- 1.1. Research Scope
- 1.2. Market Segmentation
- 1.3. Research Methodology
- 1.4. Definitions and Assumptions
- 2. Executive Summary
- 2.1. Introduction
- 3. Market Dynamics
- 3.1. Introduction
- 3.2. Market Drivers
- 3.3. Market Restrains
- 3.4. Market Trends
- 4. Market Factor Analysis
- 4.1. Porters Five Forces
- 4.2. Supply/Value Chain
- 4.3. PESTEL analysis
- 4.4. Market Entropy
- 4.5. Patent/Trademark Analysis
- 5. Global High End Purified Water Analysis, Insights and Forecast, 2020-2032
- 5.1. Market Analysis, Insights and Forecast - by Application
- 5.1.1. Supermarket
- 5.1.2. Department Store
- 5.1.3. Online Retail
- 5.1.4. Others
- 5.2. Market Analysis, Insights and Forecast - by Type
- 5.2.1. Natural Purified Water
- 5.2.2. Artificial Purified Water
- 5.3. Market Analysis, Insights and Forecast - by Region
- 5.3.1. North America
- 5.3.2. South America
- 5.3.3. Europe
- 5.3.4. Middle East & Africa
- 5.3.5. Asia Pacific
- 5.1. Market Analysis, Insights and Forecast - by Application
- 6. North America High End Purified Water Analysis, Insights and Forecast, 2020-2032
- 6.1. Market Analysis, Insights and Forecast - by Application
- 6.1.1. Supermarket
- 6.1.2. Department Store
- 6.1.3. Online Retail
- 6.1.4. Others
- 6.2. Market Analysis, Insights and Forecast - by Type
- 6.2.1. Natural Purified Water
- 6.2.2. Artificial Purified Water
- 6.1. Market Analysis, Insights and Forecast - by Application
- 7. South America High End Purified Water Analysis, Insights and Forecast, 2020-2032
- 7.1. Market Analysis, Insights and Forecast - by Application
- 7.1.1. Supermarket
- 7.1.2. Department Store
- 7.1.3. Online Retail
- 7.1.4. Others
- 7.2. Market Analysis, Insights and Forecast - by Type
- 7.2.1. Natural Purified Water
- 7.2.2. Artificial Purified Water
- 7.1. Market Analysis, Insights and Forecast - by Application
- 8. Europe High End Purified Water Analysis, Insights and Forecast, 2020-2032
- 8.1. Market Analysis, Insights and Forecast - by Application
- 8.1.1. Supermarket
- 8.1.2. Department Store
- 8.1.3. Online Retail
- 8.1.4. Others
- 8.2. Market Analysis, Insights and Forecast - by Type
- 8.2.1. Natural Purified Water
- 8.2.2. Artificial Purified Water
- 8.1. Market Analysis, Insights and Forecast - by Application
- 9. Middle East & Africa High End Purified Water Analysis, Insights and Forecast, 2020-2032
- 9.1. Market Analysis, Insights and Forecast - by Application
- 9.1.1. Supermarket
- 9.1.2. Department Store
- 9.1.3. Online Retail
- 9.1.4. Others
- 9.2. Market Analysis, Insights and Forecast - by Type
- 9.2.1. Natural Purified Water
- 9.2.2. Artificial Purified Water
- 9.1. Market Analysis, Insights and Forecast - by Application
- 10. Asia Pacific High End Purified Water Analysis, Insights and Forecast, 2020-2032
- 10.1. Market Analysis, Insights and Forecast - by Application
- 10.1.1. Supermarket
- 10.1.2. Department Store
- 10.1.3. Online Retail
- 10.1.4. Others
- 10.2. Market Analysis, Insights and Forecast - by Type
- 10.2.1. Natural Purified Water
- 10.2.2. Artificial Purified Water
- 10.1. Market Analysis, Insights and Forecast - by Application
- 11. Competitive Analysis
- 11.1. Global Market Share Analysis 2025
- 11.2. Company Profiles
- 11.2.1 Ajegroup SA
- 11.2.1.1. Overview
- 11.2.1.2. Products
- 11.2.1.3. SWOT Analysis
- 11.2.1.4. Recent Developments
- 11.2.1.5. Financials (Based on Availability)
- 11.2.2 CG Roxane
- 11.2.2.1. Overview
- 11.2.2.2. Products
- 11.2.2.3. SWOT Analysis
- 11.2.2.4. Recent Developments
- 11.2.2.5. Financials (Based on Availability)
- 11.2.3 Coca-Cola Company
- 11.2.3.1. Overview
- 11.2.3.2. Products
- 11.2.3.3. SWOT Analysis
- 11.2.3.4. Recent Developments
- 11.2.3.5. Financials (Based on Availability)
- 11.2.4 Groupe Danone
- 11.2.4.1. Overview
- 11.2.4.2. Products
- 11.2.4.3. SWOT Analysis
- 11.2.4.4. Recent Developments
- 11.2.4.5. Financials (Based on Availability)
- 11.2.5 Fonti Di Vinadio S.P.A.
- 11.2.5.1. Overview
- 11.2.5.2. Products
- 11.2.5.3. SWOT Analysis
- 11.2.5.4. Recent Developments
- 11.2.5.5. Financials (Based on Availability)
- 11.2.6 Hangzhou Wahaha
- 11.2.6.1. Overview
- 11.2.6.2. Products
- 11.2.6.3. SWOT Analysis
- 11.2.6.4. Recent Developments
- 11.2.6.5. Financials (Based on Availability)
- 11.2.7 Grupo Vichy Catalan
- 11.2.7.1. Overview
- 11.2.7.2. Products
- 11.2.7.3. SWOT Analysis
- 11.2.7.4. Recent Developments
- 11.2.7.5. Financials (Based on Availability)
- 11.2.8 Icelandic Water Holdings ehf.
- 11.2.8.1. Overview
- 11.2.8.2. Products
- 11.2.8.3. SWOT Analysis
- 11.2.8.4. Recent Developments
- 11.2.8.5. Financials (Based on Availability)
- 11.2.9 Mountain Valley Spring
- 11.2.9.1. Overview
- 11.2.9.2. Products
- 11.2.9.3. SWOT Analysis
- 11.2.9.4. Recent Developments
- 11.2.9.5. Financials (Based on Availability)
- 11.2.10 Nestle Waters
- 11.2.10.1. Overview
- 11.2.10.2. Products
- 11.2.10.3. SWOT Analysis
- 11.2.10.4. Recent Developments
- 11.2.10.5. Financials (Based on Availability)
- 11.2.11 Bling H2O Inc.
- 11.2.11.1. Overview
- 11.2.11.2. Products
- 11.2.11.3. SWOT Analysis
- 11.2.11.4. Recent Developments
- 11.2.11.5. Financials (Based on Availability)
- 11.2.12 Roiwater LLC.
- 11.2.12.1. Overview
- 11.2.12.2. Products
- 11.2.12.3. SWOT Analysis
- 11.2.12.4. Recent Developments
- 11.2.12.5. Financials (Based on Availability)
- 11.2.13 Beverly Hills Drink Company
- 11.2.13.1. Overview
- 11.2.13.2. Products
- 11.2.13.3. SWOT Analysis
- 11.2.13.4. Recent Developments
- 11.2.13.5. Financials (Based on Availability)
- 11.2.14 LLC.
- 11.2.14.1. Overview
- 11.2.14.2. Products
- 11.2.14.3. SWOT Analysis
- 11.2.14.4. Recent Developments
- 11.2.14.5. Financials (Based on Availability)
- 11.2.15 NEVAS GmbH.
- 11.2.15.1. Overview
- 11.2.15.2. Products
- 11.2.15.3. SWOT Analysis
- 11.2.15.4. Recent Developments
- 11.2.15.5. Financials (Based on Availability)
- 11.2.16 Lofoten Arctic Water AS.
- 11.2.16.1. Overview
- 11.2.16.2. Products
- 11.2.16.3. SWOT Analysis
- 11.2.16.4. Recent Developments
- 11.2.16.5. Financials (Based on Availability)
- 11.2.17 MINUS 181 GmbH.
- 11.2.17.1. Overview
- 11.2.17.2. Products
- 11.2.17.3. SWOT Analysis
- 11.2.17.4. Recent Developments
- 11.2.17.5. Financials (Based on Availability)
- 11.2.18 Alpine Glacier Water Inc.
- 11.2.18.1. Overview
- 11.2.18.2. Products
- 11.2.18.3. SWOT Analysis
- 11.2.18.4. Recent Developments
- 11.2.18.5. Financials (Based on Availability)
- 11.2.19 BLVD Water
- 11.2.19.1. Overview
- 11.2.19.2. Products
- 11.2.19.3. SWOT Analysis
- 11.2.19.4. Recent Developments
- 11.2.19.5. Financials (Based on Availability)
- 11.2.20 LLC.
- 11.2.20.1. Overview
- 11.2.20.2. Products
- 11.2.20.3. SWOT Analysis
- 11.2.20.4. Recent Developments
- 11.2.20.5. Financials (Based on Availability)
- 11.2.21 Berg Water
- 11.2.21.1. Overview
- 11.2.21.2. Products
- 11.2.21.3. SWOT Analysis
- 11.2.21.4. Recent Developments
- 11.2.21.5. Financials (Based on Availability)
- 11.2.22 LLC.
- 11.2.22.1. Overview
- 11.2.22.2. Products
- 11.2.22.3. SWOT Analysis
- 11.2.22.4. Recent Developments
- 11.2.22.5. Financials (Based on Availability)
- 11.2.23 Uisge Source Ltd.
- 11.2.23.1. Overview
- 11.2.23.2. Products
- 11.2.23.3. SWOT Analysis
- 11.2.23.4. Recent Developments
- 11.2.23.5. Financials (Based on Availability)
- 11.2.24 VEEN Water Ltd.
- 11.2.24.1. Overview
- 11.2.24.2. Products
- 11.2.24.3. SWOT Analysis
- 11.2.24.4. Recent Developments
- 11.2.24.5. Financials (Based on Availability)
- 11.2.1 Ajegroup SA
List of Figures
- Figure 1: Global High End Purified Water Revenue Breakdown (million, %) by Region 2025 & 2033
- Figure 2: Global High End Purified Water Volume Breakdown (K, %) by Region 2025 & 2033
- Figure 3: North America High End Purified Water Revenue (million), by Application 2025 & 2033
- Figure 4: North America High End Purified Water Volume (K), by Application 2025 & 2033
- Figure 5: North America High End Purified Water Revenue Share (%), by Application 2025 & 2033
- Figure 6: North America High End Purified Water Volume Share (%), by Application 2025 & 2033
- Figure 7: North America High End Purified Water Revenue (million), by Type 2025 & 2033
- Figure 8: North America High End Purified Water Volume (K), by Type 2025 & 2033
- Figure 9: North America High End Purified Water Revenue Share (%), by Type 2025 & 2033
- Figure 10: North America High End Purified Water Volume Share (%), by Type 2025 & 2033
- Figure 11: North America High End Purified Water Revenue (million), by Country 2025 & 2033
- Figure 12: North America High End Purified Water Volume (K), by Country 2025 & 2033
- Figure 13: North America High End Purified Water Revenue Share (%), by Country 2025 & 2033
- Figure 14: North America High End Purified Water Volume Share (%), by Country 2025 & 2033
- Figure 15: South America High End Purified Water Revenue (million), by Application 2025 & 2033
- Figure 16: South America High End Purified Water Volume (K), by Application 2025 & 2033
- Figure 17: South America High End Purified Water Revenue Share (%), by Application 2025 & 2033
- Figure 18: South America High End Purified Water Volume Share (%), by Application 2025 & 2033
- Figure 19: South America High End Purified Water Revenue (million), by Type 2025 & 2033
- Figure 20: South America High End Purified Water Volume (K), by Type 2025 & 2033
- Figure 21: South America High End Purified Water Revenue Share (%), by Type 2025 & 2033
- Figure 22: South America High End Purified Water Volume Share (%), by Type 2025 & 2033
- Figure 23: South America High End Purified Water Revenue (million), by Country 2025 & 2033
- Figure 24: South America High End Purified Water Volume (K), by Country 2025 & 2033
- Figure 25: South America High End Purified Water Revenue Share (%), by Country 2025 & 2033
- Figure 26: South America High End Purified Water Volume Share (%), by Country 2025 & 2033
- Figure 27: Europe High End Purified Water Revenue (million), by Application 2025 & 2033
- Figure 28: Europe High End Purified Water Volume (K), by Application 2025 & 2033
- Figure 29: Europe High End Purified Water Revenue Share (%), by Application 2025 & 2033
- Figure 30: Europe High End Purified Water Volume Share (%), by Application 2025 & 2033
- Figure 31: Europe High End Purified Water Revenue (million), by Type 2025 & 2033
- Figure 32: Europe High End Purified Water Volume (K), by Type 2025 & 2033
- Figure 33: Europe High End Purified Water Revenue Share (%), by Type 2025 & 2033
- Figure 34: Europe High End Purified Water Volume Share (%), by Type 2025 & 2033
- Figure 35: Europe High End Purified Water Revenue (million), by Country 2025 & 2033
- Figure 36: Europe High End Purified Water Volume (K), by Country 2025 & 2033
- Figure 37: Europe High End Purified Water Revenue Share (%), by Country 2025 & 2033
- Figure 38: Europe High End Purified Water Volume Share (%), by Country 2025 & 2033
- Figure 39: Middle East & Africa High End Purified Water Revenue (million), by Application 2025 & 2033
- Figure 40: Middle East & Africa High End Purified Water Volume (K), by Application 2025 & 2033
- Figure 41: Middle East & Africa High End Purified Water Revenue Share (%), by Application 2025 & 2033
- Figure 42: Middle East & Africa High End Purified Water Volume Share (%), by Application 2025 & 2033
- Figure 43: Middle East & Africa High End Purified Water Revenue (million), by Type 2025 & 2033
- Figure 44: Middle East & Africa High End Purified Water Volume (K), by Type 2025 & 2033
- Figure 45: Middle East & Africa High End Purified Water Revenue Share (%), by Type 2025 & 2033
- Figure 46: Middle East & Africa High End Purified Water Volume Share (%), by Type 2025 & 2033
- Figure 47: Middle East & Africa High End Purified Water Revenue (million), by Country 2025 & 2033
- Figure 48: Middle East & Africa High End Purified Water Volume (K), by Country 2025 & 2033
- Figure 49: Middle East & Africa High End Purified Water Revenue Share (%), by Country 2025 & 2033
- Figure 50: Middle East & Africa High End Purified Water Volume Share (%), by Country 2025 & 2033
- Figure 51: Asia Pacific High End Purified Water Revenue (million), by Application 2025 & 2033
- Figure 52: Asia Pacific High End Purified Water Volume (K), by Application 2025 & 2033
- Figure 53: Asia Pacific High End Purified Water Revenue Share (%), by Application 2025 & 2033
- Figure 54: Asia Pacific High End Purified Water Volume Share (%), by Application 2025 & 2033
- Figure 55: Asia Pacific High End Purified Water Revenue (million), by Type 2025 & 2033
- Figure 56: Asia Pacific High End Purified Water Volume (K), by Type 2025 & 2033
- Figure 57: Asia Pacific High End Purified Water Revenue Share (%), by Type 2025 & 2033
- Figure 58: Asia Pacific High End Purified Water Volume Share (%), by Type 2025 & 2033
- Figure 59: Asia Pacific High End Purified Water Revenue (million), by Country 2025 & 2033
- Figure 60: Asia Pacific High End Purified Water Volume (K), by Country 2025 & 2033
- Figure 61: Asia Pacific High End Purified Water Revenue Share (%), by Country 2025 & 2033
- Figure 62: Asia Pacific High End Purified Water Volume Share (%), by Country 2025 & 2033
List of Tables
- Table 1: Global High End Purified Water Revenue million Forecast, by Application 2020 & 2033
- Table 2: Global High End Purified Water Volume K Forecast, by Application 2020 & 2033
- Table 3: Global High End Purified Water Revenue million Forecast, by Type 2020 & 2033
- Table 4: Global High End Purified Water Volume K Forecast, by Type 2020 & 2033
- Table 5: Global High End Purified Water Revenue million Forecast, by Region 2020 & 2033
- Table 6: Global High End Purified Water Volume K Forecast, by Region 2020 & 2033
- Table 7: Global High End Purified Water Revenue million Forecast, by Application 2020 & 2033
- Table 8: Global High End Purified Water Volume K Forecast, by Application 2020 & 2033
- Table 9: Global High End Purified Water Revenue million Forecast, by Type 2020 & 2033
- Table 10: Global High End Purified Water Volume K Forecast, by Type 2020 & 2033
- Table 11: Global High End Purified Water Revenue million Forecast, by Country 2020 & 2033
- Table 12: Global High End Purified Water Volume K Forecast, by Country 2020 & 2033
- Table 13: United States High End Purified Water Revenue (million) Forecast, by Application 2020 & 2033
- Table 14: United States High End Purified Water Volume (K) Forecast, by Application 2020 & 2033
- Table 15: Canada High End Purified Water Revenue (million) Forecast, by Application 2020 & 2033
- Table 16: Canada High End Purified Water Volume (K) Forecast, by Application 2020 & 2033
- Table 17: Mexico High End Purified Water Revenue (million) Forecast, by Application 2020 & 2033
- Table 18: Mexico High End Purified Water Volume (K) Forecast, by Application 2020 & 2033
- Table 19: Global High End Purified Water Revenue million Forecast, by Application 2020 & 2033
- Table 20: Global High End Purified Water Volume K Forecast, by Application 2020 & 2033
- Table 21: Global High End Purified Water Revenue million Forecast, by Type 2020 & 2033
- Table 22: Global High End Purified Water Volume K Forecast, by Type 2020 & 2033
- Table 23: Global High End Purified Water Revenue million Forecast, by Country 2020 & 2033
- Table 24: Global High End Purified Water Volume K Forecast, by Country 2020 & 2033
- Table 25: Brazil High End Purified Water Revenue (million) Forecast, by Application 2020 & 2033
- Table 26: Brazil High End Purified Water Volume (K) Forecast, by Application 2020 & 2033
- Table 27: Argentina High End Purified Water Revenue (million) Forecast, by Application 2020 & 2033
- Table 28: Argentina High End Purified Water Volume (K) Forecast, by Application 2020 & 2033
- Table 29: Rest of South America High End Purified Water Revenue (million) Forecast, by Application 2020 & 2033
- Table 30: Rest of South America High End Purified Water Volume (K) Forecast, by Application 2020 & 2033
- Table 31: Global High End Purified Water Revenue million Forecast, by Application 2020 & 2033
- Table 32: Global High End Purified Water Volume K Forecast, by Application 2020 & 2033
- Table 33: Global High End Purified Water Revenue million Forecast, by Type 2020 & 2033
- Table 34: Global High End Purified Water Volume K Forecast, by Type 2020 & 2033
- Table 35: Global High End Purified Water Revenue million Forecast, by Country 2020 & 2033
- Table 36: Global High End Purified Water Volume K Forecast, by Country 2020 & 2033
- Table 37: United Kingdom High End Purified Water Revenue (million) Forecast, by Application 2020 & 2033
- Table 38: United Kingdom High End Purified Water Volume (K) Forecast, by Application 2020 & 2033
- Table 39: Germany High End Purified Water Revenue (million) Forecast, by Application 2020 & 2033
- Table 40: Germany High End Purified Water Volume (K) Forecast, by Application 2020 & 2033
- Table 41: France High End Purified Water Revenue (million) Forecast, by Application 2020 & 2033
- Table 42: France High End Purified Water Volume (K) Forecast, by Application 2020 & 2033
- Table 43: Italy High End Purified Water Revenue (million) Forecast, by Application 2020 & 2033
- Table 44: Italy High End Purified Water Volume (K) Forecast, by Application 2020 & 2033
- Table 45: Spain High End Purified Water Revenue (million) Forecast, by Application 2020 & 2033
- Table 46: Spain High End Purified Water Volume (K) Forecast, by Application 2020 & 2033
- Table 47: Russia High End Purified Water Revenue (million) Forecast, by Application 2020 & 2033
- Table 48: Russia High End Purified Water Volume (K) Forecast, by Application 2020 & 2033
- Table 49: Benelux High End Purified Water Revenue (million) Forecast, by Application 2020 & 2033
- Table 50: Benelux High End Purified Water Volume (K) Forecast, by Application 2020 & 2033
- Table 51: Nordics High End Purified Water Revenue (million) Forecast, by Application 2020 & 2033
- Table 52: Nordics High End Purified Water Volume (K) Forecast, by Application 2020 & 2033
- Table 53: Rest of Europe High End Purified Water Revenue (million) Forecast, by Application 2020 & 2033
- Table 54: Rest of Europe High End Purified Water Volume (K) Forecast, by Application 2020 & 2033
- Table 55: Global High End Purified Water Revenue million Forecast, by Application 2020 & 2033
- Table 56: Global High End Purified Water Volume K Forecast, by Application 2020 & 2033
- Table 57: Global High End Purified Water Revenue million Forecast, by Type 2020 & 2033
- Table 58: Global High End Purified Water Volume K Forecast, by Type 2020 & 2033
- Table 59: Global High End Purified Water Revenue million Forecast, by Country 2020 & 2033
- Table 60: Global High End Purified Water Volume K Forecast, by Country 2020 & 2033
- Table 61: Turkey High End Purified Water Revenue (million) Forecast, by Application 2020 & 2033
- Table 62: Turkey High End Purified Water Volume (K) Forecast, by Application 2020 & 2033
- Table 63: Israel High End Purified Water Revenue (million) Forecast, by Application 2020 & 2033
- Table 64: Israel High End Purified Water Volume (K) Forecast, by Application 2020 & 2033
- Table 65: GCC High End Purified Water Revenue (million) Forecast, by Application 2020 & 2033
- Table 66: GCC High End Purified Water Volume (K) Forecast, by Application 2020 & 2033
- Table 67: North Africa High End Purified Water Revenue (million) Forecast, by Application 2020 & 2033
- Table 68: North Africa High End Purified Water Volume (K) Forecast, by Application 2020 & 2033
- Table 69: South Africa High End Purified Water Revenue (million) Forecast, by Application 2020 & 2033
- Table 70: South Africa High End Purified Water Volume (K) Forecast, by Application 2020 & 2033
- Table 71: Rest of Middle East & Africa High End Purified Water Revenue (million) Forecast, by Application 2020 & 2033
- Table 72: Rest of Middle East & Africa High End Purified Water Volume (K) Forecast, by Application 2020 & 2033
- Table 73: Global High End Purified Water Revenue million Forecast, by Application 2020 & 2033
- Table 74: Global High End Purified Water Volume K Forecast, by Application 2020 & 2033
- Table 75: Global High End Purified Water Revenue million Forecast, by Type 2020 & 2033
- Table 76: Global High End Purified Water Volume K Forecast, by Type 2020 & 2033
- Table 77: Global High End Purified Water Revenue million Forecast, by Country 2020 & 2033
- Table 78: Global High End Purified Water Volume K Forecast, by Country 2020 & 2033
- Table 79: China High End Purified Water Revenue (million) Forecast, by Application 2020 & 2033
- Table 80: China High End Purified Water Volume (K) Forecast, by Application 2020 & 2033
- Table 81: India High End Purified Water Revenue (million) Forecast, by Application 2020 & 2033
- Table 82: India High End Purified Water Volume (K) Forecast, by Application 2020 & 2033
- Table 83: Japan High End Purified Water Revenue (million) Forecast, by Application 2020 & 2033
- Table 84: Japan High End Purified Water Volume (K) Forecast, by Application 2020 & 2033
- Table 85: South Korea High End Purified Water Revenue (million) Forecast, by Application 2020 & 2033
- Table 86: South Korea High End Purified Water Volume (K) Forecast, by Application 2020 & 2033
- Table 87: ASEAN High End Purified Water Revenue (million) Forecast, by Application 2020 & 2033
- Table 88: ASEAN High End Purified Water Volume (K) Forecast, by Application 2020 & 2033
- Table 89: Oceania High End Purified Water Revenue (million) Forecast, by Application 2020 & 2033
- Table 90: Oceania High End Purified Water Volume (K) Forecast, by Application 2020 & 2033
- Table 91: Rest of Asia Pacific High End Purified Water Revenue (million) Forecast, by Application 2020 & 2033
- Table 92: Rest of Asia Pacific High End Purified Water Volume (K) Forecast, by Application 2020 & 2033
Frequently Asked Questions
1. What is the projected Compound Annual Growth Rate (CAGR) of the High End Purified Water?
The projected CAGR is approximately 7.1%.
2. Which companies are prominent players in the High End Purified Water?
Key companies in the market include Ajegroup SA, CG Roxane, Coca-Cola Company, Groupe Danone, Fonti Di Vinadio S.P.A., Hangzhou Wahaha, Grupo Vichy Catalan, Icelandic Water Holdings ehf., Mountain Valley Spring, Nestle Waters, Bling H2O Inc., Roiwater LLC., Beverly Hills Drink Company, LLC., NEVAS GmbH., Lofoten Arctic Water AS., MINUS 181 GmbH., Alpine Glacier Water Inc., BLVD Water, LLC., Berg Water, LLC., Uisge Source Ltd., VEEN Water Ltd..
3. What are the main segments of the High End Purified Water?
The market segments include Application, Type.
4. Can you provide details about the market size?
The market size is estimated to be USD 33650 million as of 2022.
5. What are some drivers contributing to market growth?
N/A
6. What are the notable trends driving market growth?
N/A
7. Are there any restraints impacting market growth?
N/A
8. Can you provide examples of recent developments in the market?
N/A
9. What pricing options are available for accessing the report?
Pricing options include single-user, multi-user, and enterprise licenses priced at USD 3950.00, USD 5925.00, and USD 7900.00 respectively.
10. Is the market size provided in terms of value or volume?
The market size is provided in terms of value, measured in million and volume, measured in K.
11. Are there any specific market keywords associated with the report?
Yes, the market keyword associated with the report is "High End Purified Water," which aids in identifying and referencing the specific market segment covered.
12. How do I determine which pricing option suits my needs best?
The pricing options vary based on user requirements and access needs. Individual users may opt for single-user licenses, while businesses requiring broader access may choose multi-user or enterprise licenses for cost-effective access to the report.
13. Are there any additional resources or data provided in the High End Purified Water report?
While the report offers comprehensive insights, it's advisable to review the specific contents or supplementary materials provided to ascertain if additional resources or data are available.
14. How can I stay updated on further developments or reports in the High End Purified Water?
To stay informed about further developments, trends, and reports in the High End Purified Water, consider subscribing to industry newsletters, following relevant companies and organizations, or regularly checking reputable industry news sources and publications.
Methodology
Step 1 - Identification of Relevant Samples Size from Population Database


Step 2 - Approaches for Defining Global Market Size (Value, Volume* & Price*)

Note*: In applicable scenarios
Step 3 - Data Sources
Primary Research
- Web Analytics
- Survey Reports
- Research Institute
- Latest Research Reports
- Opinion Leaders
Secondary Research
- Annual Reports
- White Paper
- Latest Press Release
- Industry Association
- Paid Database
- Investor Presentations

Step 4 - Data Triangulation
Involves using different sources of information in order to increase the validity of a study
These sources are likely to be stakeholders in a program - participants, other researchers, program staff, other community members, and so on.
Then we put all data in single framework & apply various statistical tools to find out the dynamic on the market.
During the analysis stage, feedback from the stakeholder groups would be compared to determine areas of agreement as well as areas of divergence