

Key Insights
The global high-pressure gas-charged shock absorber market is projected for significant expansion, driven by an increasing demand for advanced vehicle safety, comfort, and performance. Automotive manufacturers are prioritizing superior ride quality and handling, particularly in luxury and performance segments, which directly fuels market growth. Innovations in lightweight, durable materials and advanced gas-charging technologies are key growth enablers. The rising popularity of SUVs and crossovers, requiring robust suspension solutions for diverse driving conditions, further bolsters market expansion. Intense competition among leading manufacturers like ZF Friedrichshafen, Tenneco, and Meritor spurs continuous product development and competitive pricing. Despite challenges from fluctuating raw material costs and supply chain volatility, the long-term outlook remains favorable, supported by global vehicle production trends and the integration of advanced driver-assistance systems (ADAS) with sophisticated suspension technologies.
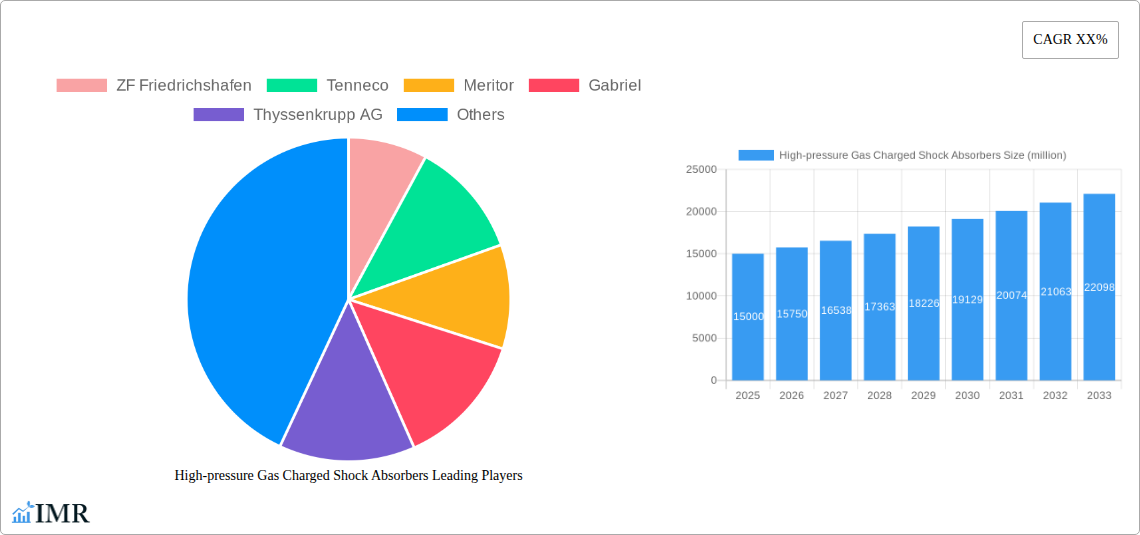
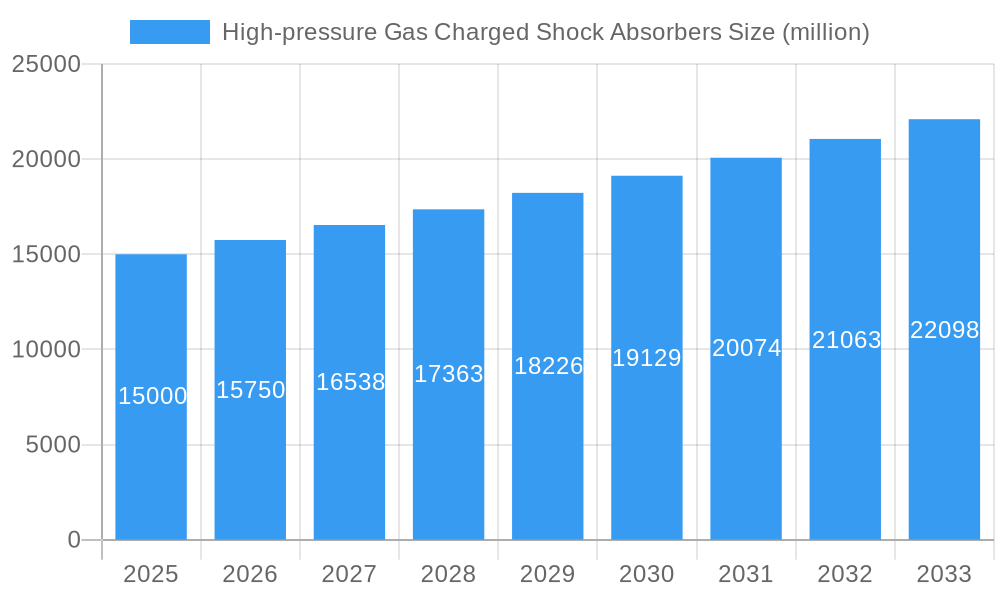
High-pressure Gas Charged Shock Absorbers Market Size (In Billion)
Market analysis indicates distinct preferences for shock absorber types based on vehicle class and regional demand. North America and Europe currently lead regional markets, attributable to high vehicle ownership and a strong emphasis on vehicle safety and comfort. However, the Asia-Pacific region is poised for the most rapid growth, driven by its expanding automotive sector and a growing middle class with rising disposable incomes. This presents a strategic opportunity for market players to enhance their presence and tailor product offerings to local needs. The forecast period, from the base year of 2025 to 2033, anticipates sustained growth, especially with the increasing adoption of electric and autonomous vehicles, which necessitate advanced shock absorber technology for optimal performance and handling.
High-pressure Gas Charged Shock Absorbers Company Market Share
The global high-pressure gas-charged shock absorber market is valued at $16.37 billion and is expected to grow at a compound annual growth rate (CAGR) of 5.1% from 2025 to 2033.
High-Pressure Gas Charged Shock Absorbers Market Report: 2019-2033
This comprehensive report provides a detailed analysis of the high-pressure gas charged shock absorbers market, encompassing market dynamics, growth trends, regional performance, product landscape, key players, and future outlook. The study period covers 2019-2033, with 2025 serving as the base and estimated year. The forecast period spans 2025-2033, and the historical period is 2019-2024. This report is crucial for automotive manufacturers, component suppliers, investors, and industry professionals seeking to understand and capitalize on this dynamic market. The market is valued at xx million units in 2025 and is projected to reach xx million units by 2033.
High-pressure Gas Charged Shock Absorbers Market Dynamics & Structure
The high-pressure gas charged shock absorber market is characterized by a moderately concentrated landscape, with key players like ZF Friedrichshafen, Tenneco, and KYB Corporation holding significant market share. Technological innovation, driven by the need for improved vehicle handling, ride comfort, and fuel efficiency, is a major driver. Stringent safety regulations and evolving emission norms further shape market dynamics. Competitive substitutes, such as conventional hydraulic shock absorbers, exert pressure, while mergers and acquisitions (M&A) activities consolidate market power.
- Market Concentration: Moderately concentrated, with top 5 players holding approximately xx% market share in 2025.
- Technological Innovation: Focus on lightweight materials, advanced valve technology, and improved damping characteristics.
- Regulatory Framework: Compliance with safety and emission standards influences product design and adoption.
- Competitive Substitutes: Hydraulic shock absorbers remain a significant competitor, particularly in cost-sensitive segments.
- M&A Activity: xx major M&A deals were recorded between 2019 and 2024, leading to market consolidation.
- End-user Demographics: Primarily driven by the automotive industry, encompassing passenger cars, light commercial vehicles (LCVs), and heavy commercial vehicles (HCVs).
High-pressure Gas Charged Shock Absorbers Growth Trends & Insights
The high-pressure gas charged shock absorber market exhibits robust growth, driven by rising vehicle production, increasing demand for enhanced vehicle dynamics, and the growing adoption of advanced driver-assistance systems (ADAS). The market experienced a CAGR of xx% during the historical period (2019-2024) and is projected to maintain a CAGR of xx% during the forecast period (2025-2033). This growth is fueled by technological advancements, including the integration of smart functionalities and improved material science. Consumer preference for superior ride comfort and safety also contributes significantly. Market penetration in emerging economies is expected to increase substantially, driven by rising disposable incomes and automotive sales.
Dominant Regions, Countries, or Segments in High-pressure Gas Charged Shock Absorbers
North America and Europe currently dominate the high-pressure gas charged shock absorber market, driven by high vehicle ownership rates, stringent emission norms, and a strong focus on vehicle safety. However, Asia-Pacific is witnessing rapid growth, fueled by expanding automotive production and increasing demand from emerging markets like China and India. The passenger car segment holds the largest market share, followed by LCVs and HCVs.
- North America: Strong demand driven by replacement and new vehicle production. Market size in 2025: xx million units.
- Europe: High adoption rates due to stringent safety regulations and consumer preference for premium vehicles. Market size in 2025: xx million units.
- Asia-Pacific: Rapid growth fueled by increasing vehicle production and rising disposable incomes. Market size in 2025: xx million units.
- Key Drivers: Favorable government policies promoting automotive sector growth, improving road infrastructure, and increasing consumer spending power.
High-pressure Gas Charged Shock Absorbers Product Landscape
High-pressure gas charged shock absorbers are available in various designs, catering to different vehicle types and performance requirements. Innovations focus on enhancing damping characteristics, reducing weight, and improving durability. Unique selling propositions include superior ride comfort, improved handling, and enhanced safety features. Technological advancements encompass the use of advanced materials, precise valve technology, and integrated sensor systems.
Key Drivers, Barriers & Challenges in High-pressure Gas Charged Shock Absorbers
Key Drivers:
- Increasing demand for enhanced vehicle dynamics and ride comfort.
- Stringent safety regulations promoting advanced suspension systems.
- Growing adoption of ADAS requiring improved shock absorber performance.
Challenges & Restraints:
- Fluctuations in raw material prices impacting production costs.
- Intense competition from established players and new entrants.
- Supply chain disruptions affecting product availability and delivery times.
Emerging Opportunities in High-pressure Gas Charged Shock Absorbers
- Expansion into emerging markets with growing automotive sectors.
- Development of lightweight and high-performance shock absorbers for electric vehicles (EVs).
- Integration of advanced functionalities like self-leveling and adaptive damping systems.
Growth Accelerators in the High-pressure Gas Charged Shock Absorbers Industry
Technological advancements in materials science and manufacturing processes are driving innovation and cost reduction. Strategic partnerships and collaborations between automotive manufacturers and shock absorber suppliers facilitate product development and market penetration. Expansion into new market segments, particularly EVs and autonomous vehicles, presents significant growth opportunities.
Key Players Shaping the High-pressure Gas Charged Shock Absorbers Market
- ZF Friedrichshafen
- Tenneco
- Meritor
- Gabriel
- Thyssenkrupp AG
- ITT Corporation
- Arnott
- KONI
- Samvardhana Motherson Group (SMG)
- Magneti Marelli
- Hitachi Automotive Systems
- Showa
- KYB Corporation
Notable Milestones in High-pressure Gas Charged Shock Absorbers Sector
- 2020: Introduction of a new lightweight gas charged shock absorber by ZF Friedrichshafen.
- 2022: Acquisition of a major shock absorber manufacturer by Tenneco, expanding its market share.
- 2023: Launch of an adaptive damping system by KYB Corporation enhancing ride comfort and handling.
In-Depth High-pressure Gas Charged Shock Absorbers Market Outlook
The high-pressure gas charged shock absorber market is poised for continued growth, driven by technological advancements, increasing vehicle production, and the rising demand for enhanced vehicle safety and performance. Strategic partnerships, expansion into new markets, and the development of innovative product offerings will shape the market landscape in the coming years. The market presents significant opportunities for both established players and new entrants.
High-pressure Gas Charged Shock Absorbers Segmentation
-
1. Application
- 1.1. Passenger Vehicle
- 1.2. Commercial Vehicle
-
2. Types
- 2.1. Mono Tube
- 2.2. Twin Tube
High-pressure Gas Charged Shock Absorbers Segmentation By Geography
-
1. North America
- 1.1. United States
- 1.2. Canada
- 1.3. Mexico
-
2. South America
- 2.1. Brazil
- 2.2. Argentina
- 2.3. Rest of South America
-
3. Europe
- 3.1. United Kingdom
- 3.2. Germany
- 3.3. France
- 3.4. Italy
- 3.5. Spain
- 3.6. Russia
- 3.7. Benelux
- 3.8. Nordics
- 3.9. Rest of Europe
-
4. Middle East & Africa
- 4.1. Turkey
- 4.2. Israel
- 4.3. GCC
- 4.4. North Africa
- 4.5. South Africa
- 4.6. Rest of Middle East & Africa
-
5. Asia Pacific
- 5.1. China
- 5.2. India
- 5.3. Japan
- 5.4. South Korea
- 5.5. ASEAN
- 5.6. Oceania
- 5.7. Rest of Asia Pacific

High-pressure Gas Charged Shock Absorbers Regional Market Share
Geographic Coverage of High-pressure Gas Charged Shock Absorbers
High-pressure Gas Charged Shock Absorbers REPORT HIGHLIGHTS
| Aspects | Details |
|---|---|
| Study Period | 2020-2034 |
| Base Year | 2025 |
| Estimated Year | 2026 |
| Forecast Period | 2026-2034 |
| Historical Period | 2020-2025 |
| Growth Rate | CAGR of 5.1% from 2020-2034 |
| Segmentation |
|
Table of Contents
- 1. Introduction
- 1.1. Research Scope
- 1.2. Market Segmentation
- 1.3. Research Objective
- 1.4. Definitions and Assumptions
- 2. Executive Summary
- 2.1. Market Snapshot
- 3. Market Dynamics
- 3.1. Market Drivers
- 3.2. Market Restrains
- 3.3. Market Trends
- 3.4. Market Opportunities
- 4. Market Factor Analysis
- 4.1. Porters Five Forces
- 4.1.1. Bargaining Power of Suppliers
- 4.1.2. Bargaining Power of Buyers
- 4.1.3. Threat of New Entrants
- 4.1.4. Threat of Substitutes
- 4.1.5. Competitive Rivalry
- 4.2. PESTEL analysis
- 4.3. BCG Analysis
- 4.3.1. Stars (High Growth, High Market Share)
- 4.3.2. Cash Cows (Low Growth, High Market Share)
- 4.3.3. Question Mark (High Growth, Low Market Share)
- 4.3.4. Dogs (Low Growth, Low Market Share)
- 4.4. Ansoff Matrix Analysis
- 4.5. Supply Chain Analysis
- 4.6. Regulatory Landscape
- 4.7. Current Market Potential and Opportunity Assessment (TAM–SAM–SOM Framework)
- 4.8. IMR Analyst Note
- 4.1. Porters Five Forces
- 5. Market Analysis, Insights and Forecast 2021-2033
- 5.1. Market Analysis, Insights and Forecast - by Application
- 5.1.1. Passenger Vehicle
- 5.1.2. Commercial Vehicle
- 5.2. Market Analysis, Insights and Forecast - by Types
- 5.2.1. Mono Tube
- 5.2.2. Twin Tube
- 5.3. Market Analysis, Insights and Forecast - by Region
- 5.3.1. North America
- 5.3.2. South America
- 5.3.3. Europe
- 5.3.4. Middle East & Africa
- 5.3.5. Asia Pacific
- 5.1. Market Analysis, Insights and Forecast - by Application
- 6. Global High-pressure Gas Charged Shock Absorbers Analysis, Insights and Forecast, 2021-2033
- 6.1. Market Analysis, Insights and Forecast - by Application
- 6.1.1. Passenger Vehicle
- 6.1.2. Commercial Vehicle
- 6.2. Market Analysis, Insights and Forecast - by Types
- 6.2.1. Mono Tube
- 6.2.2. Twin Tube
- 6.1. Market Analysis, Insights and Forecast - by Application
- 7. North America High-pressure Gas Charged Shock Absorbers Analysis, Insights and Forecast, 2020-2032
- 7.1. Market Analysis, Insights and Forecast - by Application
- 7.1.1. Passenger Vehicle
- 7.1.2. Commercial Vehicle
- 7.2. Market Analysis, Insights and Forecast - by Types
- 7.2.1. Mono Tube
- 7.2.2. Twin Tube
- 7.1. Market Analysis, Insights and Forecast - by Application
- 8. South America High-pressure Gas Charged Shock Absorbers Analysis, Insights and Forecast, 2020-2032
- 8.1. Market Analysis, Insights and Forecast - by Application
- 8.1.1. Passenger Vehicle
- 8.1.2. Commercial Vehicle
- 8.2. Market Analysis, Insights and Forecast - by Types
- 8.2.1. Mono Tube
- 8.2.2. Twin Tube
- 8.1. Market Analysis, Insights and Forecast - by Application
- 9. Europe High-pressure Gas Charged Shock Absorbers Analysis, Insights and Forecast, 2020-2032
- 9.1. Market Analysis, Insights and Forecast - by Application
- 9.1.1. Passenger Vehicle
- 9.1.2. Commercial Vehicle
- 9.2. Market Analysis, Insights and Forecast - by Types
- 9.2.1. Mono Tube
- 9.2.2. Twin Tube
- 9.1. Market Analysis, Insights and Forecast - by Application
- 10. Middle East & Africa High-pressure Gas Charged Shock Absorbers Analysis, Insights and Forecast, 2020-2032
- 10.1. Market Analysis, Insights and Forecast - by Application
- 10.1.1. Passenger Vehicle
- 10.1.2. Commercial Vehicle
- 10.2. Market Analysis, Insights and Forecast - by Types
- 10.2.1. Mono Tube
- 10.2.2. Twin Tube
- 10.1. Market Analysis, Insights and Forecast - by Application
- 11. Asia Pacific High-pressure Gas Charged Shock Absorbers Analysis, Insights and Forecast, 2020-2032
- 11.1. Market Analysis, Insights and Forecast - by Application
- 11.1.1. Passenger Vehicle
- 11.1.2. Commercial Vehicle
- 11.2. Market Analysis, Insights and Forecast - by Types
- 11.2.1. Mono Tube
- 11.2.2. Twin Tube
- 11.1. Market Analysis, Insights and Forecast - by Application
- 12. Competitive Analysis
- 12.1. Company Profiles
- 12.1.1 ZF Friedrichshafen
- 12.1.1.1. Company Overview
- 12.1.1.2. Products
- 12.1.1.3. Company Financials
- 12.1.1.4. SWOT Analysis
- 12.1.2 Tenneco
- 12.1.2.1. Company Overview
- 12.1.2.2. Products
- 12.1.2.3. Company Financials
- 12.1.2.4. SWOT Analysis
- 12.1.3 Meritor
- 12.1.3.1. Company Overview
- 12.1.3.2. Products
- 12.1.3.3. Company Financials
- 12.1.3.4. SWOT Analysis
- 12.1.4 Gabriel
- 12.1.4.1. Company Overview
- 12.1.4.2. Products
- 12.1.4.3. Company Financials
- 12.1.4.4. SWOT Analysis
- 12.1.5 Thyssenkrupp AG
- 12.1.5.1. Company Overview
- 12.1.5.2. Products
- 12.1.5.3. Company Financials
- 12.1.5.4. SWOT Analysis
- 12.1.6 ITT Corporation
- 12.1.6.1. Company Overview
- 12.1.6.2. Products
- 12.1.6.3. Company Financials
- 12.1.6.4. SWOT Analysis
- 12.1.7 Arnott
- 12.1.7.1. Company Overview
- 12.1.7.2. Products
- 12.1.7.3. Company Financials
- 12.1.7.4. SWOT Analysis
- 12.1.8 KONI
- 12.1.8.1. Company Overview
- 12.1.8.2. Products
- 12.1.8.3. Company Financials
- 12.1.8.4. SWOT Analysis
- 12.1.9 Samvardhana Motherson Group (SMG)
- 12.1.9.1. Company Overview
- 12.1.9.2. Products
- 12.1.9.3. Company Financials
- 12.1.9.4. SWOT Analysis
- 12.1.10 Magneti Marelli
- 12.1.10.1. Company Overview
- 12.1.10.2. Products
- 12.1.10.3. Company Financials
- 12.1.10.4. SWOT Analysis
- 12.1.11 Hitachi Automotive Systems
- 12.1.11.1. Company Overview
- 12.1.11.2. Products
- 12.1.11.3. Company Financials
- 12.1.11.4. SWOT Analysis
- 12.1.12 Showa
- 12.1.12.1. Company Overview
- 12.1.12.2. Products
- 12.1.12.3. Company Financials
- 12.1.12.4. SWOT Analysis
- 12.1.13 KYB Corporation
- 12.1.13.1. Company Overview
- 12.1.13.2. Products
- 12.1.13.3. Company Financials
- 12.1.13.4. SWOT Analysis
- 12.1.1 ZF Friedrichshafen
- 12.2. Market Entropy
- 12.2.1 Company's Key Areas Served
- 12.2.2 Recent Developments
- 12.3. Company Market Share Analysis 2025
- 12.3.1 Top 5 Companies Market Share Analysis
- 12.3.2 Top 3 Companies Market Share Analysis
- 12.4. List of Potential Customers
- 13. Research Methodology
List of Figures
- Figure 1: Global High-pressure Gas Charged Shock Absorbers Revenue Breakdown (billion, %) by Region 2025 & 2033
- Figure 2: Global High-pressure Gas Charged Shock Absorbers Volume Breakdown (K, %) by Region 2025 & 2033
- Figure 3: North America High-pressure Gas Charged Shock Absorbers Revenue (billion), by Application 2025 & 2033
- Figure 4: North America High-pressure Gas Charged Shock Absorbers Volume (K), by Application 2025 & 2033
- Figure 5: North America High-pressure Gas Charged Shock Absorbers Revenue Share (%), by Application 2025 & 2033
- Figure 6: North America High-pressure Gas Charged Shock Absorbers Volume Share (%), by Application 2025 & 2033
- Figure 7: North America High-pressure Gas Charged Shock Absorbers Revenue (billion), by Types 2025 & 2033
- Figure 8: North America High-pressure Gas Charged Shock Absorbers Volume (K), by Types 2025 & 2033
- Figure 9: North America High-pressure Gas Charged Shock Absorbers Revenue Share (%), by Types 2025 & 2033
- Figure 10: North America High-pressure Gas Charged Shock Absorbers Volume Share (%), by Types 2025 & 2033
- Figure 11: North America High-pressure Gas Charged Shock Absorbers Revenue (billion), by Country 2025 & 2033
- Figure 12: North America High-pressure Gas Charged Shock Absorbers Volume (K), by Country 2025 & 2033
- Figure 13: North America High-pressure Gas Charged Shock Absorbers Revenue Share (%), by Country 2025 & 2033
- Figure 14: North America High-pressure Gas Charged Shock Absorbers Volume Share (%), by Country 2025 & 2033
- Figure 15: South America High-pressure Gas Charged Shock Absorbers Revenue (billion), by Application 2025 & 2033
- Figure 16: South America High-pressure Gas Charged Shock Absorbers Volume (K), by Application 2025 & 2033
- Figure 17: South America High-pressure Gas Charged Shock Absorbers Revenue Share (%), by Application 2025 & 2033
- Figure 18: South America High-pressure Gas Charged Shock Absorbers Volume Share (%), by Application 2025 & 2033
- Figure 19: South America High-pressure Gas Charged Shock Absorbers Revenue (billion), by Types 2025 & 2033
- Figure 20: South America High-pressure Gas Charged Shock Absorbers Volume (K), by Types 2025 & 2033
- Figure 21: South America High-pressure Gas Charged Shock Absorbers Revenue Share (%), by Types 2025 & 2033
- Figure 22: South America High-pressure Gas Charged Shock Absorbers Volume Share (%), by Types 2025 & 2033
- Figure 23: South America High-pressure Gas Charged Shock Absorbers Revenue (billion), by Country 2025 & 2033
- Figure 24: South America High-pressure Gas Charged Shock Absorbers Volume (K), by Country 2025 & 2033
- Figure 25: South America High-pressure Gas Charged Shock Absorbers Revenue Share (%), by Country 2025 & 2033
- Figure 26: South America High-pressure Gas Charged Shock Absorbers Volume Share (%), by Country 2025 & 2033
- Figure 27: Europe High-pressure Gas Charged Shock Absorbers Revenue (billion), by Application 2025 & 2033
- Figure 28: Europe High-pressure Gas Charged Shock Absorbers Volume (K), by Application 2025 & 2033
- Figure 29: Europe High-pressure Gas Charged Shock Absorbers Revenue Share (%), by Application 2025 & 2033
- Figure 30: Europe High-pressure Gas Charged Shock Absorbers Volume Share (%), by Application 2025 & 2033
- Figure 31: Europe High-pressure Gas Charged Shock Absorbers Revenue (billion), by Types 2025 & 2033
- Figure 32: Europe High-pressure Gas Charged Shock Absorbers Volume (K), by Types 2025 & 2033
- Figure 33: Europe High-pressure Gas Charged Shock Absorbers Revenue Share (%), by Types 2025 & 2033
- Figure 34: Europe High-pressure Gas Charged Shock Absorbers Volume Share (%), by Types 2025 & 2033
- Figure 35: Europe High-pressure Gas Charged Shock Absorbers Revenue (billion), by Country 2025 & 2033
- Figure 36: Europe High-pressure Gas Charged Shock Absorbers Volume (K), by Country 2025 & 2033
- Figure 37: Europe High-pressure Gas Charged Shock Absorbers Revenue Share (%), by Country 2025 & 2033
- Figure 38: Europe High-pressure Gas Charged Shock Absorbers Volume Share (%), by Country 2025 & 2033
- Figure 39: Middle East & Africa High-pressure Gas Charged Shock Absorbers Revenue (billion), by Application 2025 & 2033
- Figure 40: Middle East & Africa High-pressure Gas Charged Shock Absorbers Volume (K), by Application 2025 & 2033
- Figure 41: Middle East & Africa High-pressure Gas Charged Shock Absorbers Revenue Share (%), by Application 2025 & 2033
- Figure 42: Middle East & Africa High-pressure Gas Charged Shock Absorbers Volume Share (%), by Application 2025 & 2033
- Figure 43: Middle East & Africa High-pressure Gas Charged Shock Absorbers Revenue (billion), by Types 2025 & 2033
- Figure 44: Middle East & Africa High-pressure Gas Charged Shock Absorbers Volume (K), by Types 2025 & 2033
- Figure 45: Middle East & Africa High-pressure Gas Charged Shock Absorbers Revenue Share (%), by Types 2025 & 2033
- Figure 46: Middle East & Africa High-pressure Gas Charged Shock Absorbers Volume Share (%), by Types 2025 & 2033
- Figure 47: Middle East & Africa High-pressure Gas Charged Shock Absorbers Revenue (billion), by Country 2025 & 2033
- Figure 48: Middle East & Africa High-pressure Gas Charged Shock Absorbers Volume (K), by Country 2025 & 2033
- Figure 49: Middle East & Africa High-pressure Gas Charged Shock Absorbers Revenue Share (%), by Country 2025 & 2033
- Figure 50: Middle East & Africa High-pressure Gas Charged Shock Absorbers Volume Share (%), by Country 2025 & 2033
- Figure 51: Asia Pacific High-pressure Gas Charged Shock Absorbers Revenue (billion), by Application 2025 & 2033
- Figure 52: Asia Pacific High-pressure Gas Charged Shock Absorbers Volume (K), by Application 2025 & 2033
- Figure 53: Asia Pacific High-pressure Gas Charged Shock Absorbers Revenue Share (%), by Application 2025 & 2033
- Figure 54: Asia Pacific High-pressure Gas Charged Shock Absorbers Volume Share (%), by Application 2025 & 2033
- Figure 55: Asia Pacific High-pressure Gas Charged Shock Absorbers Revenue (billion), by Types 2025 & 2033
- Figure 56: Asia Pacific High-pressure Gas Charged Shock Absorbers Volume (K), by Types 2025 & 2033
- Figure 57: Asia Pacific High-pressure Gas Charged Shock Absorbers Revenue Share (%), by Types 2025 & 2033
- Figure 58: Asia Pacific High-pressure Gas Charged Shock Absorbers Volume Share (%), by Types 2025 & 2033
- Figure 59: Asia Pacific High-pressure Gas Charged Shock Absorbers Revenue (billion), by Country 2025 & 2033
- Figure 60: Asia Pacific High-pressure Gas Charged Shock Absorbers Volume (K), by Country 2025 & 2033
- Figure 61: Asia Pacific High-pressure Gas Charged Shock Absorbers Revenue Share (%), by Country 2025 & 2033
- Figure 62: Asia Pacific High-pressure Gas Charged Shock Absorbers Volume Share (%), by Country 2025 & 2033
List of Tables
- Table 1: Global High-pressure Gas Charged Shock Absorbers Revenue billion Forecast, by Application 2020 & 2033
- Table 2: Global High-pressure Gas Charged Shock Absorbers Volume K Forecast, by Application 2020 & 2033
- Table 3: Global High-pressure Gas Charged Shock Absorbers Revenue billion Forecast, by Types 2020 & 2033
- Table 4: Global High-pressure Gas Charged Shock Absorbers Volume K Forecast, by Types 2020 & 2033
- Table 5: Global High-pressure Gas Charged Shock Absorbers Revenue billion Forecast, by Region 2020 & 2033
- Table 6: Global High-pressure Gas Charged Shock Absorbers Volume K Forecast, by Region 2020 & 2033
- Table 7: Global High-pressure Gas Charged Shock Absorbers Revenue billion Forecast, by Application 2020 & 2033
- Table 8: Global High-pressure Gas Charged Shock Absorbers Volume K Forecast, by Application 2020 & 2033
- Table 9: Global High-pressure Gas Charged Shock Absorbers Revenue billion Forecast, by Types 2020 & 2033
- Table 10: Global High-pressure Gas Charged Shock Absorbers Volume K Forecast, by Types 2020 & 2033
- Table 11: Global High-pressure Gas Charged Shock Absorbers Revenue billion Forecast, by Country 2020 & 2033
- Table 12: Global High-pressure Gas Charged Shock Absorbers Volume K Forecast, by Country 2020 & 2033
- Table 13: United States High-pressure Gas Charged Shock Absorbers Revenue (billion) Forecast, by Application 2020 & 2033
- Table 14: United States High-pressure Gas Charged Shock Absorbers Volume (K) Forecast, by Application 2020 & 2033
- Table 15: Canada High-pressure Gas Charged Shock Absorbers Revenue (billion) Forecast, by Application 2020 & 2033
- Table 16: Canada High-pressure Gas Charged Shock Absorbers Volume (K) Forecast, by Application 2020 & 2033
- Table 17: Mexico High-pressure Gas Charged Shock Absorbers Revenue (billion) Forecast, by Application 2020 & 2033
- Table 18: Mexico High-pressure Gas Charged Shock Absorbers Volume (K) Forecast, by Application 2020 & 2033
- Table 19: Global High-pressure Gas Charged Shock Absorbers Revenue billion Forecast, by Application 2020 & 2033
- Table 20: Global High-pressure Gas Charged Shock Absorbers Volume K Forecast, by Application 2020 & 2033
- Table 21: Global High-pressure Gas Charged Shock Absorbers Revenue billion Forecast, by Types 2020 & 2033
- Table 22: Global High-pressure Gas Charged Shock Absorbers Volume K Forecast, by Types 2020 & 2033
- Table 23: Global High-pressure Gas Charged Shock Absorbers Revenue billion Forecast, by Country 2020 & 2033
- Table 24: Global High-pressure Gas Charged Shock Absorbers Volume K Forecast, by Country 2020 & 2033
- Table 25: Brazil High-pressure Gas Charged Shock Absorbers Revenue (billion) Forecast, by Application 2020 & 2033
- Table 26: Brazil High-pressure Gas Charged Shock Absorbers Volume (K) Forecast, by Application 2020 & 2033
- Table 27: Argentina High-pressure Gas Charged Shock Absorbers Revenue (billion) Forecast, by Application 2020 & 2033
- Table 28: Argentina High-pressure Gas Charged Shock Absorbers Volume (K) Forecast, by Application 2020 & 2033
- Table 29: Rest of South America High-pressure Gas Charged Shock Absorbers Revenue (billion) Forecast, by Application 2020 & 2033
- Table 30: Rest of South America High-pressure Gas Charged Shock Absorbers Volume (K) Forecast, by Application 2020 & 2033
- Table 31: Global High-pressure Gas Charged Shock Absorbers Revenue billion Forecast, by Application 2020 & 2033
- Table 32: Global High-pressure Gas Charged Shock Absorbers Volume K Forecast, by Application 2020 & 2033
- Table 33: Global High-pressure Gas Charged Shock Absorbers Revenue billion Forecast, by Types 2020 & 2033
- Table 34: Global High-pressure Gas Charged Shock Absorbers Volume K Forecast, by Types 2020 & 2033
- Table 35: Global High-pressure Gas Charged Shock Absorbers Revenue billion Forecast, by Country 2020 & 2033
- Table 36: Global High-pressure Gas Charged Shock Absorbers Volume K Forecast, by Country 2020 & 2033
- Table 37: United Kingdom High-pressure Gas Charged Shock Absorbers Revenue (billion) Forecast, by Application 2020 & 2033
- Table 38: United Kingdom High-pressure Gas Charged Shock Absorbers Volume (K) Forecast, by Application 2020 & 2033
- Table 39: Germany High-pressure Gas Charged Shock Absorbers Revenue (billion) Forecast, by Application 2020 & 2033
- Table 40: Germany High-pressure Gas Charged Shock Absorbers Volume (K) Forecast, by Application 2020 & 2033
- Table 41: France High-pressure Gas Charged Shock Absorbers Revenue (billion) Forecast, by Application 2020 & 2033
- Table 42: France High-pressure Gas Charged Shock Absorbers Volume (K) Forecast, by Application 2020 & 2033
- Table 43: Italy High-pressure Gas Charged Shock Absorbers Revenue (billion) Forecast, by Application 2020 & 2033
- Table 44: Italy High-pressure Gas Charged Shock Absorbers Volume (K) Forecast, by Application 2020 & 2033
- Table 45: Spain High-pressure Gas Charged Shock Absorbers Revenue (billion) Forecast, by Application 2020 & 2033
- Table 46: Spain High-pressure Gas Charged Shock Absorbers Volume (K) Forecast, by Application 2020 & 2033
- Table 47: Russia High-pressure Gas Charged Shock Absorbers Revenue (billion) Forecast, by Application 2020 & 2033
- Table 48: Russia High-pressure Gas Charged Shock Absorbers Volume (K) Forecast, by Application 2020 & 2033
- Table 49: Benelux High-pressure Gas Charged Shock Absorbers Revenue (billion) Forecast, by Application 2020 & 2033
- Table 50: Benelux High-pressure Gas Charged Shock Absorbers Volume (K) Forecast, by Application 2020 & 2033
- Table 51: Nordics High-pressure Gas Charged Shock Absorbers Revenue (billion) Forecast, by Application 2020 & 2033
- Table 52: Nordics High-pressure Gas Charged Shock Absorbers Volume (K) Forecast, by Application 2020 & 2033
- Table 53: Rest of Europe High-pressure Gas Charged Shock Absorbers Revenue (billion) Forecast, by Application 2020 & 2033
- Table 54: Rest of Europe High-pressure Gas Charged Shock Absorbers Volume (K) Forecast, by Application 2020 & 2033
- Table 55: Global High-pressure Gas Charged Shock Absorbers Revenue billion Forecast, by Application 2020 & 2033
- Table 56: Global High-pressure Gas Charged Shock Absorbers Volume K Forecast, by Application 2020 & 2033
- Table 57: Global High-pressure Gas Charged Shock Absorbers Revenue billion Forecast, by Types 2020 & 2033
- Table 58: Global High-pressure Gas Charged Shock Absorbers Volume K Forecast, by Types 2020 & 2033
- Table 59: Global High-pressure Gas Charged Shock Absorbers Revenue billion Forecast, by Country 2020 & 2033
- Table 60: Global High-pressure Gas Charged Shock Absorbers Volume K Forecast, by Country 2020 & 2033
- Table 61: Turkey High-pressure Gas Charged Shock Absorbers Revenue (billion) Forecast, by Application 2020 & 2033
- Table 62: Turkey High-pressure Gas Charged Shock Absorbers Volume (K) Forecast, by Application 2020 & 2033
- Table 63: Israel High-pressure Gas Charged Shock Absorbers Revenue (billion) Forecast, by Application 2020 & 2033
- Table 64: Israel High-pressure Gas Charged Shock Absorbers Volume (K) Forecast, by Application 2020 & 2033
- Table 65: GCC High-pressure Gas Charged Shock Absorbers Revenue (billion) Forecast, by Application 2020 & 2033
- Table 66: GCC High-pressure Gas Charged Shock Absorbers Volume (K) Forecast, by Application 2020 & 2033
- Table 67: North Africa High-pressure Gas Charged Shock Absorbers Revenue (billion) Forecast, by Application 2020 & 2033
- Table 68: North Africa High-pressure Gas Charged Shock Absorbers Volume (K) Forecast, by Application 2020 & 2033
- Table 69: South Africa High-pressure Gas Charged Shock Absorbers Revenue (billion) Forecast, by Application 2020 & 2033
- Table 70: South Africa High-pressure Gas Charged Shock Absorbers Volume (K) Forecast, by Application 2020 & 2033
- Table 71: Rest of Middle East & Africa High-pressure Gas Charged Shock Absorbers Revenue (billion) Forecast, by Application 2020 & 2033
- Table 72: Rest of Middle East & Africa High-pressure Gas Charged Shock Absorbers Volume (K) Forecast, by Application 2020 & 2033
- Table 73: Global High-pressure Gas Charged Shock Absorbers Revenue billion Forecast, by Application 2020 & 2033
- Table 74: Global High-pressure Gas Charged Shock Absorbers Volume K Forecast, by Application 2020 & 2033
- Table 75: Global High-pressure Gas Charged Shock Absorbers Revenue billion Forecast, by Types 2020 & 2033
- Table 76: Global High-pressure Gas Charged Shock Absorbers Volume K Forecast, by Types 2020 & 2033
- Table 77: Global High-pressure Gas Charged Shock Absorbers Revenue billion Forecast, by Country 2020 & 2033
- Table 78: Global High-pressure Gas Charged Shock Absorbers Volume K Forecast, by Country 2020 & 2033
- Table 79: China High-pressure Gas Charged Shock Absorbers Revenue (billion) Forecast, by Application 2020 & 2033
- Table 80: China High-pressure Gas Charged Shock Absorbers Volume (K) Forecast, by Application 2020 & 2033
- Table 81: India High-pressure Gas Charged Shock Absorbers Revenue (billion) Forecast, by Application 2020 & 2033
- Table 82: India High-pressure Gas Charged Shock Absorbers Volume (K) Forecast, by Application 2020 & 2033
- Table 83: Japan High-pressure Gas Charged Shock Absorbers Revenue (billion) Forecast, by Application 2020 & 2033
- Table 84: Japan High-pressure Gas Charged Shock Absorbers Volume (K) Forecast, by Application 2020 & 2033
- Table 85: South Korea High-pressure Gas Charged Shock Absorbers Revenue (billion) Forecast, by Application 2020 & 2033
- Table 86: South Korea High-pressure Gas Charged Shock Absorbers Volume (K) Forecast, by Application 2020 & 2033
- Table 87: ASEAN High-pressure Gas Charged Shock Absorbers Revenue (billion) Forecast, by Application 2020 & 2033
- Table 88: ASEAN High-pressure Gas Charged Shock Absorbers Volume (K) Forecast, by Application 2020 & 2033
- Table 89: Oceania High-pressure Gas Charged Shock Absorbers Revenue (billion) Forecast, by Application 2020 & 2033
- Table 90: Oceania High-pressure Gas Charged Shock Absorbers Volume (K) Forecast, by Application 2020 & 2033
- Table 91: Rest of Asia Pacific High-pressure Gas Charged Shock Absorbers Revenue (billion) Forecast, by Application 2020 & 2033
- Table 92: Rest of Asia Pacific High-pressure Gas Charged Shock Absorbers Volume (K) Forecast, by Application 2020 & 2033
Frequently Asked Questions
1. What is the projected Compound Annual Growth Rate (CAGR) of the High-pressure Gas Charged Shock Absorbers?
The projected CAGR is approximately 5.1%.
2. Which companies are prominent players in the High-pressure Gas Charged Shock Absorbers?
Key companies in the market include ZF Friedrichshafen, Tenneco, Meritor, Gabriel, Thyssenkrupp AG, ITT Corporation, Arnott, KONI, Samvardhana Motherson Group (SMG), Magneti Marelli, Hitachi Automotive Systems, Showa, KYB Corporation.
3. What are the main segments of the High-pressure Gas Charged Shock Absorbers?
The market segments include Application, Types.
4. Can you provide details about the market size?
The market size is estimated to be USD 16.37 billion as of 2022.
5. What are some drivers contributing to market growth?
N/A
6. What are the notable trends driving market growth?
N/A
7. Are there any restraints impacting market growth?
N/A
8. Can you provide examples of recent developments in the market?
N/A
9. What pricing options are available for accessing the report?
Pricing options include single-user, multi-user, and enterprise licenses priced at USD 4350.00, USD 6525.00, and USD 8700.00 respectively.
10. Is the market size provided in terms of value or volume?
The market size is provided in terms of value, measured in billion and volume, measured in K.
11. Are there any specific market keywords associated with the report?
Yes, the market keyword associated with the report is "High-pressure Gas Charged Shock Absorbers," which aids in identifying and referencing the specific market segment covered.
12. How do I determine which pricing option suits my needs best?
The pricing options vary based on user requirements and access needs. Individual users may opt for single-user licenses, while businesses requiring broader access may choose multi-user or enterprise licenses for cost-effective access to the report.
13. Are there any additional resources or data provided in the High-pressure Gas Charged Shock Absorbers report?
While the report offers comprehensive insights, it's advisable to review the specific contents or supplementary materials provided to ascertain if additional resources or data are available.
14. How can I stay updated on further developments or reports in the High-pressure Gas Charged Shock Absorbers?
To stay informed about further developments, trends, and reports in the High-pressure Gas Charged Shock Absorbers, consider subscribing to industry newsletters, following relevant companies and organizations, or regularly checking reputable industry news sources and publications.
Methodology
Step 1 - Identification of Relevant Samples Size from Population Database


Step 2 - Approaches for Defining Global Market Size (Value, Volume* & Price*)

Note*: In applicable scenarios
Step 3 - Data Sources
Primary Research
- Web Analytics
- Survey Reports
- Research Institute
- Latest Research Reports
- Opinion Leaders
Secondary Research
- Annual Reports
- White Paper
- Latest Press Release
- Industry Association
- Paid Database
- Investor Presentations

Step 4 - Data Triangulation
Involves using different sources of information in order to increase the validity of a study
These sources are likely to be stakeholders in a program - participants, other researchers, program staff, other community members, and so on.
Then we put all data in single framework & apply various statistical tools to find out the dynamic on the market.
During the analysis stage, feedback from the stakeholder groups would be compared to determine areas of agreement as well as areas of divergence