

Key Insights
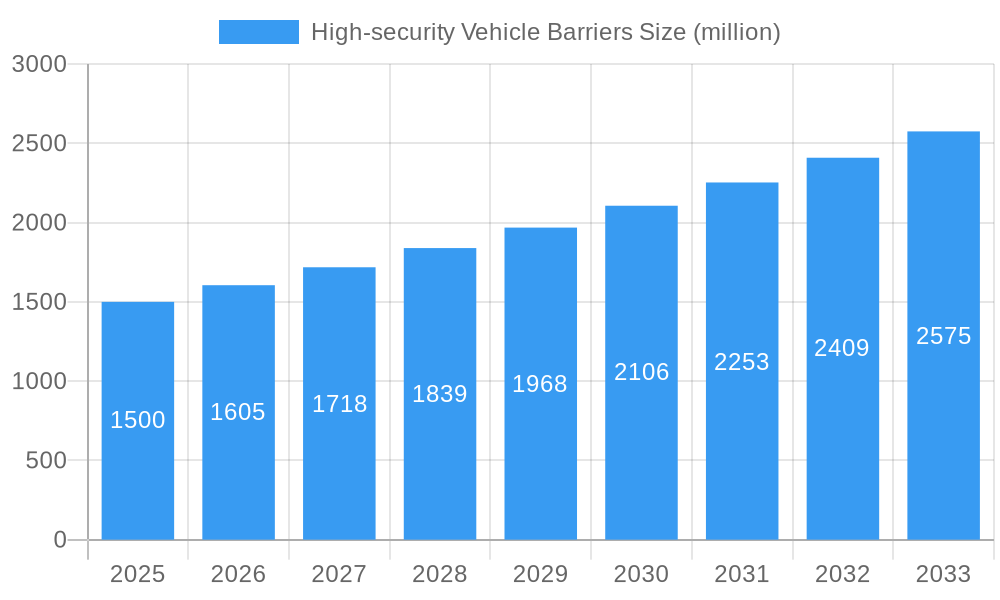
The high-security vehicle barrier market is experiencing robust growth, driven by increasing concerns over terrorism, mass shootings, and other security threats globally. The market, estimated at $1.5 billion in 2025, is projected to witness a Compound Annual Growth Rate (CAGR) of 7% from 2025 to 2033, reaching approximately $2.8 billion by 2033. This growth is fueled by several key factors: rising government investments in infrastructure security, particularly in airports, government buildings, and critical infrastructure sites; the increasing adoption of advanced technologies like automated bollards and remote-controlled barriers; and a growing demand for integrated security systems that incorporate vehicle barriers with other security measures such as surveillance and access control. Key market segments include rising demand for automated and remotely operated systems and increasing adoption across different end-user segments like military, commercial and residential areas.
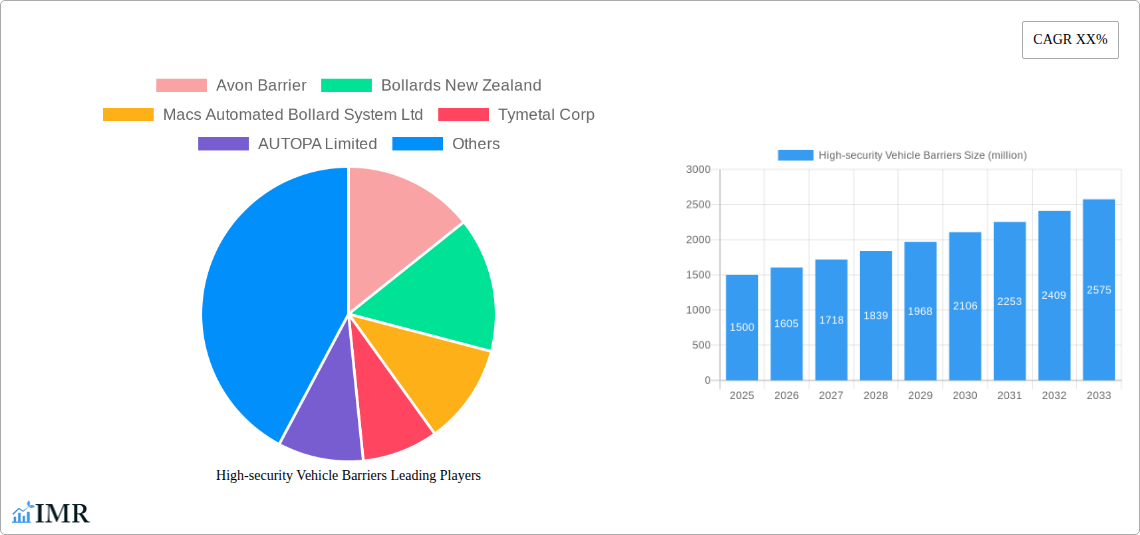
High-security Vehicle Barriers Market Size (In Billion)
Despite this positive outlook, the market faces certain restraints. High initial investment costs associated with installing and maintaining high-security vehicle barriers can be a deterrent for smaller organizations and businesses. Furthermore, the market is influenced by economic factors, such as fluctuations in government spending and the overall economic climate which can affect the willingness of businesses to invest in these relatively expensive security solutions. Competitive pressures from established and emerging players are also shaping market dynamics, necessitating continuous innovation and differentiation in product offerings and services. This is spurring further innovation within the market; leading to more cost-effective, efficient and advanced solutions. The ongoing development of sophisticated technologies, designed to enhance the effectiveness and interoperability of these security systems is pushing the boundaries of the field and creating opportunities for further growth within this market.
High-security Vehicle Barriers Company Market Share
High-Security Vehicle Barriers Market Report: 2019-2033
This comprehensive report provides a detailed analysis of the high-security vehicle barriers market, offering invaluable insights for industry professionals, investors, and strategic decision-makers. The study period spans from 2019 to 2033, with 2025 serving as both the base and estimated year. The forecast period covers 2025-2033, and the historical period encompasses 2019-2024. The report covers the parent market of Security Systems and the child market of Vehicle Access Control Systems. The global market size is projected to reach xx million units by 2033.
High-security Vehicle Barriers Market Dynamics & Structure
This section analyzes the competitive landscape, technological advancements, regulatory influences, and market trends shaping the high-security vehicle barriers industry. The market is characterized by a moderately concentrated structure, with key players such as Avon Barrier, Delta Scientific, and ATG Access holding significant market share. However, smaller, specialized companies are also making inroads, particularly in niche applications.
- Market Concentration: The top 5 players hold an estimated xx% market share in 2025.
- Technological Innovation: Advancements in materials science (e.g., higher-strength steel and composites), automation (e.g., intelligent control systems), and sensor technology are driving innovation.
- Regulatory Framework: Stringent safety and security regulations, particularly in government and critical infrastructure sectors, are influencing market growth and product development. Compliance requirements are a significant barrier to entry for new players.
- Competitive Product Substitutes: Alternative security measures, such as perimeter fencing and CCTV systems, present competitive challenges.
- End-User Demographics: Key end-users include government agencies, military facilities, airports, and critical infrastructure sites. The demand for high security is particularly high in regions with heightened security concerns.
- M&A Trends: The past five years have witnessed xx M&A deals in the high-security vehicle barrier sector, primarily driven by consolidation and expansion into new geographical markets. Strategic partnerships are also on the rise.
High-security Vehicle Barriers Growth Trends & Insights
The high-security vehicle barriers market has experienced consistent growth during the historical period (2019-2024), driven primarily by increasing security concerns and investments in infrastructure development. This trend is projected to continue throughout the forecast period (2025-2033), with a projected CAGR of xx%. The market penetration rate is estimated at xx% in 2025 and is expected to grow to xx% by 2033, as adoption accelerates in both developed and developing economies. Technological disruptions, such as the integration of AI and IoT, are further fueling market expansion. Changing consumer preferences toward advanced, automated, and integrated security solutions are also contributing to this growth. The market size is projected to reach xx million units by 2033.
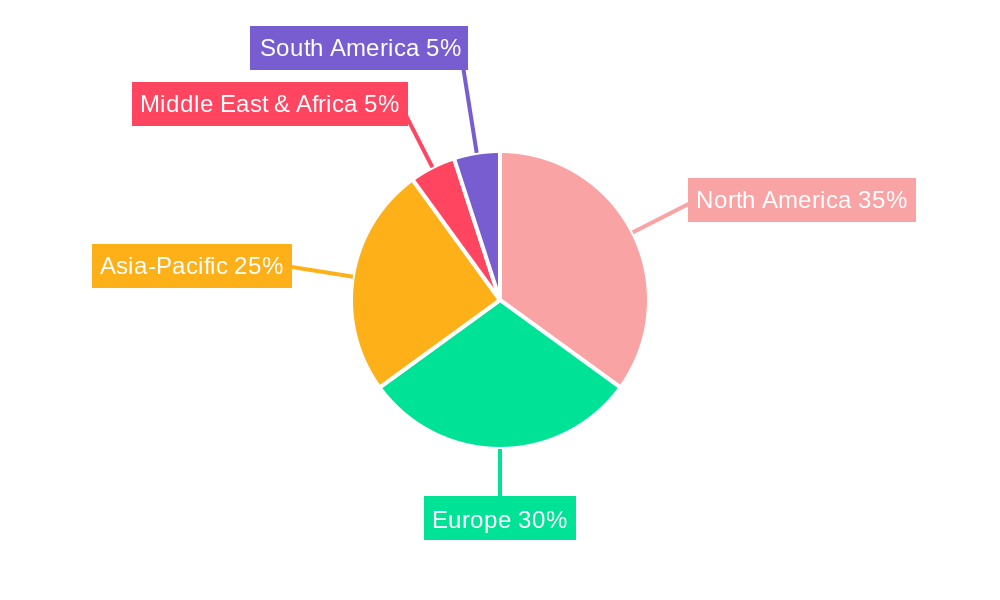
Dominant Regions, Countries, or Segments in High-security Vehicle Barriers
North America currently holds the largest market share, driven by robust investments in security infrastructure and stringent government regulations. However, the Asia-Pacific region is expected to witness the highest growth rate during the forecast period, fueled by rapid urbanization, economic growth, and increasing security concerns.
- Key Drivers in North America: Stringent security regulations, high government spending on security infrastructure, and presence of major market players.
- Key Drivers in Asia-Pacific: Rapid urbanization, rising disposable incomes, increasing government investments in security and infrastructure projects.
- Market Share: North America holds approximately xx% of the market share, followed by Europe at xx%, and Asia-Pacific at xx% in 2025. Growth projections indicate a shift in market share toward Asia-Pacific over the forecast period.
High-security Vehicle Barriers Product Landscape
The high-security vehicle barriers market offers a range of products, including retractable bollards, rising bollards, road blockers, and crash-rated gates. Product innovation focuses on enhancing security features, improving automation, and integrating intelligent control systems. Unique selling propositions include advanced materials, increased stopping power, and seamless integration with existing security systems. Recent advancements include the use of integrated sensor technologies and remote monitoring capabilities.
Key Drivers, Barriers & Challenges in High-security Vehicle Barriers
Key Drivers: Increasing global security concerns, rising investments in infrastructure, stringent government regulations, and technological advancements.
Key Challenges: High initial investment costs, complex installation processes, potential supply chain disruptions, and intense competition among existing players.
Emerging Opportunities in High-security Vehicle Barriers
Emerging opportunities lie in the integration of smart technologies, expansion into untapped markets (e.g., developing economies), and development of specialized solutions for niche applications (e.g., high-speed rail security). The growing demand for integrated security systems presents significant opportunities for expanding the application and value of high-security vehicle barriers.
Growth Accelerators in the High-security Vehicle Barriers Industry
Technological breakthroughs in materials science, automation, and sensor integration are key growth accelerators. Strategic partnerships between security system providers and infrastructure developers are also playing a vital role. Expansion into new markets, particularly in developing economies with rapid infrastructure development, presents significant long-term growth potential.
Key Players Shaping the High-security Vehicle Barriers Market
- Avon Barrier
- Bollards New Zealand
- Macs Automated Bollard System Ltd
- Tymetal Corp
- AUTOPA Limited
- Jacksons Security
- ATG Access
- Delta Scientific
- Glasdon
- Neptune Automatic
- Leda Security
- Atlantic Anti-Ram
- KAVASS Security Tech Limited
Notable Milestones in High-security Vehicle Barrier Sector
- 2021-Q3: Delta Scientific launches its new, AI-powered automated bollard system.
- 2022-Q1: Avon Barrier announces a strategic partnership with a major infrastructure developer in the Middle East.
- 2023-Q2: ATG Access acquires a smaller competitor, expanding its product portfolio.
In-Depth High-security Vehicle Barriers Market Outlook
The high-security vehicle barriers market is poised for significant growth over the next decade, driven by ongoing technological advancements, increasing security concerns globally, and expansion into new markets. Strategic partnerships and investments in research and development will be crucial for players seeking to capitalize on emerging opportunities and maintain a competitive edge in this dynamic market. The focus on integrated security solutions and smart technologies will continue to shape the future of the industry.
High-security Vehicle Barriers Segmentation
-
1. Application
- 1.1. Residential
- 1.2. Commercial
- 1.3. Industrial
-
2. Types
- 2.1. Fixed
- 2.2. Removable
- 2.3. Retractable
- 2.4. Others
High-security Vehicle Barriers Segmentation By Geography
-
1. North America
- 1.1. United States
- 1.2. Canada
- 1.3. Mexico
-
2. South America
- 2.1. Brazil
- 2.2. Argentina
- 2.3. Rest of South America
-
3. Europe
- 3.1. United Kingdom
- 3.2. Germany
- 3.3. France
- 3.4. Italy
- 3.5. Spain
- 3.6. Russia
- 3.7. Benelux
- 3.8. Nordics
- 3.9. Rest of Europe
-
4. Middle East & Africa
- 4.1. Turkey
- 4.2. Israel
- 4.3. GCC
- 4.4. North Africa
- 4.5. South Africa
- 4.6. Rest of Middle East & Africa
-
5. Asia Pacific
- 5.1. China
- 5.2. India
- 5.3. Japan
- 5.4. South Korea
- 5.5. ASEAN
- 5.6. Oceania
- 5.7. Rest of Asia Pacific
High-security Vehicle Barriers Regional Market Share
Geographic Coverage of High-security Vehicle Barriers
High-security Vehicle Barriers REPORT HIGHLIGHTS
| Aspects | Details |
|---|---|
| Study Period | 2020-2034 |
| Base Year | 2025 |
| Estimated Year | 2026 |
| Forecast Period | 2026-2034 |
| Historical Period | 2020-2025 |
| Growth Rate | CAGR of 12.5% from 2020-2034 |
| Segmentation |
|
Table of Contents
- 1. Introduction
- 1.1. Research Scope
- 1.2. Market Segmentation
- 1.3. Research Objective
- 1.4. Definitions and Assumptions
- 2. Executive Summary
- 2.1. Market Snapshot
- 3. Market Dynamics
- 3.1. Market Drivers
- 3.2. Market Restrains
- 3.3. Market Trends
- 3.4. Market Opportunities
- 4. Market Factor Analysis
- 4.1. Porters Five Forces
- 4.1.1. Bargaining Power of Suppliers
- 4.1.2. Bargaining Power of Buyers
- 4.1.3. Threat of New Entrants
- 4.1.4. Threat of Substitutes
- 4.1.5. Competitive Rivalry
- 4.2. PESTEL analysis
- 4.3. BCG Analysis
- 4.3.1. Stars (High Growth, High Market Share)
- 4.3.2. Cash Cows (Low Growth, High Market Share)
- 4.3.3. Question Mark (High Growth, Low Market Share)
- 4.3.4. Dogs (Low Growth, Low Market Share)
- 4.4. Ansoff Matrix Analysis
- 4.5. Supply Chain Analysis
- 4.6. Regulatory Landscape
- 4.7. Current Market Potential and Opportunity Assessment (TAM–SAM–SOM Framework)
- 4.8. IMR Analyst Note
- 4.1. Porters Five Forces
- 5. Market Analysis, Insights and Forecast 2021-2033
- 5.1. Market Analysis, Insights and Forecast - by Application
- 5.1.1. Residential
- 5.1.2. Commercial
- 5.1.3. Industrial
- 5.2. Market Analysis, Insights and Forecast - by Types
- 5.2.1. Fixed
- 5.2.2. Removable
- 5.2.3. Retractable
- 5.2.4. Others
- 5.3. Market Analysis, Insights and Forecast - by Region
- 5.3.1. North America
- 5.3.2. South America
- 5.3.3. Europe
- 5.3.4. Middle East & Africa
- 5.3.5. Asia Pacific
- 5.1. Market Analysis, Insights and Forecast - by Application
- 6. Global High-security Vehicle Barriers Analysis, Insights and Forecast, 2021-2033
- 6.1. Market Analysis, Insights and Forecast - by Application
- 6.1.1. Residential
- 6.1.2. Commercial
- 6.1.3. Industrial
- 6.2. Market Analysis, Insights and Forecast - by Types
- 6.2.1. Fixed
- 6.2.2. Removable
- 6.2.3. Retractable
- 6.2.4. Others
- 6.1. Market Analysis, Insights and Forecast - by Application
- 7. North America High-security Vehicle Barriers Analysis, Insights and Forecast, 2020-2032
- 7.1. Market Analysis, Insights and Forecast - by Application
- 7.1.1. Residential
- 7.1.2. Commercial
- 7.1.3. Industrial
- 7.2. Market Analysis, Insights and Forecast - by Types
- 7.2.1. Fixed
- 7.2.2. Removable
- 7.2.3. Retractable
- 7.2.4. Others
- 7.1. Market Analysis, Insights and Forecast - by Application
- 8. South America High-security Vehicle Barriers Analysis, Insights and Forecast, 2020-2032
- 8.1. Market Analysis, Insights and Forecast - by Application
- 8.1.1. Residential
- 8.1.2. Commercial
- 8.1.3. Industrial
- 8.2. Market Analysis, Insights and Forecast - by Types
- 8.2.1. Fixed
- 8.2.2. Removable
- 8.2.3. Retractable
- 8.2.4. Others
- 8.1. Market Analysis, Insights and Forecast - by Application
- 9. Europe High-security Vehicle Barriers Analysis, Insights and Forecast, 2020-2032
- 9.1. Market Analysis, Insights and Forecast - by Application
- 9.1.1. Residential
- 9.1.2. Commercial
- 9.1.3. Industrial
- 9.2. Market Analysis, Insights and Forecast - by Types
- 9.2.1. Fixed
- 9.2.2. Removable
- 9.2.3. Retractable
- 9.2.4. Others
- 9.1. Market Analysis, Insights and Forecast - by Application
- 10. Middle East & Africa High-security Vehicle Barriers Analysis, Insights and Forecast, 2020-2032
- 10.1. Market Analysis, Insights and Forecast - by Application
- 10.1.1. Residential
- 10.1.2. Commercial
- 10.1.3. Industrial
- 10.2. Market Analysis, Insights and Forecast - by Types
- 10.2.1. Fixed
- 10.2.2. Removable
- 10.2.3. Retractable
- 10.2.4. Others
- 10.1. Market Analysis, Insights and Forecast - by Application
- 11. Asia Pacific High-security Vehicle Barriers Analysis, Insights and Forecast, 2020-2032
- 11.1. Market Analysis, Insights and Forecast - by Application
- 11.1.1. Residential
- 11.1.2. Commercial
- 11.1.3. Industrial
- 11.2. Market Analysis, Insights and Forecast - by Types
- 11.2.1. Fixed
- 11.2.2. Removable
- 11.2.3. Retractable
- 11.2.4. Others
- 11.1. Market Analysis, Insights and Forecast - by Application
- 12. Competitive Analysis
- 12.1. Company Profiles
- 12.1.1 Avon Barrier
- 12.1.1.1. Company Overview
- 12.1.1.2. Products
- 12.1.1.3. Company Financials
- 12.1.1.4. SWOT Analysis
- 12.1.2 Bollards New Zealand
- 12.1.2.1. Company Overview
- 12.1.2.2. Products
- 12.1.2.3. Company Financials
- 12.1.2.4. SWOT Analysis
- 12.1.3 Macs Automated Bollard System Ltd
- 12.1.3.1. Company Overview
- 12.1.3.2. Products
- 12.1.3.3. Company Financials
- 12.1.3.4. SWOT Analysis
- 12.1.4 Tymetal Corp
- 12.1.4.1. Company Overview
- 12.1.4.2. Products
- 12.1.4.3. Company Financials
- 12.1.4.4. SWOT Analysis
- 12.1.5 AUTOPA Limited
- 12.1.5.1. Company Overview
- 12.1.5.2. Products
- 12.1.5.3. Company Financials
- 12.1.5.4. SWOT Analysis
- 12.1.6 Jacksons Security
- 12.1.6.1. Company Overview
- 12.1.6.2. Products
- 12.1.6.3. Company Financials
- 12.1.6.4. SWOT Analysis
- 12.1.7 ATG Access
- 12.1.7.1. Company Overview
- 12.1.7.2. Products
- 12.1.7.3. Company Financials
- 12.1.7.4. SWOT Analysis
- 12.1.8 Delta Scientific
- 12.1.8.1. Company Overview
- 12.1.8.2. Products
- 12.1.8.3. Company Financials
- 12.1.8.4. SWOT Analysis
- 12.1.9 Glasdon
- 12.1.9.1. Company Overview
- 12.1.9.2. Products
- 12.1.9.3. Company Financials
- 12.1.9.4. SWOT Analysis
- 12.1.10 Neptune Automatic
- 12.1.10.1. Company Overview
- 12.1.10.2. Products
- 12.1.10.3. Company Financials
- 12.1.10.4. SWOT Analysis
- 12.1.11 Leda Security
- 12.1.11.1. Company Overview
- 12.1.11.2. Products
- 12.1.11.3. Company Financials
- 12.1.11.4. SWOT Analysis
- 12.1.12 Atlantic Anti-Ram
- 12.1.12.1. Company Overview
- 12.1.12.2. Products
- 12.1.12.3. Company Financials
- 12.1.12.4. SWOT Analysis
- 12.1.13 KAVASS Security Tech Limited
- 12.1.13.1. Company Overview
- 12.1.13.2. Products
- 12.1.13.3. Company Financials
- 12.1.13.4. SWOT Analysis
- 12.1.1 Avon Barrier
- 12.2. Market Entropy
- 12.2.1 Company's Key Areas Served
- 12.2.2 Recent Developments
- 12.3. Company Market Share Analysis 2025
- 12.3.1 Top 5 Companies Market Share Analysis
- 12.3.2 Top 3 Companies Market Share Analysis
- 12.4. List of Potential Customers
- 13. Research Methodology
List of Figures
- Figure 1: Global High-security Vehicle Barriers Revenue Breakdown (undefined, %) by Region 2025 & 2033
- Figure 2: North America High-security Vehicle Barriers Revenue (undefined), by Application 2025 & 2033
- Figure 3: North America High-security Vehicle Barriers Revenue Share (%), by Application 2025 & 2033
- Figure 4: North America High-security Vehicle Barriers Revenue (undefined), by Types 2025 & 2033
- Figure 5: North America High-security Vehicle Barriers Revenue Share (%), by Types 2025 & 2033
- Figure 6: North America High-security Vehicle Barriers Revenue (undefined), by Country 2025 & 2033
- Figure 7: North America High-security Vehicle Barriers Revenue Share (%), by Country 2025 & 2033
- Figure 8: South America High-security Vehicle Barriers Revenue (undefined), by Application 2025 & 2033
- Figure 9: South America High-security Vehicle Barriers Revenue Share (%), by Application 2025 & 2033
- Figure 10: South America High-security Vehicle Barriers Revenue (undefined), by Types 2025 & 2033
- Figure 11: South America High-security Vehicle Barriers Revenue Share (%), by Types 2025 & 2033
- Figure 12: South America High-security Vehicle Barriers Revenue (undefined), by Country 2025 & 2033
- Figure 13: South America High-security Vehicle Barriers Revenue Share (%), by Country 2025 & 2033
- Figure 14: Europe High-security Vehicle Barriers Revenue (undefined), by Application 2025 & 2033
- Figure 15: Europe High-security Vehicle Barriers Revenue Share (%), by Application 2025 & 2033
- Figure 16: Europe High-security Vehicle Barriers Revenue (undefined), by Types 2025 & 2033
- Figure 17: Europe High-security Vehicle Barriers Revenue Share (%), by Types 2025 & 2033
- Figure 18: Europe High-security Vehicle Barriers Revenue (undefined), by Country 2025 & 2033
- Figure 19: Europe High-security Vehicle Barriers Revenue Share (%), by Country 2025 & 2033
- Figure 20: Middle East & Africa High-security Vehicle Barriers Revenue (undefined), by Application 2025 & 2033
- Figure 21: Middle East & Africa High-security Vehicle Barriers Revenue Share (%), by Application 2025 & 2033
- Figure 22: Middle East & Africa High-security Vehicle Barriers Revenue (undefined), by Types 2025 & 2033
- Figure 23: Middle East & Africa High-security Vehicle Barriers Revenue Share (%), by Types 2025 & 2033
- Figure 24: Middle East & Africa High-security Vehicle Barriers Revenue (undefined), by Country 2025 & 2033
- Figure 25: Middle East & Africa High-security Vehicle Barriers Revenue Share (%), by Country 2025 & 2033
- Figure 26: Asia Pacific High-security Vehicle Barriers Revenue (undefined), by Application 2025 & 2033
- Figure 27: Asia Pacific High-security Vehicle Barriers Revenue Share (%), by Application 2025 & 2033
- Figure 28: Asia Pacific High-security Vehicle Barriers Revenue (undefined), by Types 2025 & 2033
- Figure 29: Asia Pacific High-security Vehicle Barriers Revenue Share (%), by Types 2025 & 2033
- Figure 30: Asia Pacific High-security Vehicle Barriers Revenue (undefined), by Country 2025 & 2033
- Figure 31: Asia Pacific High-security Vehicle Barriers Revenue Share (%), by Country 2025 & 2033
List of Tables
- Table 1: Global High-security Vehicle Barriers Revenue undefined Forecast, by Application 2020 & 2033
- Table 2: Global High-security Vehicle Barriers Revenue undefined Forecast, by Types 2020 & 2033
- Table 3: Global High-security Vehicle Barriers Revenue undefined Forecast, by Region 2020 & 2033
- Table 4: Global High-security Vehicle Barriers Revenue undefined Forecast, by Application 2020 & 2033
- Table 5: Global High-security Vehicle Barriers Revenue undefined Forecast, by Types 2020 & 2033
- Table 6: Global High-security Vehicle Barriers Revenue undefined Forecast, by Country 2020 & 2033
- Table 7: United States High-security Vehicle Barriers Revenue (undefined) Forecast, by Application 2020 & 2033
- Table 8: Canada High-security Vehicle Barriers Revenue (undefined) Forecast, by Application 2020 & 2033
- Table 9: Mexico High-security Vehicle Barriers Revenue (undefined) Forecast, by Application 2020 & 2033
- Table 10: Global High-security Vehicle Barriers Revenue undefined Forecast, by Application 2020 & 2033
- Table 11: Global High-security Vehicle Barriers Revenue undefined Forecast, by Types 2020 & 2033
- Table 12: Global High-security Vehicle Barriers Revenue undefined Forecast, by Country 2020 & 2033
- Table 13: Brazil High-security Vehicle Barriers Revenue (undefined) Forecast, by Application 2020 & 2033
- Table 14: Argentina High-security Vehicle Barriers Revenue (undefined) Forecast, by Application 2020 & 2033
- Table 15: Rest of South America High-security Vehicle Barriers Revenue (undefined) Forecast, by Application 2020 & 2033
- Table 16: Global High-security Vehicle Barriers Revenue undefined Forecast, by Application 2020 & 2033
- Table 17: Global High-security Vehicle Barriers Revenue undefined Forecast, by Types 2020 & 2033
- Table 18: Global High-security Vehicle Barriers Revenue undefined Forecast, by Country 2020 & 2033
- Table 19: United Kingdom High-security Vehicle Barriers Revenue (undefined) Forecast, by Application 2020 & 2033
- Table 20: Germany High-security Vehicle Barriers Revenue (undefined) Forecast, by Application 2020 & 2033
- Table 21: France High-security Vehicle Barriers Revenue (undefined) Forecast, by Application 2020 & 2033
- Table 22: Italy High-security Vehicle Barriers Revenue (undefined) Forecast, by Application 2020 & 2033
- Table 23: Spain High-security Vehicle Barriers Revenue (undefined) Forecast, by Application 2020 & 2033
- Table 24: Russia High-security Vehicle Barriers Revenue (undefined) Forecast, by Application 2020 & 2033
- Table 25: Benelux High-security Vehicle Barriers Revenue (undefined) Forecast, by Application 2020 & 2033
- Table 26: Nordics High-security Vehicle Barriers Revenue (undefined) Forecast, by Application 2020 & 2033
- Table 27: Rest of Europe High-security Vehicle Barriers Revenue (undefined) Forecast, by Application 2020 & 2033
- Table 28: Global High-security Vehicle Barriers Revenue undefined Forecast, by Application 2020 & 2033
- Table 29: Global High-security Vehicle Barriers Revenue undefined Forecast, by Types 2020 & 2033
- Table 30: Global High-security Vehicle Barriers Revenue undefined Forecast, by Country 2020 & 2033
- Table 31: Turkey High-security Vehicle Barriers Revenue (undefined) Forecast, by Application 2020 & 2033
- Table 32: Israel High-security Vehicle Barriers Revenue (undefined) Forecast, by Application 2020 & 2033
- Table 33: GCC High-security Vehicle Barriers Revenue (undefined) Forecast, by Application 2020 & 2033
- Table 34: North Africa High-security Vehicle Barriers Revenue (undefined) Forecast, by Application 2020 & 2033
- Table 35: South Africa High-security Vehicle Barriers Revenue (undefined) Forecast, by Application 2020 & 2033
- Table 36: Rest of Middle East & Africa High-security Vehicle Barriers Revenue (undefined) Forecast, by Application 2020 & 2033
- Table 37: Global High-security Vehicle Barriers Revenue undefined Forecast, by Application 2020 & 2033
- Table 38: Global High-security Vehicle Barriers Revenue undefined Forecast, by Types 2020 & 2033
- Table 39: Global High-security Vehicle Barriers Revenue undefined Forecast, by Country 2020 & 2033
- Table 40: China High-security Vehicle Barriers Revenue (undefined) Forecast, by Application 2020 & 2033
- Table 41: India High-security Vehicle Barriers Revenue (undefined) Forecast, by Application 2020 & 2033
- Table 42: Japan High-security Vehicle Barriers Revenue (undefined) Forecast, by Application 2020 & 2033
- Table 43: South Korea High-security Vehicle Barriers Revenue (undefined) Forecast, by Application 2020 & 2033
- Table 44: ASEAN High-security Vehicle Barriers Revenue (undefined) Forecast, by Application 2020 & 2033
- Table 45: Oceania High-security Vehicle Barriers Revenue (undefined) Forecast, by Application 2020 & 2033
- Table 46: Rest of Asia Pacific High-security Vehicle Barriers Revenue (undefined) Forecast, by Application 2020 & 2033
Frequently Asked Questions
1. What is the projected Compound Annual Growth Rate (CAGR) of the High-security Vehicle Barriers?
The projected CAGR is approximately 12.5%.
2. Which companies are prominent players in the High-security Vehicle Barriers?
Key companies in the market include Avon Barrier, Bollards New Zealand, Macs Automated Bollard System Ltd, Tymetal Corp, AUTOPA Limited, Jacksons Security, ATG Access, Delta Scientific, Glasdon, Neptune Automatic, Leda Security, Atlantic Anti-Ram, KAVASS Security Tech Limited.
3. What are the main segments of the High-security Vehicle Barriers?
The market segments include Application, Types.
4. Can you provide details about the market size?
The market size is estimated to be USD XXX N/A as of 2022.
5. What are some drivers contributing to market growth?
N/A
6. What are the notable trends driving market growth?
N/A
7. Are there any restraints impacting market growth?
N/A
8. Can you provide examples of recent developments in the market?
N/A
9. What pricing options are available for accessing the report?
Pricing options include single-user, multi-user, and enterprise licenses priced at USD 2900.00, USD 4350.00, and USD 5800.00 respectively.
10. Is the market size provided in terms of value or volume?
The market size is provided in terms of value, measured in N/A.
11. Are there any specific market keywords associated with the report?
Yes, the market keyword associated with the report is "High-security Vehicle Barriers," which aids in identifying and referencing the specific market segment covered.
12. How do I determine which pricing option suits my needs best?
The pricing options vary based on user requirements and access needs. Individual users may opt for single-user licenses, while businesses requiring broader access may choose multi-user or enterprise licenses for cost-effective access to the report.
13. Are there any additional resources or data provided in the High-security Vehicle Barriers report?
While the report offers comprehensive insights, it's advisable to review the specific contents or supplementary materials provided to ascertain if additional resources or data are available.
14. How can I stay updated on further developments or reports in the High-security Vehicle Barriers?
To stay informed about further developments, trends, and reports in the High-security Vehicle Barriers, consider subscribing to industry newsletters, following relevant companies and organizations, or regularly checking reputable industry news sources and publications.
Methodology
Step 1 - Identification of Relevant Samples Size from Population Database


Step 2 - Approaches for Defining Global Market Size (Value, Volume* & Price*)

Note*: In applicable scenarios
Step 3 - Data Sources
Primary Research
- Web Analytics
- Survey Reports
- Research Institute
- Latest Research Reports
- Opinion Leaders
Secondary Research
- Annual Reports
- White Paper
- Latest Press Release
- Industry Association
- Paid Database
- Investor Presentations

Step 4 - Data Triangulation
Involves using different sources of information in order to increase the validity of a study
These sources are likely to be stakeholders in a program - participants, other researchers, program staff, other community members, and so on.
Then we put all data in single framework & apply various statistical tools to find out the dynamic on the market.
During the analysis stage, feedback from the stakeholder groups would be compared to determine areas of agreement as well as areas of divergence