

Key Insights
The global light bar market is experiencing robust growth, driven by increasing demand from the automotive and off-road vehicle sectors. Technological advancements, such as the adoption of LED technology offering superior brightness, durability, and energy efficiency, are significantly impacting market expansion. This shift is pushing the adoption of light bars in various applications, including trucks, SUVs, and ATVs, for enhanced visibility and safety. Furthermore, the rising popularity of off-roading and adventure activities fuels demand for high-performance lighting solutions, contributing to market expansion. The market is segmented by light type (LED, HID, halogen), vehicle type (trucks, SUVs, ATVs), and application (automotive, off-road). Key players are strategically focusing on product innovation, partnerships, and expansions to gain a competitive edge. While increased raw material costs and stringent regulatory norms pose challenges, the overall market outlook remains positive, anticipating significant growth in the coming years.
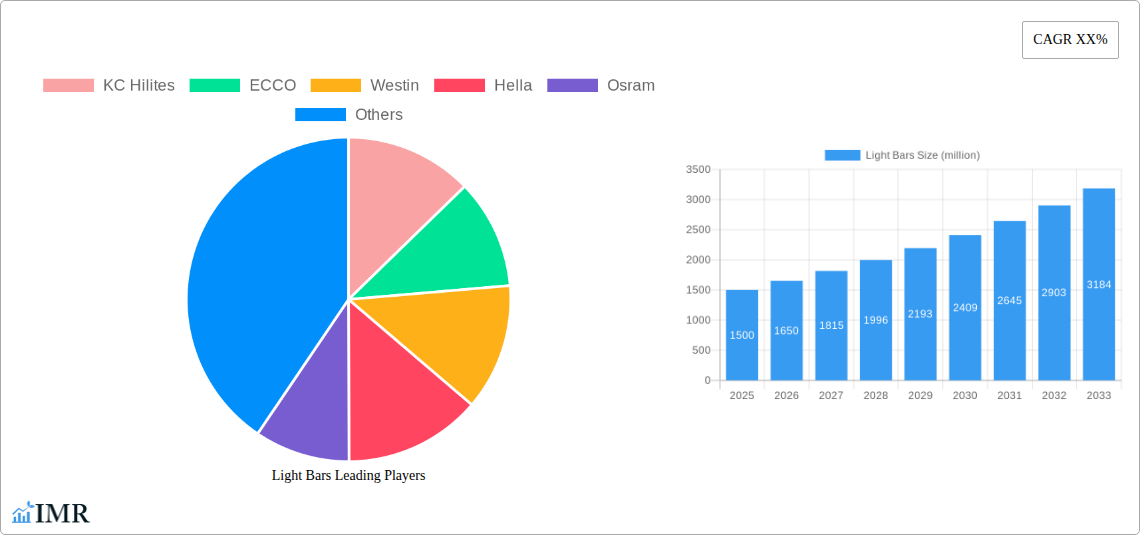
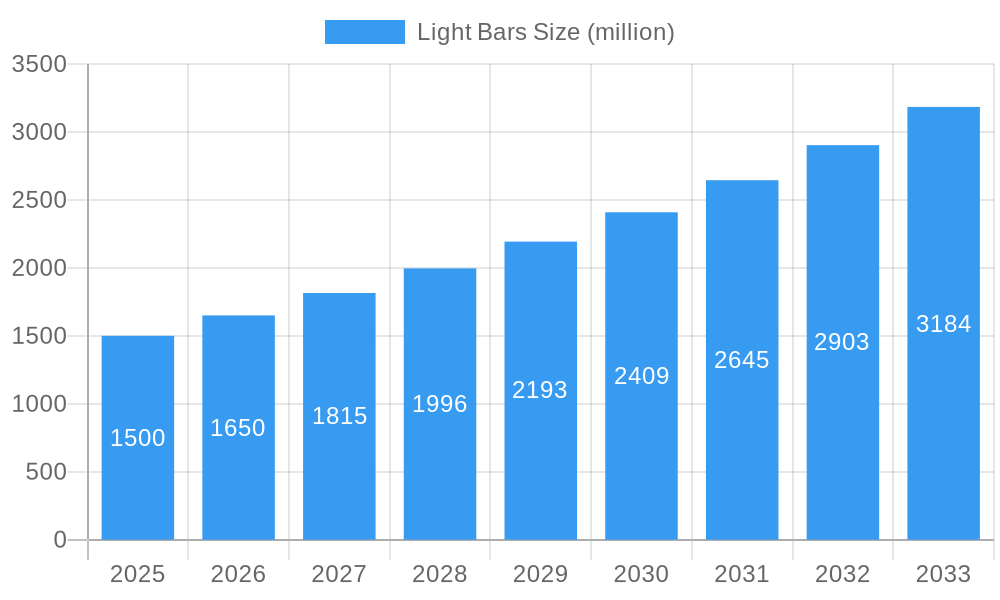
Light Bars Market Size (In Billion)
The competitive landscape is marked by a mix of established automotive lighting giants and specialized off-road lighting manufacturers. Established players leverage their extensive distribution networks and brand recognition, while specialized manufacturers excel in offering niche products with superior performance. This dynamic interplay drives innovation and choice for consumers. Future growth is projected to be particularly strong in developing economies experiencing rapid motorization and infrastructure development. The market is expected to witness increased adoption of connected lighting systems and smart features, further enhancing functionality and user experience. The consistent improvement in product design, incorporating features like advanced optics and customizable lighting patterns, continues to fuel market expansion.
Light Bars Company Market Share
Light Bars Market Report: 2019-2033
This comprehensive report provides an in-depth analysis of the global light bars market, covering the period from 2019 to 2033. It offers invaluable insights into market dynamics, growth trends, competitive landscape, and future outlook, equipping industry professionals with the knowledge needed to make informed strategic decisions. The report segments the market by various applications (parent market) such as automotive, off-road, industrial, and marine (child markets), providing detailed analysis for each segment. The market size is projected to reach xx million units by 2033.
Light Bars Market Dynamics & Structure
The global light bar market exhibits a moderately concentrated structure, with key players like KC Hilites, Rigid Industries, and Hella holding significant market share. Technological innovation, particularly in LED technology and smart lighting features, is a primary growth driver. Stringent safety regulations and environmental standards influence product design and manufacturing processes. Competitive substitutes include traditional halogen and HID lighting systems, although LED light bars are gradually replacing them due to superior energy efficiency and performance. The market's end-user demographics are diverse, spanning automotive, commercial, and industrial sectors. M&A activity has been moderate in recent years, with a total of xx deals recorded between 2019 and 2024.
- Market Concentration: Moderately concentrated, with top 5 players holding xx% market share in 2024.
- Technological Innovation: Focus on higher lumen output, improved durability, and smart features (e.g., wireless connectivity).
- Regulatory Framework: Compliance with safety and emissions standards varies across regions, impacting product design.
- Competitive Substitutes: Halogen and HID lighting systems face declining market share.
- End-User Demographics: Automotive (xx million units), Off-road (xx million units), Industrial (xx million units), Marine (xx million units) are major end-user segments in 2024.
- M&A Trends: xx M&A deals recorded between 2019 and 2024, with an average deal value of xx million USD.
Light Bars Growth Trends & Insights
The global light bar market experienced a CAGR of xx% during the historical period (2019-2024), driven by increasing demand from the automotive and off-road vehicle sectors. Adoption rates have been particularly high in regions with robust infrastructure development and rising disposable incomes. Technological disruptions, such as the transition from halogen to LED technology, have significantly improved product performance and cost-effectiveness, further boosting market growth. Shifting consumer preferences towards enhanced safety and aesthetics are also contributing factors. Market penetration is expected to reach xx% by 2033. The estimated market size for 2025 is xx million units.
- CAGR (2019-2024): xx%
- Market Size (2025): xx million units
- Market Penetration (2025): xx%
- Projected CAGR (2025-2033): xx%
Dominant Regions, Countries, or Segments in Light Bars
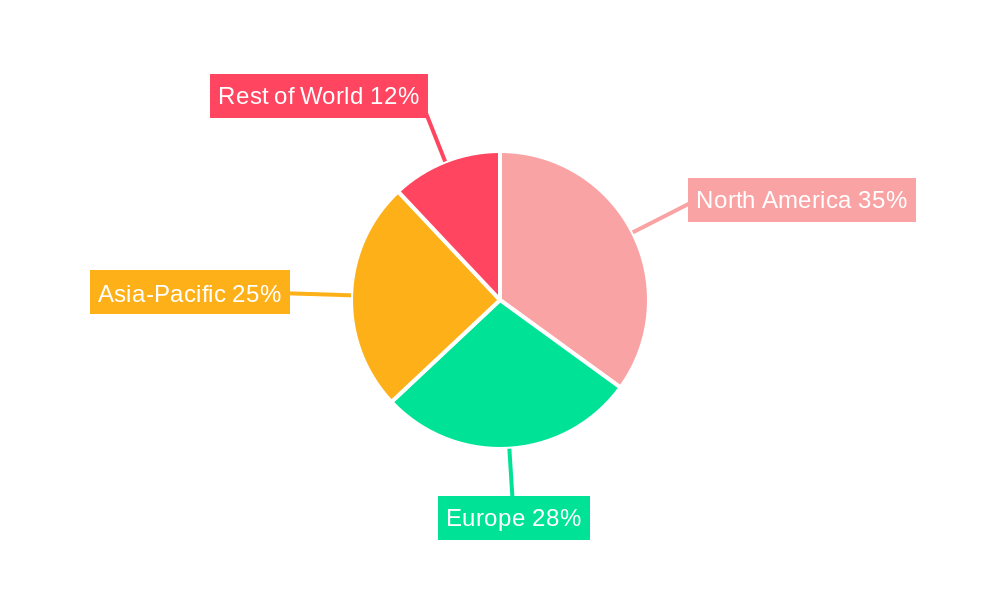
North America currently dominates the global light bar market, driven by high vehicle ownership rates, a thriving off-road vehicle culture, and robust infrastructure development. Strong consumer demand for enhanced vehicle visibility and safety features contributes significantly to the region's dominance. The US and Canada are the key growth drivers within North America. Europe and Asia-Pacific are also experiencing substantial growth, fueled by expanding infrastructure projects and increasing adoption of off-road vehicles and commercial vehicles.
- Key Drivers (North America): High vehicle ownership, strong off-roading culture, robust infrastructure, stringent safety regulations.
- Key Drivers (Europe): Growing demand from the commercial vehicle segment, stringent vehicle lighting regulations, increasing investments in infrastructure.
- Key Drivers (Asia-Pacific): Rising disposable incomes, increasing vehicle ownership, infrastructure development in emerging economies.
- Market Share (2024): North America (xx%), Europe (xx%), Asia-Pacific (xx%), Rest of World (xx%).
Light Bars Product Landscape
Light bar product innovation focuses on enhancing brightness, durability, and energy efficiency. LED technology dominates the market, offering superior performance compared to traditional halogen and HID systems. Product applications span a wide range, including automotive, off-road vehicles, emergency response vehicles, and industrial settings. Key performance metrics include lumen output, beam pattern, and operating lifespan. Unique selling propositions often include integrated features like daytime running lights (DRLs), fog lights, and advanced light control systems.
Key Drivers, Barriers & Challenges in Light Bars
Key Drivers:
- Increasing demand from the automotive and off-road vehicle sectors.
- Technological advancements in LED technology, leading to improved performance and lower costs.
- Stringent government regulations promoting enhanced vehicle safety.
Challenges and Restraints:
- Intense competition from established and emerging players, leading to price pressures.
- Supply chain disruptions impacting raw material availability and manufacturing costs.
- Stringent quality and safety standards requiring significant investment in R&D and testing.
Emerging Opportunities in Light Bars
- Growing demand for smart lighting systems with integrated features like wireless connectivity and adaptive lighting functions.
- Expansion into new markets, including developing economies with increasing vehicle ownership.
- Development of specialized light bars for niche applications, such as autonomous vehicles and drones.
Growth Accelerators in the Light Bars Industry
Technological breakthroughs in LED technology, particularly in miniaturization and power efficiency, are driving market expansion. Strategic partnerships between light bar manufacturers and automotive OEMs are facilitating product integration and market penetration. Expansion into new applications, such as marine lighting and industrial safety, is also contributing to growth.
Key Players Shaping the Light Bars Market
- KC Hilites
- ECCO
- Westin
- Hella
- Osram
- Black Oak LED
- Rigid Industries
- Autofell
- Stanley
- Philips
- Vision X Lighting
- Putco
- Truck-Lite
- Federal Signal
- PIAA
- Grote
- K-Source
- Whelen
- Whacker Technologies
- STEDI
- ZNDER (Nilight)
- Hilux
- Haztec
- Ultra Vision Lighting
- Trutec Auto Electronics Technology
Notable Milestones in Light Bars Sector
- 2020: Introduction of xx new LED light bar models by Rigid Industries and KC Hilites.
- 2021: Hella acquired xx smaller lighting company, expanding its product portfolio.
- 2022: Introduction of xx new smart lighting features by Osram.
- 2023: xx new regulations regarding light bar intensity were implemented in the EU.
- 2024: Several key players announced investments in R&D focusing on improved heat management technologies in light bars.
In-Depth Light Bars Market Outlook
The global light bar market is poised for continued robust growth throughout the forecast period (2025-2033), driven by technological advancements, expanding applications, and increasing consumer demand for enhanced safety and aesthetics. Strategic partnerships and investments in R&D will further fuel market expansion. Opportunities exist in developing smart lighting technologies, penetrating new markets, and catering to specific end-user needs. The market will continue to benefit from increasing adoption of LED technology, driving greater energy efficiency and longer product lifespans.
Light Bars Segmentation
-
1. Application
- 1.1. Events and Shows
- 1.2. Automotive
- 1.3. Restaurants and Bars
- 1.4. Charter and Boats
- 1.5. Others
-
2. Types
- 2.1. LED
- 2.2. Halogen
Light Bars Segmentation By Geography
-
1. North America
- 1.1. United States
- 1.2. Canada
- 1.3. Mexico
-
2. South America
- 2.1. Brazil
- 2.2. Argentina
- 2.3. Rest of South America
-
3. Europe
- 3.1. United Kingdom
- 3.2. Germany
- 3.3. France
- 3.4. Italy
- 3.5. Spain
- 3.6. Russia
- 3.7. Benelux
- 3.8. Nordics
- 3.9. Rest of Europe
-
4. Middle East & Africa
- 4.1. Turkey
- 4.2. Israel
- 4.3. GCC
- 4.4. North Africa
- 4.5. South Africa
- 4.6. Rest of Middle East & Africa
-
5. Asia Pacific
- 5.1. China
- 5.2. India
- 5.3. Japan
- 5.4. South Korea
- 5.5. ASEAN
- 5.6. Oceania
- 5.7. Rest of Asia Pacific
Light Bars Regional Market Share
Geographic Coverage of Light Bars
Light Bars REPORT HIGHLIGHTS
| Aspects | Details |
|---|---|
| Study Period | 2020-2034 |
| Base Year | 2025 |
| Estimated Year | 2026 |
| Forecast Period | 2026-2034 |
| Historical Period | 2020-2025 |
| Growth Rate | CAGR of 5.7% from 2020-2034 |
| Segmentation |
|
Table of Contents
- 1. Introduction
- 1.1. Research Scope
- 1.2. Market Segmentation
- 1.3. Research Objective
- 1.4. Definitions and Assumptions
- 2. Executive Summary
- 2.1. Market Snapshot
- 3. Market Dynamics
- 3.1. Market Drivers
- 3.2. Market Restrains
- 3.3. Market Trends
- 3.4. Market Opportunities
- 4. Market Factor Analysis
- 4.1. Porters Five Forces
- 4.1.1. Bargaining Power of Suppliers
- 4.1.2. Bargaining Power of Buyers
- 4.1.3. Threat of New Entrants
- 4.1.4. Threat of Substitutes
- 4.1.5. Competitive Rivalry
- 4.2. PESTEL analysis
- 4.3. BCG Analysis
- 4.3.1. Stars (High Growth, High Market Share)
- 4.3.2. Cash Cows (Low Growth, High Market Share)
- 4.3.3. Question Mark (High Growth, Low Market Share)
- 4.3.4. Dogs (Low Growth, Low Market Share)
- 4.4. Ansoff Matrix Analysis
- 4.5. Supply Chain Analysis
- 4.6. Regulatory Landscape
- 4.7. Current Market Potential and Opportunity Assessment (TAM–SAM–SOM Framework)
- 4.8. IMR Analyst Note
- 4.1. Porters Five Forces
- 5. Market Analysis, Insights and Forecast 2021-2033
- 5.1. Market Analysis, Insights and Forecast - by Application
- 5.1.1. Events and Shows
- 5.1.2. Automotive
- 5.1.3. Restaurants and Bars
- 5.1.4. Charter and Boats
- 5.1.5. Others
- 5.2. Market Analysis, Insights and Forecast - by Types
- 5.2.1. LED
- 5.2.2. Halogen
- 5.3. Market Analysis, Insights and Forecast - by Region
- 5.3.1. North America
- 5.3.2. South America
- 5.3.3. Europe
- 5.3.4. Middle East & Africa
- 5.3.5. Asia Pacific
- 5.1. Market Analysis, Insights and Forecast - by Application
- 6. Global Light Bars Analysis, Insights and Forecast, 2021-2033
- 6.1. Market Analysis, Insights and Forecast - by Application
- 6.1.1. Events and Shows
- 6.1.2. Automotive
- 6.1.3. Restaurants and Bars
- 6.1.4. Charter and Boats
- 6.1.5. Others
- 6.2. Market Analysis, Insights and Forecast - by Types
- 6.2.1. LED
- 6.2.2. Halogen
- 6.1. Market Analysis, Insights and Forecast - by Application
- 7. North America Light Bars Analysis, Insights and Forecast, 2020-2032
- 7.1. Market Analysis, Insights and Forecast - by Application
- 7.1.1. Events and Shows
- 7.1.2. Automotive
- 7.1.3. Restaurants and Bars
- 7.1.4. Charter and Boats
- 7.1.5. Others
- 7.2. Market Analysis, Insights and Forecast - by Types
- 7.2.1. LED
- 7.2.2. Halogen
- 7.1. Market Analysis, Insights and Forecast - by Application
- 8. South America Light Bars Analysis, Insights and Forecast, 2020-2032
- 8.1. Market Analysis, Insights and Forecast - by Application
- 8.1.1. Events and Shows
- 8.1.2. Automotive
- 8.1.3. Restaurants and Bars
- 8.1.4. Charter and Boats
- 8.1.5. Others
- 8.2. Market Analysis, Insights and Forecast - by Types
- 8.2.1. LED
- 8.2.2. Halogen
- 8.1. Market Analysis, Insights and Forecast - by Application
- 9. Europe Light Bars Analysis, Insights and Forecast, 2020-2032
- 9.1. Market Analysis, Insights and Forecast - by Application
- 9.1.1. Events and Shows
- 9.1.2. Automotive
- 9.1.3. Restaurants and Bars
- 9.1.4. Charter and Boats
- 9.1.5. Others
- 9.2. Market Analysis, Insights and Forecast - by Types
- 9.2.1. LED
- 9.2.2. Halogen
- 9.1. Market Analysis, Insights and Forecast - by Application
- 10. Middle East & Africa Light Bars Analysis, Insights and Forecast, 2020-2032
- 10.1. Market Analysis, Insights and Forecast - by Application
- 10.1.1. Events and Shows
- 10.1.2. Automotive
- 10.1.3. Restaurants and Bars
- 10.1.4. Charter and Boats
- 10.1.5. Others
- 10.2. Market Analysis, Insights and Forecast - by Types
- 10.2.1. LED
- 10.2.2. Halogen
- 10.1. Market Analysis, Insights and Forecast - by Application
- 11. Asia Pacific Light Bars Analysis, Insights and Forecast, 2020-2032
- 11.1. Market Analysis, Insights and Forecast - by Application
- 11.1.1. Events and Shows
- 11.1.2. Automotive
- 11.1.3. Restaurants and Bars
- 11.1.4. Charter and Boats
- 11.1.5. Others
- 11.2. Market Analysis, Insights and Forecast - by Types
- 11.2.1. LED
- 11.2.2. Halogen
- 11.1. Market Analysis, Insights and Forecast - by Application
- 12. Competitive Analysis
- 12.1. Company Profiles
- 12.1.1 KC Hilites
- 12.1.1.1. Company Overview
- 12.1.1.2. Products
- 12.1.1.3. Company Financials
- 12.1.1.4. SWOT Analysis
- 12.1.2 ECCO
- 12.1.2.1. Company Overview
- 12.1.2.2. Products
- 12.1.2.3. Company Financials
- 12.1.2.4. SWOT Analysis
- 12.1.3 Westin
- 12.1.3.1. Company Overview
- 12.1.3.2. Products
- 12.1.3.3. Company Financials
- 12.1.3.4. SWOT Analysis
- 12.1.4 Hella
- 12.1.4.1. Company Overview
- 12.1.4.2. Products
- 12.1.4.3. Company Financials
- 12.1.4.4. SWOT Analysis
- 12.1.5 Osram
- 12.1.5.1. Company Overview
- 12.1.5.2. Products
- 12.1.5.3. Company Financials
- 12.1.5.4. SWOT Analysis
- 12.1.6 Black Oak LED
- 12.1.6.1. Company Overview
- 12.1.6.2. Products
- 12.1.6.3. Company Financials
- 12.1.6.4. SWOT Analysis
- 12.1.7 Rigid Industries
- 12.1.7.1. Company Overview
- 12.1.7.2. Products
- 12.1.7.3. Company Financials
- 12.1.7.4. SWOT Analysis
- 12.1.8 Autofell
- 12.1.8.1. Company Overview
- 12.1.8.2. Products
- 12.1.8.3. Company Financials
- 12.1.8.4. SWOT Analysis
- 12.1.9 Stanley
- 12.1.9.1. Company Overview
- 12.1.9.2. Products
- 12.1.9.3. Company Financials
- 12.1.9.4. SWOT Analysis
- 12.1.10 Philips
- 12.1.10.1. Company Overview
- 12.1.10.2. Products
- 12.1.10.3. Company Financials
- 12.1.10.4. SWOT Analysis
- 12.1.11 Vision X Lighting
- 12.1.11.1. Company Overview
- 12.1.11.2. Products
- 12.1.11.3. Company Financials
- 12.1.11.4. SWOT Analysis
- 12.1.12 Putco
- 12.1.12.1. Company Overview
- 12.1.12.2. Products
- 12.1.12.3. Company Financials
- 12.1.12.4. SWOT Analysis
- 12.1.13 Truck-Lite
- 12.1.13.1. Company Overview
- 12.1.13.2. Products
- 12.1.13.3. Company Financials
- 12.1.13.4. SWOT Analysis
- 12.1.14 Federal Signal
- 12.1.14.1. Company Overview
- 12.1.14.2. Products
- 12.1.14.3. Company Financials
- 12.1.14.4. SWOT Analysis
- 12.1.15 PIAA
- 12.1.15.1. Company Overview
- 12.1.15.2. Products
- 12.1.15.3. Company Financials
- 12.1.15.4. SWOT Analysis
- 12.1.16 Grote
- 12.1.16.1. Company Overview
- 12.1.16.2. Products
- 12.1.16.3. Company Financials
- 12.1.16.4. SWOT Analysis
- 12.1.17 K-Source
- 12.1.17.1. Company Overview
- 12.1.17.2. Products
- 12.1.17.3. Company Financials
- 12.1.17.4. SWOT Analysis
- 12.1.18 Whelen
- 12.1.18.1. Company Overview
- 12.1.18.2. Products
- 12.1.18.3. Company Financials
- 12.1.18.4. SWOT Analysis
- 12.1.19 Whacker Technologies
- 12.1.19.1. Company Overview
- 12.1.19.2. Products
- 12.1.19.3. Company Financials
- 12.1.19.4. SWOT Analysis
- 12.1.20 STEDI
- 12.1.20.1. Company Overview
- 12.1.20.2. Products
- 12.1.20.3. Company Financials
- 12.1.20.4. SWOT Analysis
- 12.1.21 ZNDER (Nilight)
- 12.1.21.1. Company Overview
- 12.1.21.2. Products
- 12.1.21.3. Company Financials
- 12.1.21.4. SWOT Analysis
- 12.1.22 Hilux
- 12.1.22.1. Company Overview
- 12.1.22.2. Products
- 12.1.22.3. Company Financials
- 12.1.22.4. SWOT Analysis
- 12.1.23 Haztec
- 12.1.23.1. Company Overview
- 12.1.23.2. Products
- 12.1.23.3. Company Financials
- 12.1.23.4. SWOT Analysis
- 12.1.24 Ultra Vision Lighting
- 12.1.24.1. Company Overview
- 12.1.24.2. Products
- 12.1.24.3. Company Financials
- 12.1.24.4. SWOT Analysis
- 12.1.25 Trutec Auto Electronics Technology
- 12.1.25.1. Company Overview
- 12.1.25.2. Products
- 12.1.25.3. Company Financials
- 12.1.25.4. SWOT Analysis
- 12.1.1 KC Hilites
- 12.2. Market Entropy
- 12.2.1 Company's Key Areas Served
- 12.2.2 Recent Developments
- 12.3. Company Market Share Analysis 2025
- 12.3.1 Top 5 Companies Market Share Analysis
- 12.3.2 Top 3 Companies Market Share Analysis
- 12.4. List of Potential Customers
- 13. Research Methodology
List of Figures
- Figure 1: Global Light Bars Revenue Breakdown (undefined, %) by Region 2025 & 2033
- Figure 2: Global Light Bars Volume Breakdown (K, %) by Region 2025 & 2033
- Figure 3: North America Light Bars Revenue (undefined), by Application 2025 & 2033
- Figure 4: North America Light Bars Volume (K), by Application 2025 & 2033
- Figure 5: North America Light Bars Revenue Share (%), by Application 2025 & 2033
- Figure 6: North America Light Bars Volume Share (%), by Application 2025 & 2033
- Figure 7: North America Light Bars Revenue (undefined), by Types 2025 & 2033
- Figure 8: North America Light Bars Volume (K), by Types 2025 & 2033
- Figure 9: North America Light Bars Revenue Share (%), by Types 2025 & 2033
- Figure 10: North America Light Bars Volume Share (%), by Types 2025 & 2033
- Figure 11: North America Light Bars Revenue (undefined), by Country 2025 & 2033
- Figure 12: North America Light Bars Volume (K), by Country 2025 & 2033
- Figure 13: North America Light Bars Revenue Share (%), by Country 2025 & 2033
- Figure 14: North America Light Bars Volume Share (%), by Country 2025 & 2033
- Figure 15: South America Light Bars Revenue (undefined), by Application 2025 & 2033
- Figure 16: South America Light Bars Volume (K), by Application 2025 & 2033
- Figure 17: South America Light Bars Revenue Share (%), by Application 2025 & 2033
- Figure 18: South America Light Bars Volume Share (%), by Application 2025 & 2033
- Figure 19: South America Light Bars Revenue (undefined), by Types 2025 & 2033
- Figure 20: South America Light Bars Volume (K), by Types 2025 & 2033
- Figure 21: South America Light Bars Revenue Share (%), by Types 2025 & 2033
- Figure 22: South America Light Bars Volume Share (%), by Types 2025 & 2033
- Figure 23: South America Light Bars Revenue (undefined), by Country 2025 & 2033
- Figure 24: South America Light Bars Volume (K), by Country 2025 & 2033
- Figure 25: South America Light Bars Revenue Share (%), by Country 2025 & 2033
- Figure 26: South America Light Bars Volume Share (%), by Country 2025 & 2033
- Figure 27: Europe Light Bars Revenue (undefined), by Application 2025 & 2033
- Figure 28: Europe Light Bars Volume (K), by Application 2025 & 2033
- Figure 29: Europe Light Bars Revenue Share (%), by Application 2025 & 2033
- Figure 30: Europe Light Bars Volume Share (%), by Application 2025 & 2033
- Figure 31: Europe Light Bars Revenue (undefined), by Types 2025 & 2033
- Figure 32: Europe Light Bars Volume (K), by Types 2025 & 2033
- Figure 33: Europe Light Bars Revenue Share (%), by Types 2025 & 2033
- Figure 34: Europe Light Bars Volume Share (%), by Types 2025 & 2033
- Figure 35: Europe Light Bars Revenue (undefined), by Country 2025 & 2033
- Figure 36: Europe Light Bars Volume (K), by Country 2025 & 2033
- Figure 37: Europe Light Bars Revenue Share (%), by Country 2025 & 2033
- Figure 38: Europe Light Bars Volume Share (%), by Country 2025 & 2033
- Figure 39: Middle East & Africa Light Bars Revenue (undefined), by Application 2025 & 2033
- Figure 40: Middle East & Africa Light Bars Volume (K), by Application 2025 & 2033
- Figure 41: Middle East & Africa Light Bars Revenue Share (%), by Application 2025 & 2033
- Figure 42: Middle East & Africa Light Bars Volume Share (%), by Application 2025 & 2033
- Figure 43: Middle East & Africa Light Bars Revenue (undefined), by Types 2025 & 2033
- Figure 44: Middle East & Africa Light Bars Volume (K), by Types 2025 & 2033
- Figure 45: Middle East & Africa Light Bars Revenue Share (%), by Types 2025 & 2033
- Figure 46: Middle East & Africa Light Bars Volume Share (%), by Types 2025 & 2033
- Figure 47: Middle East & Africa Light Bars Revenue (undefined), by Country 2025 & 2033
- Figure 48: Middle East & Africa Light Bars Volume (K), by Country 2025 & 2033
- Figure 49: Middle East & Africa Light Bars Revenue Share (%), by Country 2025 & 2033
- Figure 50: Middle East & Africa Light Bars Volume Share (%), by Country 2025 & 2033
- Figure 51: Asia Pacific Light Bars Revenue (undefined), by Application 2025 & 2033
- Figure 52: Asia Pacific Light Bars Volume (K), by Application 2025 & 2033
- Figure 53: Asia Pacific Light Bars Revenue Share (%), by Application 2025 & 2033
- Figure 54: Asia Pacific Light Bars Volume Share (%), by Application 2025 & 2033
- Figure 55: Asia Pacific Light Bars Revenue (undefined), by Types 2025 & 2033
- Figure 56: Asia Pacific Light Bars Volume (K), by Types 2025 & 2033
- Figure 57: Asia Pacific Light Bars Revenue Share (%), by Types 2025 & 2033
- Figure 58: Asia Pacific Light Bars Volume Share (%), by Types 2025 & 2033
- Figure 59: Asia Pacific Light Bars Revenue (undefined), by Country 2025 & 2033
- Figure 60: Asia Pacific Light Bars Volume (K), by Country 2025 & 2033
- Figure 61: Asia Pacific Light Bars Revenue Share (%), by Country 2025 & 2033
- Figure 62: Asia Pacific Light Bars Volume Share (%), by Country 2025 & 2033
List of Tables
- Table 1: Global Light Bars Revenue undefined Forecast, by Application 2020 & 2033
- Table 2: Global Light Bars Volume K Forecast, by Application 2020 & 2033
- Table 3: Global Light Bars Revenue undefined Forecast, by Types 2020 & 2033
- Table 4: Global Light Bars Volume K Forecast, by Types 2020 & 2033
- Table 5: Global Light Bars Revenue undefined Forecast, by Region 2020 & 2033
- Table 6: Global Light Bars Volume K Forecast, by Region 2020 & 2033
- Table 7: Global Light Bars Revenue undefined Forecast, by Application 2020 & 2033
- Table 8: Global Light Bars Volume K Forecast, by Application 2020 & 2033
- Table 9: Global Light Bars Revenue undefined Forecast, by Types 2020 & 2033
- Table 10: Global Light Bars Volume K Forecast, by Types 2020 & 2033
- Table 11: Global Light Bars Revenue undefined Forecast, by Country 2020 & 2033
- Table 12: Global Light Bars Volume K Forecast, by Country 2020 & 2033
- Table 13: United States Light Bars Revenue (undefined) Forecast, by Application 2020 & 2033
- Table 14: United States Light Bars Volume (K) Forecast, by Application 2020 & 2033
- Table 15: Canada Light Bars Revenue (undefined) Forecast, by Application 2020 & 2033
- Table 16: Canada Light Bars Volume (K) Forecast, by Application 2020 & 2033
- Table 17: Mexico Light Bars Revenue (undefined) Forecast, by Application 2020 & 2033
- Table 18: Mexico Light Bars Volume (K) Forecast, by Application 2020 & 2033
- Table 19: Global Light Bars Revenue undefined Forecast, by Application 2020 & 2033
- Table 20: Global Light Bars Volume K Forecast, by Application 2020 & 2033
- Table 21: Global Light Bars Revenue undefined Forecast, by Types 2020 & 2033
- Table 22: Global Light Bars Volume K Forecast, by Types 2020 & 2033
- Table 23: Global Light Bars Revenue undefined Forecast, by Country 2020 & 2033
- Table 24: Global Light Bars Volume K Forecast, by Country 2020 & 2033
- Table 25: Brazil Light Bars Revenue (undefined) Forecast, by Application 2020 & 2033
- Table 26: Brazil Light Bars Volume (K) Forecast, by Application 2020 & 2033
- Table 27: Argentina Light Bars Revenue (undefined) Forecast, by Application 2020 & 2033
- Table 28: Argentina Light Bars Volume (K) Forecast, by Application 2020 & 2033
- Table 29: Rest of South America Light Bars Revenue (undefined) Forecast, by Application 2020 & 2033
- Table 30: Rest of South America Light Bars Volume (K) Forecast, by Application 2020 & 2033
- Table 31: Global Light Bars Revenue undefined Forecast, by Application 2020 & 2033
- Table 32: Global Light Bars Volume K Forecast, by Application 2020 & 2033
- Table 33: Global Light Bars Revenue undefined Forecast, by Types 2020 & 2033
- Table 34: Global Light Bars Volume K Forecast, by Types 2020 & 2033
- Table 35: Global Light Bars Revenue undefined Forecast, by Country 2020 & 2033
- Table 36: Global Light Bars Volume K Forecast, by Country 2020 & 2033
- Table 37: United Kingdom Light Bars Revenue (undefined) Forecast, by Application 2020 & 2033
- Table 38: United Kingdom Light Bars Volume (K) Forecast, by Application 2020 & 2033
- Table 39: Germany Light Bars Revenue (undefined) Forecast, by Application 2020 & 2033
- Table 40: Germany Light Bars Volume (K) Forecast, by Application 2020 & 2033
- Table 41: France Light Bars Revenue (undefined) Forecast, by Application 2020 & 2033
- Table 42: France Light Bars Volume (K) Forecast, by Application 2020 & 2033
- Table 43: Italy Light Bars Revenue (undefined) Forecast, by Application 2020 & 2033
- Table 44: Italy Light Bars Volume (K) Forecast, by Application 2020 & 2033
- Table 45: Spain Light Bars Revenue (undefined) Forecast, by Application 2020 & 2033
- Table 46: Spain Light Bars Volume (K) Forecast, by Application 2020 & 2033
- Table 47: Russia Light Bars Revenue (undefined) Forecast, by Application 2020 & 2033
- Table 48: Russia Light Bars Volume (K) Forecast, by Application 2020 & 2033
- Table 49: Benelux Light Bars Revenue (undefined) Forecast, by Application 2020 & 2033
- Table 50: Benelux Light Bars Volume (K) Forecast, by Application 2020 & 2033
- Table 51: Nordics Light Bars Revenue (undefined) Forecast, by Application 2020 & 2033
- Table 52: Nordics Light Bars Volume (K) Forecast, by Application 2020 & 2033
- Table 53: Rest of Europe Light Bars Revenue (undefined) Forecast, by Application 2020 & 2033
- Table 54: Rest of Europe Light Bars Volume (K) Forecast, by Application 2020 & 2033
- Table 55: Global Light Bars Revenue undefined Forecast, by Application 2020 & 2033
- Table 56: Global Light Bars Volume K Forecast, by Application 2020 & 2033
- Table 57: Global Light Bars Revenue undefined Forecast, by Types 2020 & 2033
- Table 58: Global Light Bars Volume K Forecast, by Types 2020 & 2033
- Table 59: Global Light Bars Revenue undefined Forecast, by Country 2020 & 2033
- Table 60: Global Light Bars Volume K Forecast, by Country 2020 & 2033
- Table 61: Turkey Light Bars Revenue (undefined) Forecast, by Application 2020 & 2033
- Table 62: Turkey Light Bars Volume (K) Forecast, by Application 2020 & 2033
- Table 63: Israel Light Bars Revenue (undefined) Forecast, by Application 2020 & 2033
- Table 64: Israel Light Bars Volume (K) Forecast, by Application 2020 & 2033
- Table 65: GCC Light Bars Revenue (undefined) Forecast, by Application 2020 & 2033
- Table 66: GCC Light Bars Volume (K) Forecast, by Application 2020 & 2033
- Table 67: North Africa Light Bars Revenue (undefined) Forecast, by Application 2020 & 2033
- Table 68: North Africa Light Bars Volume (K) Forecast, by Application 2020 & 2033
- Table 69: South Africa Light Bars Revenue (undefined) Forecast, by Application 2020 & 2033
- Table 70: South Africa Light Bars Volume (K) Forecast, by Application 2020 & 2033
- Table 71: Rest of Middle East & Africa Light Bars Revenue (undefined) Forecast, by Application 2020 & 2033
- Table 72: Rest of Middle East & Africa Light Bars Volume (K) Forecast, by Application 2020 & 2033
- Table 73: Global Light Bars Revenue undefined Forecast, by Application 2020 & 2033
- Table 74: Global Light Bars Volume K Forecast, by Application 2020 & 2033
- Table 75: Global Light Bars Revenue undefined Forecast, by Types 2020 & 2033
- Table 76: Global Light Bars Volume K Forecast, by Types 2020 & 2033
- Table 77: Global Light Bars Revenue undefined Forecast, by Country 2020 & 2033
- Table 78: Global Light Bars Volume K Forecast, by Country 2020 & 2033
- Table 79: China Light Bars Revenue (undefined) Forecast, by Application 2020 & 2033
- Table 80: China Light Bars Volume (K) Forecast, by Application 2020 & 2033
- Table 81: India Light Bars Revenue (undefined) Forecast, by Application 2020 & 2033
- Table 82: India Light Bars Volume (K) Forecast, by Application 2020 & 2033
- Table 83: Japan Light Bars Revenue (undefined) Forecast, by Application 2020 & 2033
- Table 84: Japan Light Bars Volume (K) Forecast, by Application 2020 & 2033
- Table 85: South Korea Light Bars Revenue (undefined) Forecast, by Application 2020 & 2033
- Table 86: South Korea Light Bars Volume (K) Forecast, by Application 2020 & 2033
- Table 87: ASEAN Light Bars Revenue (undefined) Forecast, by Application 2020 & 2033
- Table 88: ASEAN Light Bars Volume (K) Forecast, by Application 2020 & 2033
- Table 89: Oceania Light Bars Revenue (undefined) Forecast, by Application 2020 & 2033
- Table 90: Oceania Light Bars Volume (K) Forecast, by Application 2020 & 2033
- Table 91: Rest of Asia Pacific Light Bars Revenue (undefined) Forecast, by Application 2020 & 2033
- Table 92: Rest of Asia Pacific Light Bars Volume (K) Forecast, by Application 2020 & 2033
Frequently Asked Questions
1. What is the projected Compound Annual Growth Rate (CAGR) of the Light Bars?
The projected CAGR is approximately 5.7%.
2. Which companies are prominent players in the Light Bars?
Key companies in the market include KC Hilites, ECCO, Westin, Hella, Osram, Black Oak LED, Rigid Industries, Autofell, Stanley, Philips, Vision X Lighting, Putco, Truck-Lite, Federal Signal, PIAA, Grote, K-Source, Whelen, Whacker Technologies, STEDI, ZNDER (Nilight), Hilux, Haztec, Ultra Vision Lighting, Trutec Auto Electronics Technology.
3. What are the main segments of the Light Bars?
The market segments include Application, Types.
4. Can you provide details about the market size?
The market size is estimated to be USD XXX N/A as of 2022.
5. What are some drivers contributing to market growth?
N/A
6. What are the notable trends driving market growth?
N/A
7. Are there any restraints impacting market growth?
N/A
8. Can you provide examples of recent developments in the market?
N/A
9. What pricing options are available for accessing the report?
Pricing options include single-user, multi-user, and enterprise licenses priced at USD 3350.00, USD 5025.00, and USD 6700.00 respectively.
10. Is the market size provided in terms of value or volume?
The market size is provided in terms of value, measured in N/A and volume, measured in K.
11. Are there any specific market keywords associated with the report?
Yes, the market keyword associated with the report is "Light Bars," which aids in identifying and referencing the specific market segment covered.
12. How do I determine which pricing option suits my needs best?
The pricing options vary based on user requirements and access needs. Individual users may opt for single-user licenses, while businesses requiring broader access may choose multi-user or enterprise licenses for cost-effective access to the report.
13. Are there any additional resources or data provided in the Light Bars report?
While the report offers comprehensive insights, it's advisable to review the specific contents or supplementary materials provided to ascertain if additional resources or data are available.
14. How can I stay updated on further developments or reports in the Light Bars?
To stay informed about further developments, trends, and reports in the Light Bars, consider subscribing to industry newsletters, following relevant companies and organizations, or regularly checking reputable industry news sources and publications.
Methodology
Step 1 - Identification of Relevant Samples Size from Population Database


Step 2 - Approaches for Defining Global Market Size (Value, Volume* & Price*)

Note*: In applicable scenarios
Step 3 - Data Sources
Primary Research
- Web Analytics
- Survey Reports
- Research Institute
- Latest Research Reports
- Opinion Leaders
Secondary Research
- Annual Reports
- White Paper
- Latest Press Release
- Industry Association
- Paid Database
- Investor Presentations

Step 4 - Data Triangulation
Involves using different sources of information in order to increase the validity of a study
These sources are likely to be stakeholders in a program - participants, other researchers, program staff, other community members, and so on.
Then we put all data in single framework & apply various statistical tools to find out the dynamic on the market.
During the analysis stage, feedback from the stakeholder groups would be compared to determine areas of agreement as well as areas of divergence