

Key Insights
The Light Business Jet (LBJ) market, defined by aircraft with fewer than 10 seats, is poised for substantial expansion. Driven by escalating demand from high-net-worth individuals and corporations prioritizing efficient and flexible private air travel, the market is projected to grow from $15.5 billion in the base year of 2025, achieving a Compound Annual Growth Rate (CAGR) of 1.21% through 2033. Key growth catalysts include global economic recovery, a growing preference for private aviation to circumvent commercial air travel inefficiencies, and ongoing technological innovations enhancing fuel efficiency, performance, and cabin amenities. The introduction of advanced, safer LBJ models is further broadening buyer appeal. Leading manufacturers such as Bombardier, Embraer, and Textron Aviation are making significant R&D investments to secure their market positions.
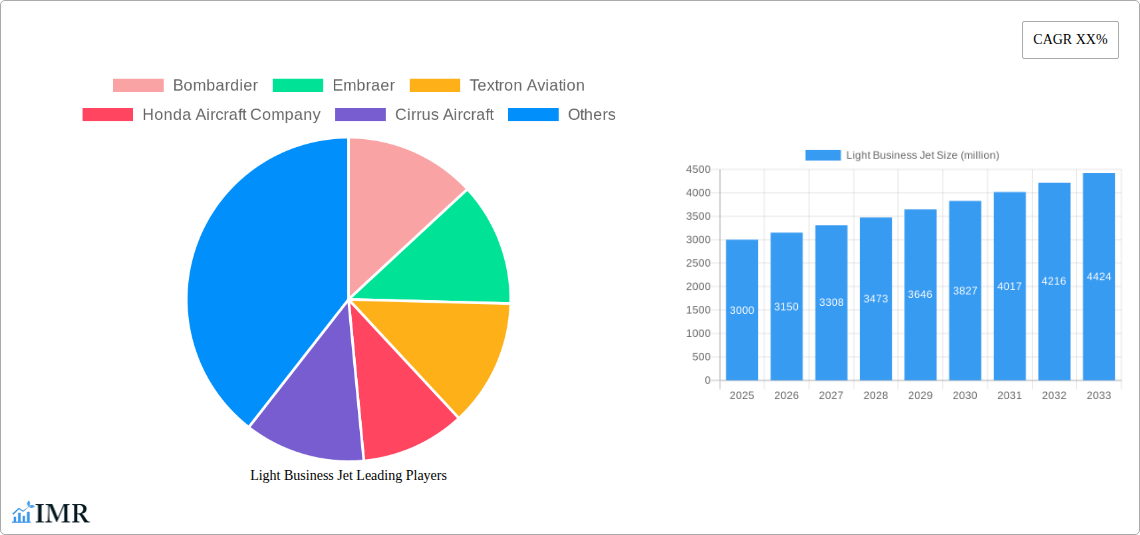
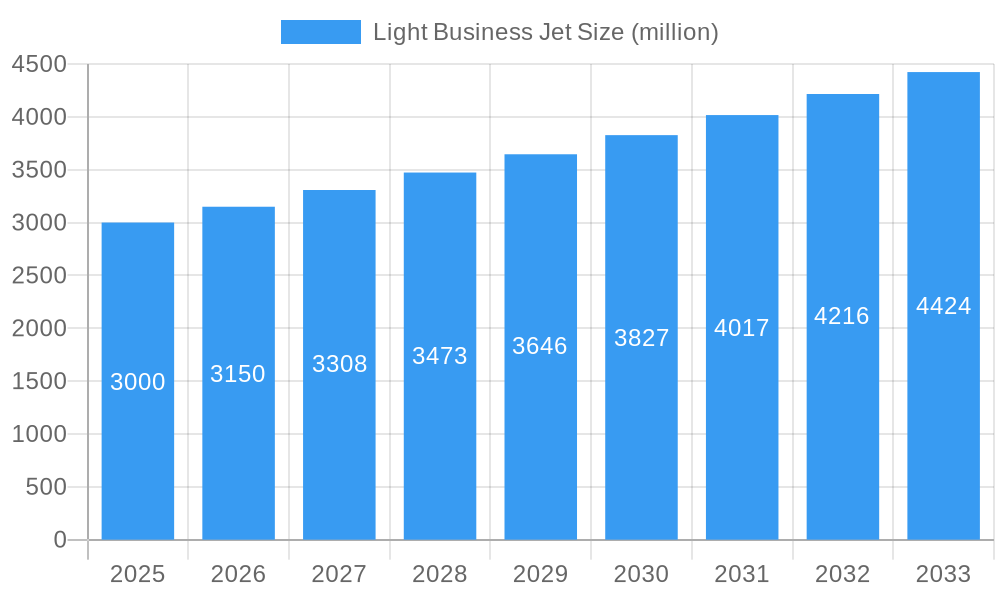
Light Business Jet Market Size (In Billion)
Despite positive growth trajectories, the LBJ market faces potential headwinds from economic volatility, fluctuating fuel costs, and rising operational and maintenance expenses. Stringent aviation regulations regarding certification and emissions also shape industry strategies. Nevertheless, diverse market segmentation, offering aircraft across various price points and configurations, presents numerous growth avenues. North America and Europe are expected to remain dominant markets, with Asia-Pacific emerging as a significant growth region. The coming decade will likely witness a pronounced shift towards sustainable aviation technologies, influencing manufacturing practices and consumer preferences within the LBJ sector.
Light Business Jet Company Market Share
Light Business Jet Market Report: 2019-2033
This comprehensive report provides an in-depth analysis of the Light Business Jet (LBJ) market, encompassing market dynamics, growth trends, regional performance, competitive landscape, and future outlook. The study period covers 2019-2033, with a base year of 2025 and a forecast period of 2025-2033. The report caters to industry professionals, investors, and strategic decision-makers seeking a granular understanding of this dynamic sector. Key players like Bombardier, Embraer, Textron Aviation, Honda Aircraft Company, Cirrus Aircraft, and Pilatus Aircraft are extensively analyzed. The report also delves into the parent market of Business Aviation and the child market of Light Jets.
Light Business Jet Market Dynamics & Structure
The Light Business Jet market is characterized by moderate concentration, with a few key players dominating the landscape. Market share distribution among these leading companies in 2025 is estimated as follows: Bombardier (xx%), Embraer (xx%), Textron Aviation (xx%), Honda Aircraft Company (xx%), Cirrus Aircraft (xx%), and Pilatus Aircraft (xx%). Technological innovation, driven by advancements in materials, aerodynamics, and avionics, plays a crucial role. Stringent regulatory frameworks, particularly concerning safety and emissions, significantly influence market dynamics. The competitive landscape includes substitutes like larger business jets or commercial flights, impacting market penetration. End-user demographics, primarily comprising high-net-worth individuals and corporations, shape demand. M&A activity has been relatively moderate in recent years, with xx major deals recorded between 2019 and 2024.
- Market Concentration: Moderately concentrated, with key players holding significant market share.
- Technological Innovation: Focus on fuel efficiency, advanced avionics, and enhanced safety features.
- Regulatory Framework: Stringent safety and emission regulations impacting operational costs.
- Competitive Substitutes: Larger business jets and commercial airlines present alternative options.
- End-User Demographics: High-net-worth individuals and corporations drive demand.
- M&A Trends: Moderate M&A activity, with xx deals recorded during the historical period (2019-2024).
Light Business Jet Growth Trends & Insights
The LBJ market exhibited a CAGR of xx% during the historical period (2019-2024), driven by factors including increasing disposable income among high-net-worth individuals, growing demand for faster and more convenient travel, and technological advancements improving efficiency and comfort. The market size reached xx million units in 2024, and is projected to reach xx million units by 2033, with a projected CAGR of xx% during the forecast period (2025-2033). Technological disruptions, such as the integration of advanced avionics and sustainable aviation fuels, are significantly impacting market growth. Shifting consumer behavior, favoring enhanced connectivity and personalized travel experiences, further fuels market expansion. Market penetration continues to grow in emerging economies, driven by improving infrastructure and rising business activities.
Dominant Regions, Countries, or Segments in Light Business Jet
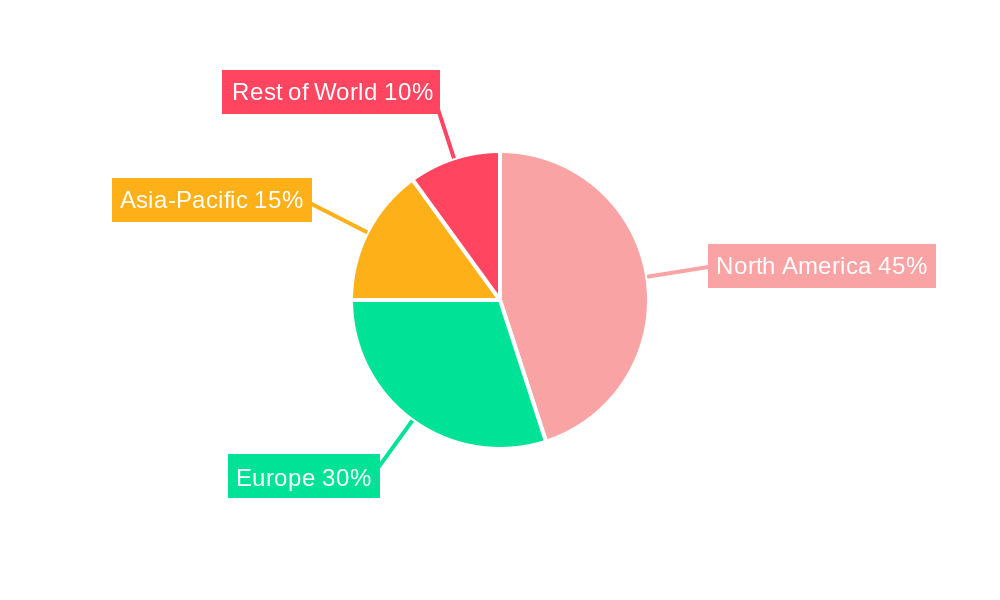
North America remains the dominant region for Light Business Jets, capturing xx% of the global market share in 2025. This dominance is attributed to strong economic growth, well-established infrastructure supporting business aviation, and a high concentration of high-net-worth individuals and corporations. Europe follows as a significant market, holding xx% of the market share. Asia-Pacific shows strong growth potential, driven by rapid economic expansion in several key countries.
- Key Drivers in North America: Strong economy, well-developed infrastructure, high concentration of HNWIs.
- Key Drivers in Europe: Established business aviation infrastructure, robust economic activity.
- Key Drivers in Asia-Pacific: Rapid economic growth, rising disposable incomes, increasing business travel.
- Market Share: North America (xx%), Europe (xx%), Asia-Pacific (xx%), Rest of the World (xx%).
Light Business Jet Product Landscape
Recent product innovations in the LBJ sector focus on improved fuel efficiency, enhanced safety features, and advanced avionics. The integration of fly-by-wire systems, advanced flight management systems, and sophisticated communication technologies is becoming increasingly common. These innovations are aimed at enhancing safety, reducing operational costs, and improving the overall passenger experience. Unique selling propositions often include superior cabin comfort, enhanced performance capabilities, and advanced connectivity solutions.
Key Drivers, Barriers & Challenges in Light Business Jet
Key Drivers:
- Rising disposable incomes among high-net-worth individuals.
- Increasing business travel demand.
- Technological advancements improving efficiency and comfort.
- Government initiatives supporting business aviation.
Key Challenges:
- High initial investment costs.
- Stringent regulatory compliance.
- Fluctuations in fuel prices.
- Supply chain disruptions impacting production and delivery times.
Emerging Opportunities in Light Business Jet
Emerging opportunities include expansion into untapped markets in developing economies, the development of more sustainable and environmentally friendly aircraft, and the integration of advanced connectivity and in-flight entertainment options to enhance the passenger experience. The rising demand for fractional ownership programs and charter services also presents significant opportunities for growth.
Growth Accelerators in the Light Business Jet Industry
Technological breakthroughs in materials science, engine technology, and avionics continue to drive market growth. Strategic partnerships between manufacturers and service providers are also enhancing efficiency and expanding market reach. Expansion into emerging markets presents significant growth potential, as does the development of innovative financing options to make aircraft ownership more accessible.
Key Players Shaping the Light Business Jet Market
- Bombardier
- Embraer
- Textron Aviation
- Honda Aircraft Company
- Cirrus Aircraft
- Pilatus Aircraft
Notable Milestones in Light Business Jet Sector
- 2020: Embraer launched a new generation of light business jets with enhanced fuel efficiency.
- 2022: Textron Aviation introduced a significant avionics upgrade across its light jet portfolio.
- 2023: Bombardier announced a major investment in the development of sustainable aviation fuels for its LBJ fleet.
In-Depth Light Business Jet Market Outlook
The Light Business Jet market is poised for continued growth, driven by technological advancements, expanding market penetration, and a rising demand for private air travel. Strategic opportunities lie in the development of innovative business models, such as fractional ownership and on-demand charter services, and a focus on sustainability through the adoption of more eco-friendly technologies. The market's future is promising, with substantial growth potential across various regions and segments.
Light Business Jet Segmentation
-
1. Application
- 1.1. Domestic Transport
- 1.2. International Transport
-
2. Types
- 2.1. Light Jets
- 2.2. Very Light Jets
Light Business Jet Segmentation By Geography
-
1. North America
- 1.1. United States
- 1.2. Canada
- 1.3. Mexico
-
2. South America
- 2.1. Brazil
- 2.2. Argentina
- 2.3. Rest of South America
-
3. Europe
- 3.1. United Kingdom
- 3.2. Germany
- 3.3. France
- 3.4. Italy
- 3.5. Spain
- 3.6. Russia
- 3.7. Benelux
- 3.8. Nordics
- 3.9. Rest of Europe
-
4. Middle East & Africa
- 4.1. Turkey
- 4.2. Israel
- 4.3. GCC
- 4.4. North Africa
- 4.5. South Africa
- 4.6. Rest of Middle East & Africa
-
5. Asia Pacific
- 5.1. China
- 5.2. India
- 5.3. Japan
- 5.4. South Korea
- 5.5. ASEAN
- 5.6. Oceania
- 5.7. Rest of Asia Pacific
Light Business Jet Regional Market Share
Geographic Coverage of Light Business Jet
Light Business Jet REPORT HIGHLIGHTS
| Aspects | Details |
|---|---|
| Study Period | 2020-2034 |
| Base Year | 2025 |
| Estimated Year | 2026 |
| Forecast Period | 2026-2034 |
| Historical Period | 2020-2025 |
| Growth Rate | CAGR of 1.21% from 2020-2034 |
| Segmentation |
|
Table of Contents
- 1. Introduction
- 1.1. Research Scope
- 1.2. Market Segmentation
- 1.3. Research Objective
- 1.4. Definitions and Assumptions
- 2. Executive Summary
- 2.1. Market Snapshot
- 3. Market Dynamics
- 3.1. Market Drivers
- 3.2. Market Restrains
- 3.3. Market Trends
- 3.4. Market Opportunities
- 4. Market Factor Analysis
- 4.1. Porters Five Forces
- 4.1.1. Bargaining Power of Suppliers
- 4.1.2. Bargaining Power of Buyers
- 4.1.3. Threat of New Entrants
- 4.1.4. Threat of Substitutes
- 4.1.5. Competitive Rivalry
- 4.2. PESTEL analysis
- 4.3. BCG Analysis
- 4.3.1. Stars (High Growth, High Market Share)
- 4.3.2. Cash Cows (Low Growth, High Market Share)
- 4.3.3. Question Mark (High Growth, Low Market Share)
- 4.3.4. Dogs (Low Growth, Low Market Share)
- 4.4. Ansoff Matrix Analysis
- 4.5. Supply Chain Analysis
- 4.6. Regulatory Landscape
- 4.7. Current Market Potential and Opportunity Assessment (TAM–SAM–SOM Framework)
- 4.8. IMR Analyst Note
- 4.1. Porters Five Forces
- 5. Market Analysis, Insights and Forecast 2021-2033
- 5.1. Market Analysis, Insights and Forecast - by Application
- 5.1.1. Domestic Transport
- 5.1.2. International Transport
- 5.2. Market Analysis, Insights and Forecast - by Types
- 5.2.1. Light Jets
- 5.2.2. Very Light Jets
- 5.3. Market Analysis, Insights and Forecast - by Region
- 5.3.1. North America
- 5.3.2. South America
- 5.3.3. Europe
- 5.3.4. Middle East & Africa
- 5.3.5. Asia Pacific
- 5.1. Market Analysis, Insights and Forecast - by Application
- 6. Global Light Business Jet Analysis, Insights and Forecast, 2021-2033
- 6.1. Market Analysis, Insights and Forecast - by Application
- 6.1.1. Domestic Transport
- 6.1.2. International Transport
- 6.2. Market Analysis, Insights and Forecast - by Types
- 6.2.1. Light Jets
- 6.2.2. Very Light Jets
- 6.1. Market Analysis, Insights and Forecast - by Application
- 7. North America Light Business Jet Analysis, Insights and Forecast, 2020-2032
- 7.1. Market Analysis, Insights and Forecast - by Application
- 7.1.1. Domestic Transport
- 7.1.2. International Transport
- 7.2. Market Analysis, Insights and Forecast - by Types
- 7.2.1. Light Jets
- 7.2.2. Very Light Jets
- 7.1. Market Analysis, Insights and Forecast - by Application
- 8. South America Light Business Jet Analysis, Insights and Forecast, 2020-2032
- 8.1. Market Analysis, Insights and Forecast - by Application
- 8.1.1. Domestic Transport
- 8.1.2. International Transport
- 8.2. Market Analysis, Insights and Forecast - by Types
- 8.2.1. Light Jets
- 8.2.2. Very Light Jets
- 8.1. Market Analysis, Insights and Forecast - by Application
- 9. Europe Light Business Jet Analysis, Insights and Forecast, 2020-2032
- 9.1. Market Analysis, Insights and Forecast - by Application
- 9.1.1. Domestic Transport
- 9.1.2. International Transport
- 9.2. Market Analysis, Insights and Forecast - by Types
- 9.2.1. Light Jets
- 9.2.2. Very Light Jets
- 9.1. Market Analysis, Insights and Forecast - by Application
- 10. Middle East & Africa Light Business Jet Analysis, Insights and Forecast, 2020-2032
- 10.1. Market Analysis, Insights and Forecast - by Application
- 10.1.1. Domestic Transport
- 10.1.2. International Transport
- 10.2. Market Analysis, Insights and Forecast - by Types
- 10.2.1. Light Jets
- 10.2.2. Very Light Jets
- 10.1. Market Analysis, Insights and Forecast - by Application
- 11. Asia Pacific Light Business Jet Analysis, Insights and Forecast, 2020-2032
- 11.1. Market Analysis, Insights and Forecast - by Application
- 11.1.1. Domestic Transport
- 11.1.2. International Transport
- 11.2. Market Analysis, Insights and Forecast - by Types
- 11.2.1. Light Jets
- 11.2.2. Very Light Jets
- 11.1. Market Analysis, Insights and Forecast - by Application
- 12. Competitive Analysis
- 12.1. Company Profiles
- 12.1.1 Bombardier
- 12.1.1.1. Company Overview
- 12.1.1.2. Products
- 12.1.1.3. Company Financials
- 12.1.1.4. SWOT Analysis
- 12.1.2 Embraer
- 12.1.2.1. Company Overview
- 12.1.2.2. Products
- 12.1.2.3. Company Financials
- 12.1.2.4. SWOT Analysis
- 12.1.3 Textron Aviation
- 12.1.3.1. Company Overview
- 12.1.3.2. Products
- 12.1.3.3. Company Financials
- 12.1.3.4. SWOT Analysis
- 12.1.4 Honda Aircraft Company
- 12.1.4.1. Company Overview
- 12.1.4.2. Products
- 12.1.4.3. Company Financials
- 12.1.4.4. SWOT Analysis
- 12.1.5 Cirrus Aircraft
- 12.1.5.1. Company Overview
- 12.1.5.2. Products
- 12.1.5.3. Company Financials
- 12.1.5.4. SWOT Analysis
- 12.1.6 Pilatus Aircraft
- 12.1.6.1. Company Overview
- 12.1.6.2. Products
- 12.1.6.3. Company Financials
- 12.1.6.4. SWOT Analysis
- 12.1.1 Bombardier
- 12.2. Market Entropy
- 12.2.1 Company's Key Areas Served
- 12.2.2 Recent Developments
- 12.3. Company Market Share Analysis 2025
- 12.3.1 Top 5 Companies Market Share Analysis
- 12.3.2 Top 3 Companies Market Share Analysis
- 12.4. List of Potential Customers
- 13. Research Methodology
List of Figures
- Figure 1: Global Light Business Jet Revenue Breakdown (billion, %) by Region 2025 & 2033
- Figure 2: Global Light Business Jet Volume Breakdown (K, %) by Region 2025 & 2033
- Figure 3: North America Light Business Jet Revenue (billion), by Application 2025 & 2033
- Figure 4: North America Light Business Jet Volume (K), by Application 2025 & 2033
- Figure 5: North America Light Business Jet Revenue Share (%), by Application 2025 & 2033
- Figure 6: North America Light Business Jet Volume Share (%), by Application 2025 & 2033
- Figure 7: North America Light Business Jet Revenue (billion), by Types 2025 & 2033
- Figure 8: North America Light Business Jet Volume (K), by Types 2025 & 2033
- Figure 9: North America Light Business Jet Revenue Share (%), by Types 2025 & 2033
- Figure 10: North America Light Business Jet Volume Share (%), by Types 2025 & 2033
- Figure 11: North America Light Business Jet Revenue (billion), by Country 2025 & 2033
- Figure 12: North America Light Business Jet Volume (K), by Country 2025 & 2033
- Figure 13: North America Light Business Jet Revenue Share (%), by Country 2025 & 2033
- Figure 14: North America Light Business Jet Volume Share (%), by Country 2025 & 2033
- Figure 15: South America Light Business Jet Revenue (billion), by Application 2025 & 2033
- Figure 16: South America Light Business Jet Volume (K), by Application 2025 & 2033
- Figure 17: South America Light Business Jet Revenue Share (%), by Application 2025 & 2033
- Figure 18: South America Light Business Jet Volume Share (%), by Application 2025 & 2033
- Figure 19: South America Light Business Jet Revenue (billion), by Types 2025 & 2033
- Figure 20: South America Light Business Jet Volume (K), by Types 2025 & 2033
- Figure 21: South America Light Business Jet Revenue Share (%), by Types 2025 & 2033
- Figure 22: South America Light Business Jet Volume Share (%), by Types 2025 & 2033
- Figure 23: South America Light Business Jet Revenue (billion), by Country 2025 & 2033
- Figure 24: South America Light Business Jet Volume (K), by Country 2025 & 2033
- Figure 25: South America Light Business Jet Revenue Share (%), by Country 2025 & 2033
- Figure 26: South America Light Business Jet Volume Share (%), by Country 2025 & 2033
- Figure 27: Europe Light Business Jet Revenue (billion), by Application 2025 & 2033
- Figure 28: Europe Light Business Jet Volume (K), by Application 2025 & 2033
- Figure 29: Europe Light Business Jet Revenue Share (%), by Application 2025 & 2033
- Figure 30: Europe Light Business Jet Volume Share (%), by Application 2025 & 2033
- Figure 31: Europe Light Business Jet Revenue (billion), by Types 2025 & 2033
- Figure 32: Europe Light Business Jet Volume (K), by Types 2025 & 2033
- Figure 33: Europe Light Business Jet Revenue Share (%), by Types 2025 & 2033
- Figure 34: Europe Light Business Jet Volume Share (%), by Types 2025 & 2033
- Figure 35: Europe Light Business Jet Revenue (billion), by Country 2025 & 2033
- Figure 36: Europe Light Business Jet Volume (K), by Country 2025 & 2033
- Figure 37: Europe Light Business Jet Revenue Share (%), by Country 2025 & 2033
- Figure 38: Europe Light Business Jet Volume Share (%), by Country 2025 & 2033
- Figure 39: Middle East & Africa Light Business Jet Revenue (billion), by Application 2025 & 2033
- Figure 40: Middle East & Africa Light Business Jet Volume (K), by Application 2025 & 2033
- Figure 41: Middle East & Africa Light Business Jet Revenue Share (%), by Application 2025 & 2033
- Figure 42: Middle East & Africa Light Business Jet Volume Share (%), by Application 2025 & 2033
- Figure 43: Middle East & Africa Light Business Jet Revenue (billion), by Types 2025 & 2033
- Figure 44: Middle East & Africa Light Business Jet Volume (K), by Types 2025 & 2033
- Figure 45: Middle East & Africa Light Business Jet Revenue Share (%), by Types 2025 & 2033
- Figure 46: Middle East & Africa Light Business Jet Volume Share (%), by Types 2025 & 2033
- Figure 47: Middle East & Africa Light Business Jet Revenue (billion), by Country 2025 & 2033
- Figure 48: Middle East & Africa Light Business Jet Volume (K), by Country 2025 & 2033
- Figure 49: Middle East & Africa Light Business Jet Revenue Share (%), by Country 2025 & 2033
- Figure 50: Middle East & Africa Light Business Jet Volume Share (%), by Country 2025 & 2033
- Figure 51: Asia Pacific Light Business Jet Revenue (billion), by Application 2025 & 2033
- Figure 52: Asia Pacific Light Business Jet Volume (K), by Application 2025 & 2033
- Figure 53: Asia Pacific Light Business Jet Revenue Share (%), by Application 2025 & 2033
- Figure 54: Asia Pacific Light Business Jet Volume Share (%), by Application 2025 & 2033
- Figure 55: Asia Pacific Light Business Jet Revenue (billion), by Types 2025 & 2033
- Figure 56: Asia Pacific Light Business Jet Volume (K), by Types 2025 & 2033
- Figure 57: Asia Pacific Light Business Jet Revenue Share (%), by Types 2025 & 2033
- Figure 58: Asia Pacific Light Business Jet Volume Share (%), by Types 2025 & 2033
- Figure 59: Asia Pacific Light Business Jet Revenue (billion), by Country 2025 & 2033
- Figure 60: Asia Pacific Light Business Jet Volume (K), by Country 2025 & 2033
- Figure 61: Asia Pacific Light Business Jet Revenue Share (%), by Country 2025 & 2033
- Figure 62: Asia Pacific Light Business Jet Volume Share (%), by Country 2025 & 2033
List of Tables
- Table 1: Global Light Business Jet Revenue billion Forecast, by Application 2020 & 2033
- Table 2: Global Light Business Jet Volume K Forecast, by Application 2020 & 2033
- Table 3: Global Light Business Jet Revenue billion Forecast, by Types 2020 & 2033
- Table 4: Global Light Business Jet Volume K Forecast, by Types 2020 & 2033
- Table 5: Global Light Business Jet Revenue billion Forecast, by Region 2020 & 2033
- Table 6: Global Light Business Jet Volume K Forecast, by Region 2020 & 2033
- Table 7: Global Light Business Jet Revenue billion Forecast, by Application 2020 & 2033
- Table 8: Global Light Business Jet Volume K Forecast, by Application 2020 & 2033
- Table 9: Global Light Business Jet Revenue billion Forecast, by Types 2020 & 2033
- Table 10: Global Light Business Jet Volume K Forecast, by Types 2020 & 2033
- Table 11: Global Light Business Jet Revenue billion Forecast, by Country 2020 & 2033
- Table 12: Global Light Business Jet Volume K Forecast, by Country 2020 & 2033
- Table 13: United States Light Business Jet Revenue (billion) Forecast, by Application 2020 & 2033
- Table 14: United States Light Business Jet Volume (K) Forecast, by Application 2020 & 2033
- Table 15: Canada Light Business Jet Revenue (billion) Forecast, by Application 2020 & 2033
- Table 16: Canada Light Business Jet Volume (K) Forecast, by Application 2020 & 2033
- Table 17: Mexico Light Business Jet Revenue (billion) Forecast, by Application 2020 & 2033
- Table 18: Mexico Light Business Jet Volume (K) Forecast, by Application 2020 & 2033
- Table 19: Global Light Business Jet Revenue billion Forecast, by Application 2020 & 2033
- Table 20: Global Light Business Jet Volume K Forecast, by Application 2020 & 2033
- Table 21: Global Light Business Jet Revenue billion Forecast, by Types 2020 & 2033
- Table 22: Global Light Business Jet Volume K Forecast, by Types 2020 & 2033
- Table 23: Global Light Business Jet Revenue billion Forecast, by Country 2020 & 2033
- Table 24: Global Light Business Jet Volume K Forecast, by Country 2020 & 2033
- Table 25: Brazil Light Business Jet Revenue (billion) Forecast, by Application 2020 & 2033
- Table 26: Brazil Light Business Jet Volume (K) Forecast, by Application 2020 & 2033
- Table 27: Argentina Light Business Jet Revenue (billion) Forecast, by Application 2020 & 2033
- Table 28: Argentina Light Business Jet Volume (K) Forecast, by Application 2020 & 2033
- Table 29: Rest of South America Light Business Jet Revenue (billion) Forecast, by Application 2020 & 2033
- Table 30: Rest of South America Light Business Jet Volume (K) Forecast, by Application 2020 & 2033
- Table 31: Global Light Business Jet Revenue billion Forecast, by Application 2020 & 2033
- Table 32: Global Light Business Jet Volume K Forecast, by Application 2020 & 2033
- Table 33: Global Light Business Jet Revenue billion Forecast, by Types 2020 & 2033
- Table 34: Global Light Business Jet Volume K Forecast, by Types 2020 & 2033
- Table 35: Global Light Business Jet Revenue billion Forecast, by Country 2020 & 2033
- Table 36: Global Light Business Jet Volume K Forecast, by Country 2020 & 2033
- Table 37: United Kingdom Light Business Jet Revenue (billion) Forecast, by Application 2020 & 2033
- Table 38: United Kingdom Light Business Jet Volume (K) Forecast, by Application 2020 & 2033
- Table 39: Germany Light Business Jet Revenue (billion) Forecast, by Application 2020 & 2033
- Table 40: Germany Light Business Jet Volume (K) Forecast, by Application 2020 & 2033
- Table 41: France Light Business Jet Revenue (billion) Forecast, by Application 2020 & 2033
- Table 42: France Light Business Jet Volume (K) Forecast, by Application 2020 & 2033
- Table 43: Italy Light Business Jet Revenue (billion) Forecast, by Application 2020 & 2033
- Table 44: Italy Light Business Jet Volume (K) Forecast, by Application 2020 & 2033
- Table 45: Spain Light Business Jet Revenue (billion) Forecast, by Application 2020 & 2033
- Table 46: Spain Light Business Jet Volume (K) Forecast, by Application 2020 & 2033
- Table 47: Russia Light Business Jet Revenue (billion) Forecast, by Application 2020 & 2033
- Table 48: Russia Light Business Jet Volume (K) Forecast, by Application 2020 & 2033
- Table 49: Benelux Light Business Jet Revenue (billion) Forecast, by Application 2020 & 2033
- Table 50: Benelux Light Business Jet Volume (K) Forecast, by Application 2020 & 2033
- Table 51: Nordics Light Business Jet Revenue (billion) Forecast, by Application 2020 & 2033
- Table 52: Nordics Light Business Jet Volume (K) Forecast, by Application 2020 & 2033
- Table 53: Rest of Europe Light Business Jet Revenue (billion) Forecast, by Application 2020 & 2033
- Table 54: Rest of Europe Light Business Jet Volume (K) Forecast, by Application 2020 & 2033
- Table 55: Global Light Business Jet Revenue billion Forecast, by Application 2020 & 2033
- Table 56: Global Light Business Jet Volume K Forecast, by Application 2020 & 2033
- Table 57: Global Light Business Jet Revenue billion Forecast, by Types 2020 & 2033
- Table 58: Global Light Business Jet Volume K Forecast, by Types 2020 & 2033
- Table 59: Global Light Business Jet Revenue billion Forecast, by Country 2020 & 2033
- Table 60: Global Light Business Jet Volume K Forecast, by Country 2020 & 2033
- Table 61: Turkey Light Business Jet Revenue (billion) Forecast, by Application 2020 & 2033
- Table 62: Turkey Light Business Jet Volume (K) Forecast, by Application 2020 & 2033
- Table 63: Israel Light Business Jet Revenue (billion) Forecast, by Application 2020 & 2033
- Table 64: Israel Light Business Jet Volume (K) Forecast, by Application 2020 & 2033
- Table 65: GCC Light Business Jet Revenue (billion) Forecast, by Application 2020 & 2033
- Table 66: GCC Light Business Jet Volume (K) Forecast, by Application 2020 & 2033
- Table 67: North Africa Light Business Jet Revenue (billion) Forecast, by Application 2020 & 2033
- Table 68: North Africa Light Business Jet Volume (K) Forecast, by Application 2020 & 2033
- Table 69: South Africa Light Business Jet Revenue (billion) Forecast, by Application 2020 & 2033
- Table 70: South Africa Light Business Jet Volume (K) Forecast, by Application 2020 & 2033
- Table 71: Rest of Middle East & Africa Light Business Jet Revenue (billion) Forecast, by Application 2020 & 2033
- Table 72: Rest of Middle East & Africa Light Business Jet Volume (K) Forecast, by Application 2020 & 2033
- Table 73: Global Light Business Jet Revenue billion Forecast, by Application 2020 & 2033
- Table 74: Global Light Business Jet Volume K Forecast, by Application 2020 & 2033
- Table 75: Global Light Business Jet Revenue billion Forecast, by Types 2020 & 2033
- Table 76: Global Light Business Jet Volume K Forecast, by Types 2020 & 2033
- Table 77: Global Light Business Jet Revenue billion Forecast, by Country 2020 & 2033
- Table 78: Global Light Business Jet Volume K Forecast, by Country 2020 & 2033
- Table 79: China Light Business Jet Revenue (billion) Forecast, by Application 2020 & 2033
- Table 80: China Light Business Jet Volume (K) Forecast, by Application 2020 & 2033
- Table 81: India Light Business Jet Revenue (billion) Forecast, by Application 2020 & 2033
- Table 82: India Light Business Jet Volume (K) Forecast, by Application 2020 & 2033
- Table 83: Japan Light Business Jet Revenue (billion) Forecast, by Application 2020 & 2033
- Table 84: Japan Light Business Jet Volume (K) Forecast, by Application 2020 & 2033
- Table 85: South Korea Light Business Jet Revenue (billion) Forecast, by Application 2020 & 2033
- Table 86: South Korea Light Business Jet Volume (K) Forecast, by Application 2020 & 2033
- Table 87: ASEAN Light Business Jet Revenue (billion) Forecast, by Application 2020 & 2033
- Table 88: ASEAN Light Business Jet Volume (K) Forecast, by Application 2020 & 2033
- Table 89: Oceania Light Business Jet Revenue (billion) Forecast, by Application 2020 & 2033
- Table 90: Oceania Light Business Jet Volume (K) Forecast, by Application 2020 & 2033
- Table 91: Rest of Asia Pacific Light Business Jet Revenue (billion) Forecast, by Application 2020 & 2033
- Table 92: Rest of Asia Pacific Light Business Jet Volume (K) Forecast, by Application 2020 & 2033
Frequently Asked Questions
1. What is the projected Compound Annual Growth Rate (CAGR) of the Light Business Jet?
The projected CAGR is approximately 1.21%.
2. Which companies are prominent players in the Light Business Jet?
Key companies in the market include Bombardier, Embraer, Textron Aviation, Honda Aircraft Company, Cirrus Aircraft, Pilatus Aircraft.
3. What are the main segments of the Light Business Jet?
The market segments include Application, Types.
4. Can you provide details about the market size?
The market size is estimated to be USD 15.5 billion as of 2022.
5. What are some drivers contributing to market growth?
N/A
6. What are the notable trends driving market growth?
N/A
7. Are there any restraints impacting market growth?
N/A
8. Can you provide examples of recent developments in the market?
N/A
9. What pricing options are available for accessing the report?
Pricing options include single-user, multi-user, and enterprise licenses priced at USD 3350.00, USD 5025.00, and USD 6700.00 respectively.
10. Is the market size provided in terms of value or volume?
The market size is provided in terms of value, measured in billion and volume, measured in K.
11. Are there any specific market keywords associated with the report?
Yes, the market keyword associated with the report is "Light Business Jet," which aids in identifying and referencing the specific market segment covered.
12. How do I determine which pricing option suits my needs best?
The pricing options vary based on user requirements and access needs. Individual users may opt for single-user licenses, while businesses requiring broader access may choose multi-user or enterprise licenses for cost-effective access to the report.
13. Are there any additional resources or data provided in the Light Business Jet report?
While the report offers comprehensive insights, it's advisable to review the specific contents or supplementary materials provided to ascertain if additional resources or data are available.
14. How can I stay updated on further developments or reports in the Light Business Jet?
To stay informed about further developments, trends, and reports in the Light Business Jet, consider subscribing to industry newsletters, following relevant companies and organizations, or regularly checking reputable industry news sources and publications.
Methodology
Step 1 - Identification of Relevant Samples Size from Population Database


Step 2 - Approaches for Defining Global Market Size (Value, Volume* & Price*)

Note*: In applicable scenarios
Step 3 - Data Sources
Primary Research
- Web Analytics
- Survey Reports
- Research Institute
- Latest Research Reports
- Opinion Leaders
Secondary Research
- Annual Reports
- White Paper
- Latest Press Release
- Industry Association
- Paid Database
- Investor Presentations

Step 4 - Data Triangulation
Involves using different sources of information in order to increase the validity of a study
These sources are likely to be stakeholders in a program - participants, other researchers, program staff, other community members, and so on.
Then we put all data in single framework & apply various statistical tools to find out the dynamic on the market.
During the analysis stage, feedback from the stakeholder groups would be compared to determine areas of agreement as well as areas of divergence