

Key Insights
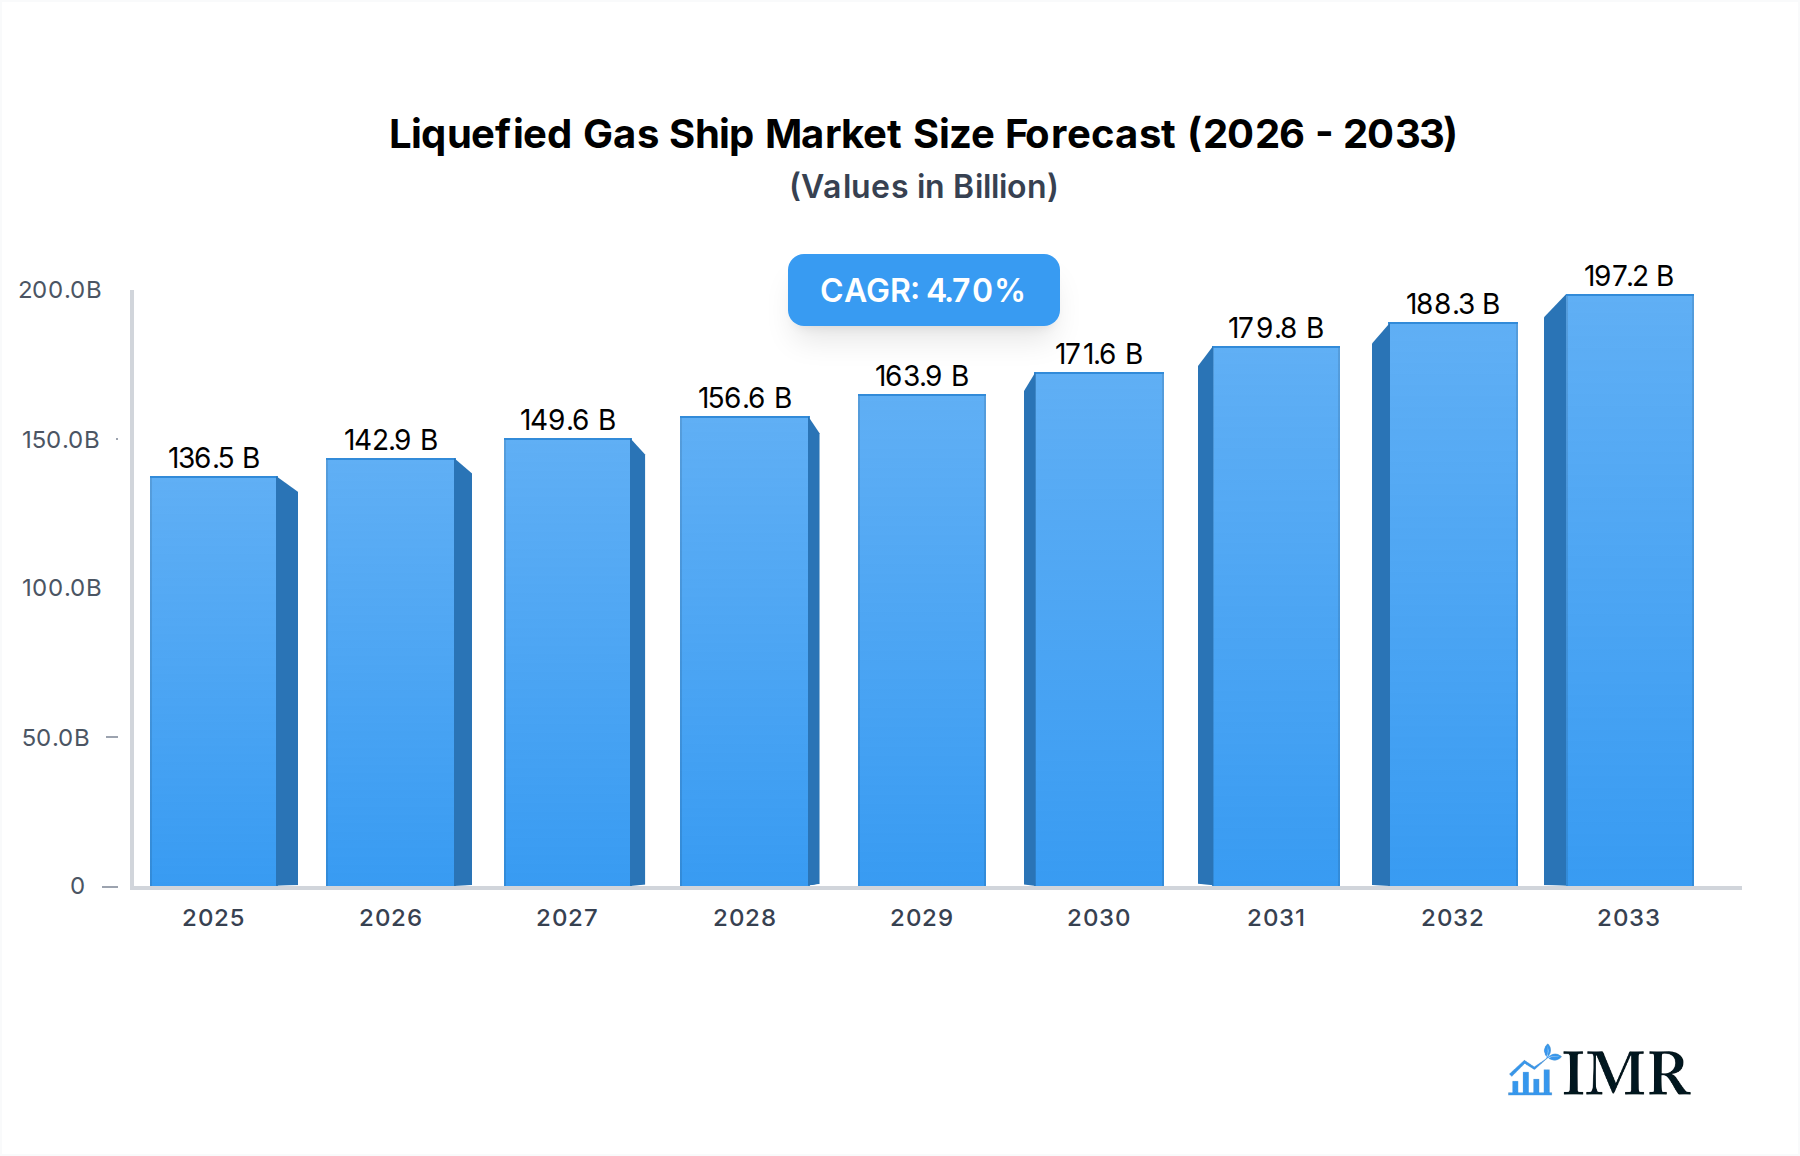
The global liquefied gas ship market is poised for robust expansion, driven by escalating demand for natural gas and petroleum gas coupled with the critical need for efficient and safe transportation of these vital energy resources. With a current market size estimated at 136.55 billion USD in 2025, the industry is projected to witness a healthy compound annual growth rate (CAGR) of 4.71% through 2033. This growth is primarily fueled by the increasing adoption of Liquefied Natural Gas (LNG) as a cleaner alternative to traditional fossil fuels in power generation and industrial processes, particularly in emerging economies. Furthermore, the continuous expansion of global trade and the associated surge in demand for Liquefied Petroleum Gas (LPG) for residential, commercial, and industrial uses are significant contributors. Investments in new shipbuilding capacities and advancements in vessel technology, focusing on enhanced safety features and environmental compliance, are also shaping the market landscape.

Liquefied Gas Ship Market Size (In Billion)
The market is characterized by a dynamic interplay of drivers and restraints. Key drivers include the global energy transition initiatives promoting cleaner fuels, the expansion of LNG import/export terminals worldwide, and favorable government policies supporting the development of gas infrastructure. However, the market also faces challenges such as high capital investment required for vessel construction, stringent environmental regulations that necessitate costly upgrades, and the inherent volatility in energy prices, which can impact shipping demand. Geopolitically, the increasing focus on energy security and diversification of supply routes is creating new opportunities for liquefied gas shipping. Major players are actively engaged in technological innovation and strategic collaborations to enhance their fleet capabilities and maintain a competitive edge in this evolving sector.
Liquefied Gas Ship Company Market Share
This comprehensive report delves into the dynamic global Liquefied Gas Ship market, encompassing Liquefied Natural Gas (LNG) Carriers and Liquefied Petroleum Gas (LPG) Carriers. Analyzing the market from 2019 to 2033, with a base year of 2025, this study offers unparalleled insights into the forces shaping this critical sector of the energy supply chain. Explore market size evolution, key growth drivers, regional dominance, product innovations, and the competitive landscape, all presented with actionable intelligence for stakeholders.
Liquefied Gas Ship Market Dynamics & Structure
The Liquefied Gas Ship market is characterized by significant capital investment and technological sophistication, leading to a moderately consolidated structure dominated by a few key shipbuilding giants. Technological innovation is a paramount driver, focusing on enhanced fuel efficiency, increased cargo capacity, and improved safety features for both LNG and LPG vessels. Stringent international regulations, particularly those concerning emissions and safety protocols, play a crucial role in shaping vessel design and operational standards, fostering continuous innovation. Competitive product substitutes, while limited for the primary function of transporting liquefied gases, can emerge in the form of alternative energy sources or transportation methods, albeit with significant infrastructure dependencies. End-user demographics are predominantly large energy corporations and national oil companies seeking reliable and efficient global energy distribution. Merger and acquisition (M&A) trends are observed as companies seek to expand their fleets, gain technological expertise, or consolidate their market position.
- Market Concentration: Dominated by a few large shipbuilding conglomerates with significant order backlogs.
- Technological Innovation Drivers: Fuel efficiency (e.g., dual-fuel engines), improved cargo containment systems, advanced navigation and safety systems.
- Regulatory Frameworks: International Maritime Organization (IMO) regulations (e.g., IMO 2020, decarbonization targets), national port state controls.
- Competitive Product Substitutes: Limited for primary transport, but shifts in global energy demand and alternative energy infrastructure can indirectly impact fleet utilization.
- End-User Demographics: Major energy producers, traders, and utility companies.
- M&A Trends: Strategic acquisitions for fleet expansion and technological integration.
Liquefied Gas Ship Growth Trends & Insights
The global Liquefied Gas Ship market is projected for robust growth throughout the forecast period of 2025–2033. This expansion is underpinned by the increasing global demand for natural gas and petroleum gas as cleaner-burning and more accessible energy sources. The Compound Annual Growth Rate (CAGR) is expected to be significant, driven by the need for new and advanced vessels to meet evolving energy policies and logistical requirements. Market penetration of modern, fuel-efficient ships is accelerating, displacing older and less environmentally compliant tonnage. Technological disruptions, such as advancements in cryogenic containment systems and the increasing adoption of dual-fuel engines capable of running on LNG or other alternative fuels, are reshaping the industry. Consumer behavior shifts towards energy diversification and the quest for energy security are further fueling the demand for liquefied gas transportation. The historical period (2019–2024) has laid the groundwork with steady fleet expansion and technological refinements, setting a strong trajectory for the estimated year of 2025 and beyond.
Dominant Regions, Countries, or Segments in Liquefied Gas Ship
The Liquefied Natural Gas (LNG) Carrier segment, specifically for the transport of Natural Gas, is currently the dominant force driving growth in the global Liquefied Gas Ship market. This dominance is fueled by the escalating global demand for natural gas, driven by its role as a cleaner alternative to coal and oil in power generation and industrial processes. Countries with substantial natural gas reserves and those heavily reliant on energy imports are at the forefront of this demand. Economic policies encouraging energy diversification and the development of robust regasification infrastructure in importing nations are critical growth catalysts. Furthermore, the geopolitical landscape, with its influence on energy supply chains, continues to bolster the importance of LNG transport.
- Key Drivers for LNG Carrier Dominance:
- Increasing global demand for cleaner energy sources.
- Expansion of LNG liquefaction and regasification infrastructure worldwide.
- Energy security initiatives by importing nations.
- Favorable economic policies promoting natural gas adoption.
- Advancements in LNG carrier technology enhancing efficiency and safety.
- Market Share and Growth Potential: The LNG carrier segment is expected to hold a larger market share and exhibit higher growth rates compared to LPG carriers due to the scale of the natural gas market and its strategic importance in the global energy transition.
Liquefied Gas Ship Product Landscape
The product landscape of Liquefied Gas Ships is characterized by continuous innovation in design and technology to optimize cargo handling, safety, and operational efficiency. Liquefied Natural Gas Carriers (LNG Carriers) are distinguished by their advanced containment systems, such as membrane and moss-type tanks, capable of maintaining cryogenic temperatures. Liquefied Petroleum Gas Carriers (LPG Carriers), while also utilizing advanced containment, cater to a broader range of petroleum gases. Recent product innovations focus on enhanced fuel efficiency through dual-fuel engines and optimized hull designs, reducing emissions and operational costs. Performance metrics are critically evaluated based on cargo capacity, speed, fuel consumption, and compliance with stringent environmental regulations. Unique selling propositions often lie in specialized vessel designs catering to specific trade routes or cargo requirements, alongside the integration of cutting-edge navigation and safety systems.
Key Drivers, Barriers & Challenges in Liquefied Gas Ship
Key Drivers: The Liquefied Gas Ship market is propelled by the burgeoning global demand for Natural Gas and Petroleum Gas as transitional and cleaner energy sources. Escalating urbanization, industrial growth, and energy diversification strategies by nations worldwide are significant drivers. Technological advancements in shipbuilding, including more fuel-efficient engines and advanced cargo containment systems, are also crucial. Furthermore, supportive government policies aimed at enhancing energy security and reducing carbon footprints provide a conducive environment for fleet expansion and modernization.
Barriers & Challenges: Supply chain disruptions, particularly for specialized components and during periods of high demand for shipbuilding, pose a significant challenge. Stringent and evolving regulatory frameworks, especially those concerning environmental emissions and safety, necessitate substantial investment in compliance and can lead to project delays. Intense competition among shipbuilders and charterers, coupled with fluctuating charter rates, can impact profitability. The high capital expenditure for building and maintaining these specialized vessels represents a substantial financial barrier. Furthermore, geopolitical instability can affect energy trade routes and demand, indirectly impacting fleet utilization and newbuild orders.
Emerging Opportunities in Liquefied Gas Ship
Emerging opportunities in the Liquefied Gas Ship sector lie in the growing demand for smaller-scale LNG carriers (Feedermax and Handy-size) to facilitate regional LNG trade and bunkering operations. The development of ammonia and methanol-fueled gas carriers presents a significant future opportunity, aligning with decarbonization goals. Furthermore, the increasing adoption of floating storage and regasification units (FSRUs) for LNG import infrastructure drives demand for associated shuttle and support vessels. Evolving consumer preferences towards cleaner fuels in sectors like shipping and power generation are creating new markets for dedicated liquefied gas transportation solutions. The potential for developing specialized carriers for emerging liquefied gases like ethane also represents a nascent but promising area.
Growth Accelerators in the Liquefied Gas Ship Industry
The Liquefied Gas Ship industry's long-term growth is being accelerated by a confluence of factors. Technological breakthroughs in propulsion systems, such as advanced dual-fuel engines and the exploration of hydrogen fuel cells, are critical. Strategic partnerships between shipowners, shipbuilders, and technology providers are fostering innovation and enabling the development of next-generation vessels. Market expansion strategies, including the entry of new players in emerging economies and the development of new trade routes, are also significant accelerators. The ongoing global push for decarbonization and the increasing classification of natural gas as a bridge fuel are providing sustained impetus for LNG and, to some extent, LPG carrier newbuilds and retrofits.
Key Players Shaping the Liquefied Gas Ship Market
- Samsung Heavy Industries
- Hyundai Heavy Industries
- Daewoo Shipbuilding & Marine Engineering
- Sembcorp Marine
- Keppel Offshore & Marine
- Wison
- Hudong Zhonghua
- Knutsen Group
- Mitsui O.S.K. Lines
- Fiskerstrand
- MHI Nagasaki
- Kawassaki HI Sakaide
- Mitsubishi Heavy Industries
- Hyundai Mipo
- Namura Shipbuilding
- Barkmeijer Stroobos BV
- Damen Shipyard
- Meyer Werft
- Kawasaki Shipbuilding Corporation
- Meyer Turku
- Stx Shipbuilding
Notable Milestones in Liquefied Gas Ship Sector
- 2019: Introduction of advanced membrane containment systems for increased efficiency in LNG carriers.
- 2020: Implementation of IMO 2020 regulations, driving demand for cleaner fuel solutions and impacting older vessel designs.
- 2021: Increased orders for dual-fuel LNG carriers, reflecting a growing commitment to reducing emissions.
- 2022: Significant advancements in the design of smaller-scale LNG vessels for regional distribution and bunkering.
- 2023: First large-scale commercial deployment of ammonia-fueled vessel prototypes, signaling a new era of alternative fuel exploration.
- 2024: Continued growth in LNG trade volumes, leading to sustained demand for new vessel construction and chartering.
In-Depth Liquefied Gas Ship Market Outlook
The future outlook for the Liquefied Gas Ship market remains exceptionally strong, fueled by the global energy transition and the indispensable role of liquefied gases. Growth accelerators, including the relentless pursuit of decarbonization and the strategic positioning of natural gas as a vital bridge fuel, will continue to drive demand for advanced LNG and LPG carriers. Technological breakthroughs in alternative fuels and propulsion systems promise to usher in a new generation of environmentally compliant vessels, creating significant opportunities for innovation and market leadership. Strategic partnerships and expanded trade routes, particularly in emerging economies, will further solidify the market's expansion. The ongoing investment in liquefaction and regasification infrastructure globally ensures sustained demand for the specialized logistics provided by these critical assets.
Liquefied Gas Ship Segmentation
-
1. Application
- 1.1. Natural Gas
- 1.2. Petroleum Gas
-
2. Type
- 2.1. Liquefied Natural Gas Carrier (LNG Carrier)
- 2.2. Liquefied Petroleum Gas Carrier (LPG Carrier)
Liquefied Gas Ship Segmentation By Geography
-
1. North America
- 1.1. United States
- 1.2. Canada
- 1.3. Mexico
-
2. South America
- 2.1. Brazil
- 2.2. Argentina
- 2.3. Rest of South America
-
3. Europe
- 3.1. United Kingdom
- 3.2. Germany
- 3.3. France
- 3.4. Italy
- 3.5. Spain
- 3.6. Russia
- 3.7. Benelux
- 3.8. Nordics
- 3.9. Rest of Europe
-
4. Middle East & Africa
- 4.1. Turkey
- 4.2. Israel
- 4.3. GCC
- 4.4. North Africa
- 4.5. South Africa
- 4.6. Rest of Middle East & Africa
-
5. Asia Pacific
- 5.1. China
- 5.2. India
- 5.3. Japan
- 5.4. South Korea
- 5.5. ASEAN
- 5.6. Oceania
- 5.7. Rest of Asia Pacific
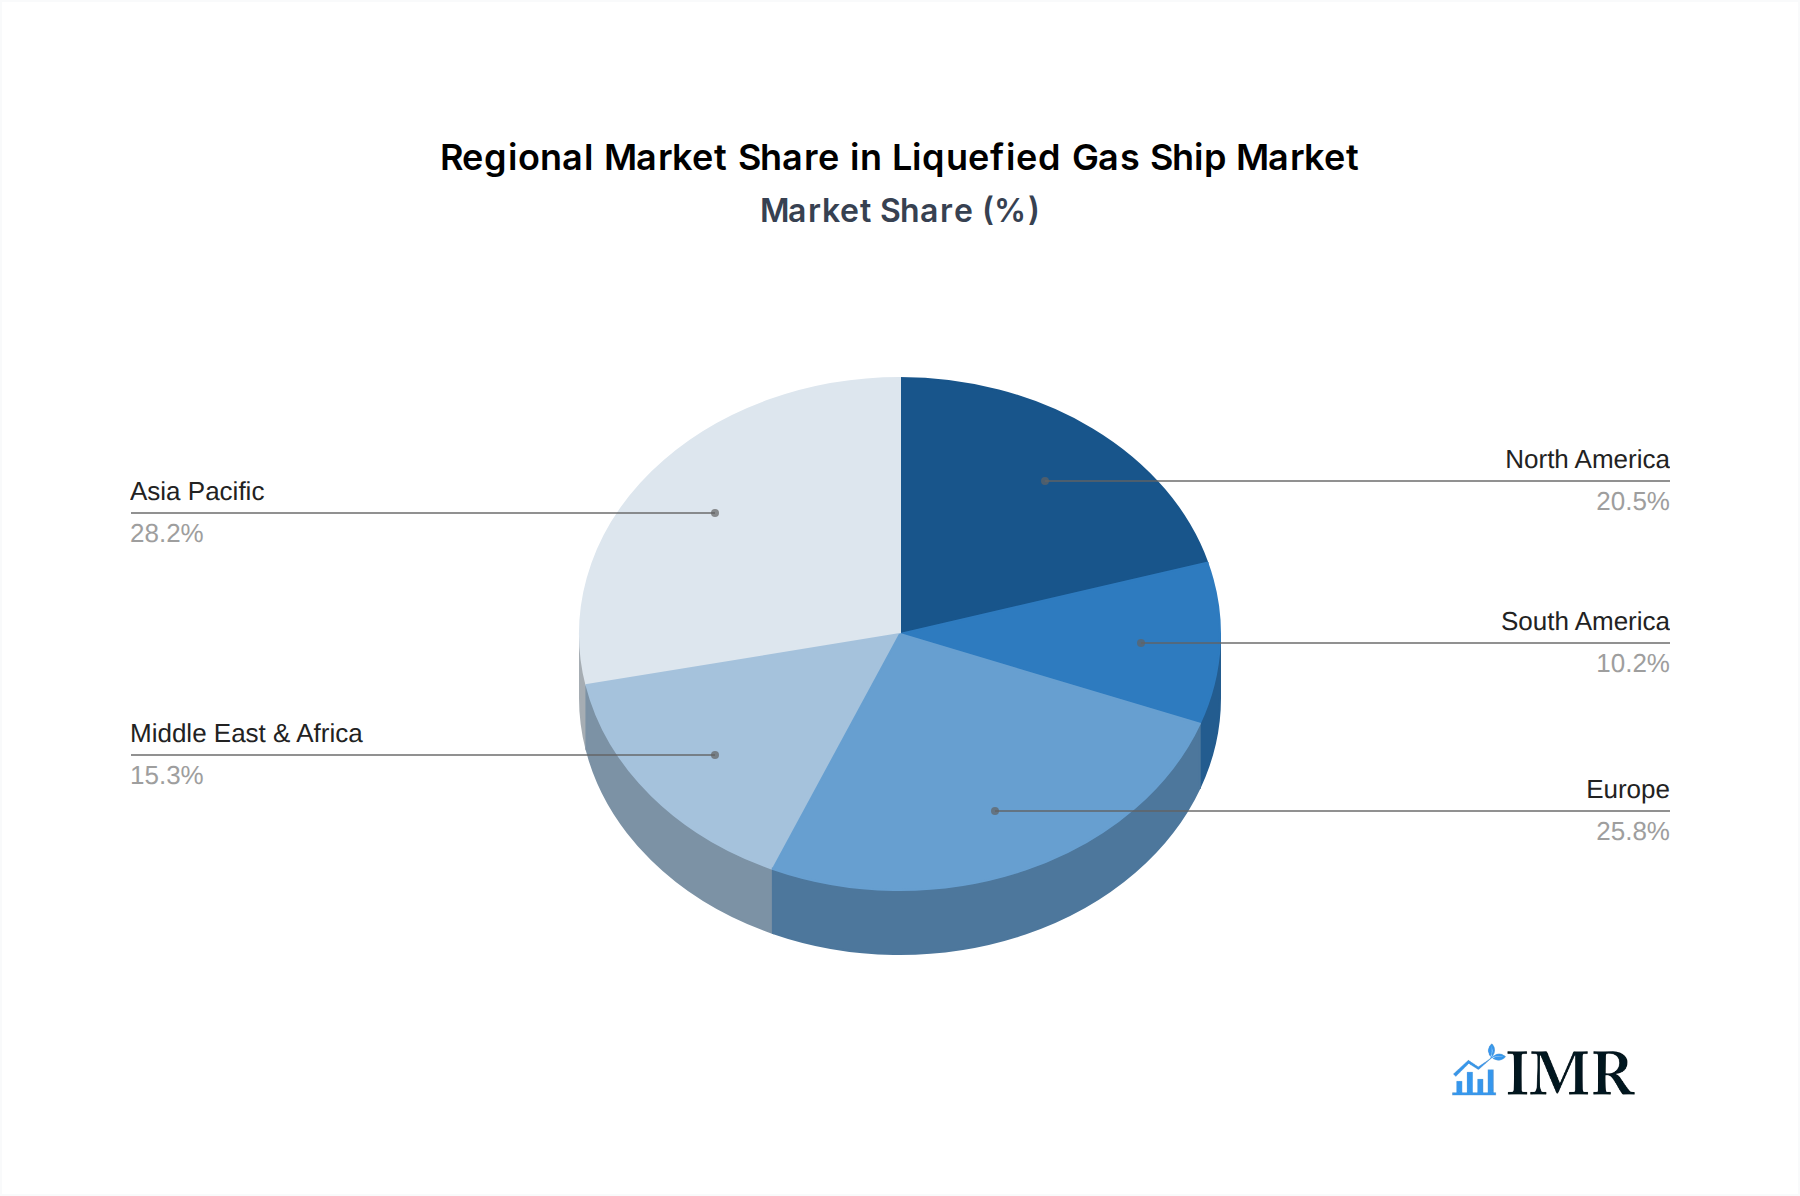
Liquefied Gas Ship Regional Market Share
Geographic Coverage of Liquefied Gas Ship
Liquefied Gas Ship REPORT HIGHLIGHTS
| Aspects | Details |
|---|---|
| Study Period | 2020-2034 |
| Base Year | 2025 |
| Estimated Year | 2026 |
| Forecast Period | 2026-2034 |
| Historical Period | 2020-2025 |
| Growth Rate | CAGR of 4.71% from 2020-2034 |
| Segmentation |
|
Table of Contents
- 1. Introduction
- 1.1. Research Scope
- 1.2. Market Segmentation
- 1.3. Research Objective
- 1.4. Definitions and Assumptions
- 2. Executive Summary
- 2.1. Market Snapshot
- 3. Market Dynamics
- 3.1. Market Drivers
- 3.2. Market Restrains
- 3.3. Market Trends
- 3.4. Market Opportunities
- 4. Market Factor Analysis
- 4.1. Porters Five Forces
- 4.1.1. Bargaining Power of Suppliers
- 4.1.2. Bargaining Power of Buyers
- 4.1.3. Threat of New Entrants
- 4.1.4. Threat of Substitutes
- 4.1.5. Competitive Rivalry
- 4.2. PESTEL analysis
- 4.3. BCG Analysis
- 4.3.1. Stars (High Growth, High Market Share)
- 4.3.2. Cash Cows (Low Growth, High Market Share)
- 4.3.3. Question Mark (High Growth, Low Market Share)
- 4.3.4. Dogs (Low Growth, Low Market Share)
- 4.4. Ansoff Matrix Analysis
- 4.5. Supply Chain Analysis
- 4.6. Regulatory Landscape
- 4.7. Current Market Potential and Opportunity Assessment (TAM–SAM–SOM Framework)
- 4.8. IMR Analyst Note
- 4.1. Porters Five Forces
- 5. Market Analysis, Insights and Forecast 2021-2033
- 5.1. Market Analysis, Insights and Forecast - by Application
- 5.1.1. Natural Gas
- 5.1.2. Petroleum Gas
- 5.2. Market Analysis, Insights and Forecast - by Type
- 5.2.1. Liquefied Natural Gas Carrier (LNG Carrier)
- 5.2.2. Liquefied Petroleum Gas Carrier (LPG Carrier)
- 5.3. Market Analysis, Insights and Forecast - by Region
- 5.3.1. North America
- 5.3.2. South America
- 5.3.3. Europe
- 5.3.4. Middle East & Africa
- 5.3.5. Asia Pacific
- 5.1. Market Analysis, Insights and Forecast - by Application
- 6. Global Liquefied Gas Ship Analysis, Insights and Forecast, 2021-2033
- 6.1. Market Analysis, Insights and Forecast - by Application
- 6.1.1. Natural Gas
- 6.1.2. Petroleum Gas
- 6.2. Market Analysis, Insights and Forecast - by Type
- 6.2.1. Liquefied Natural Gas Carrier (LNG Carrier)
- 6.2.2. Liquefied Petroleum Gas Carrier (LPG Carrier)
- 6.1. Market Analysis, Insights and Forecast - by Application
- 7. North America Liquefied Gas Ship Analysis, Insights and Forecast, 2020-2032
- 7.1. Market Analysis, Insights and Forecast - by Application
- 7.1.1. Natural Gas
- 7.1.2. Petroleum Gas
- 7.2. Market Analysis, Insights and Forecast - by Type
- 7.2.1. Liquefied Natural Gas Carrier (LNG Carrier)
- 7.2.2. Liquefied Petroleum Gas Carrier (LPG Carrier)
- 7.1. Market Analysis, Insights and Forecast - by Application
- 8. South America Liquefied Gas Ship Analysis, Insights and Forecast, 2020-2032
- 8.1. Market Analysis, Insights and Forecast - by Application
- 8.1.1. Natural Gas
- 8.1.2. Petroleum Gas
- 8.2. Market Analysis, Insights and Forecast - by Type
- 8.2.1. Liquefied Natural Gas Carrier (LNG Carrier)
- 8.2.2. Liquefied Petroleum Gas Carrier (LPG Carrier)
- 8.1. Market Analysis, Insights and Forecast - by Application
- 9. Europe Liquefied Gas Ship Analysis, Insights and Forecast, 2020-2032
- 9.1. Market Analysis, Insights and Forecast - by Application
- 9.1.1. Natural Gas
- 9.1.2. Petroleum Gas
- 9.2. Market Analysis, Insights and Forecast - by Type
- 9.2.1. Liquefied Natural Gas Carrier (LNG Carrier)
- 9.2.2. Liquefied Petroleum Gas Carrier (LPG Carrier)
- 9.1. Market Analysis, Insights and Forecast - by Application
- 10. Middle East & Africa Liquefied Gas Ship Analysis, Insights and Forecast, 2020-2032
- 10.1. Market Analysis, Insights and Forecast - by Application
- 10.1.1. Natural Gas
- 10.1.2. Petroleum Gas
- 10.2. Market Analysis, Insights and Forecast - by Type
- 10.2.1. Liquefied Natural Gas Carrier (LNG Carrier)
- 10.2.2. Liquefied Petroleum Gas Carrier (LPG Carrier)
- 10.1. Market Analysis, Insights and Forecast - by Application
- 11. Asia Pacific Liquefied Gas Ship Analysis, Insights and Forecast, 2020-2032
- 11.1. Market Analysis, Insights and Forecast - by Application
- 11.1.1. Natural Gas
- 11.1.2. Petroleum Gas
- 11.2. Market Analysis, Insights and Forecast - by Type
- 11.2.1. Liquefied Natural Gas Carrier (LNG Carrier)
- 11.2.2. Liquefied Petroleum Gas Carrier (LPG Carrier)
- 11.1. Market Analysis, Insights and Forecast - by Application
- 12. Competitive Analysis
- 12.1. Company Profiles
- 12.1.1 Samsung Heavy Industries
- 12.1.1.1. Company Overview
- 12.1.1.2. Products
- 12.1.1.3. Company Financials
- 12.1.1.4. SWOT Analysis
- 12.1.2 Hyundai Heavy Industries
- 12.1.2.1. Company Overview
- 12.1.2.2. Products
- 12.1.2.3. Company Financials
- 12.1.2.4. SWOT Analysis
- 12.1.3 Daewoo Shipbuilding & Marine Engineering
- 12.1.3.1. Company Overview
- 12.1.3.2. Products
- 12.1.3.3. Company Financials
- 12.1.3.4. SWOT Analysis
- 12.1.4 Sembcorp Marine
- 12.1.4.1. Company Overview
- 12.1.4.2. Products
- 12.1.4.3. Company Financials
- 12.1.4.4. SWOT Analysis
- 12.1.5 Keppel Offshore & Marine
- 12.1.5.1. Company Overview
- 12.1.5.2. Products
- 12.1.5.3. Company Financials
- 12.1.5.4. SWOT Analysis
- 12.1.6 Wison
- 12.1.6.1. Company Overview
- 12.1.6.2. Products
- 12.1.6.3. Company Financials
- 12.1.6.4. SWOT Analysis
- 12.1.7 Hudong Zhonghua
- 12.1.7.1. Company Overview
- 12.1.7.2. Products
- 12.1.7.3. Company Financials
- 12.1.7.4. SWOT Analysis
- 12.1.8 Knutsen Group
- 12.1.8.1. Company Overview
- 12.1.8.2. Products
- 12.1.8.3. Company Financials
- 12.1.8.4. SWOT Analysis
- 12.1.9 Mitsui O.S.K. Lines
- 12.1.9.1. Company Overview
- 12.1.9.2. Products
- 12.1.9.3. Company Financials
- 12.1.9.4. SWOT Analysis
- 12.1.10 Fiskerstrand
- 12.1.10.1. Company Overview
- 12.1.10.2. Products
- 12.1.10.3. Company Financials
- 12.1.10.4. SWOT Analysis
- 12.1.11 MHI Nagasaki
- 12.1.11.1. Company Overview
- 12.1.11.2. Products
- 12.1.11.3. Company Financials
- 12.1.11.4. SWOT Analysis
- 12.1.12 Kawassaki HI Sakaide
- 12.1.12.1. Company Overview
- 12.1.12.2. Products
- 12.1.12.3. Company Financials
- 12.1.12.4. SWOT Analysis
- 12.1.13 Mitsubishi Heavy Industries
- 12.1.13.1. Company Overview
- 12.1.13.2. Products
- 12.1.13.3. Company Financials
- 12.1.13.4. SWOT Analysis
- 12.1.14 Hyundai Mipo
- 12.1.14.1. Company Overview
- 12.1.14.2. Products
- 12.1.14.3. Company Financials
- 12.1.14.4. SWOT Analysis
- 12.1.15 Namura Shipbuilding
- 12.1.15.1. Company Overview
- 12.1.15.2. Products
- 12.1.15.3. Company Financials
- 12.1.15.4. SWOT Analysis
- 12.1.16 Barkmeijer Stroobos BV
- 12.1.16.1. Company Overview
- 12.1.16.2. Products
- 12.1.16.3. Company Financials
- 12.1.16.4. SWOT Analysis
- 12.1.17 Damen Shipyard
- 12.1.17.1. Company Overview
- 12.1.17.2. Products
- 12.1.17.3. Company Financials
- 12.1.17.4. SWOT Analysis
- 12.1.18 Meyer Werft
- 12.1.18.1. Company Overview
- 12.1.18.2. Products
- 12.1.18.3. Company Financials
- 12.1.18.4. SWOT Analysis
- 12.1.19 Kawasaki Shipbuilding Corporation
- 12.1.19.1. Company Overview
- 12.1.19.2. Products
- 12.1.19.3. Company Financials
- 12.1.19.4. SWOT Analysis
- 12.1.20 Meyer Turku
- 12.1.20.1. Company Overview
- 12.1.20.2. Products
- 12.1.20.3. Company Financials
- 12.1.20.4. SWOT Analysis
- 12.1.21 Stx Shipbuilding
- 12.1.21.1. Company Overview
- 12.1.21.2. Products
- 12.1.21.3. Company Financials
- 12.1.21.4. SWOT Analysis
- 12.1.1 Samsung Heavy Industries
- 12.2. Market Entropy
- 12.2.1 Company's Key Areas Served
- 12.2.2 Recent Developments
- 12.3. Company Market Share Analysis 2025
- 12.3.1 Top 5 Companies Market Share Analysis
- 12.3.2 Top 3 Companies Market Share Analysis
- 12.4. List of Potential Customers
- 13. Research Methodology
List of Figures
- Figure 1: Global Liquefied Gas Ship Revenue Breakdown (undefined, %) by Region 2025 & 2033
- Figure 2: North America Liquefied Gas Ship Revenue (undefined), by Application 2025 & 2033
- Figure 3: North America Liquefied Gas Ship Revenue Share (%), by Application 2025 & 2033
- Figure 4: North America Liquefied Gas Ship Revenue (undefined), by Type 2025 & 2033
- Figure 5: North America Liquefied Gas Ship Revenue Share (%), by Type 2025 & 2033
- Figure 6: North America Liquefied Gas Ship Revenue (undefined), by Country 2025 & 2033
- Figure 7: North America Liquefied Gas Ship Revenue Share (%), by Country 2025 & 2033
- Figure 8: South America Liquefied Gas Ship Revenue (undefined), by Application 2025 & 2033
- Figure 9: South America Liquefied Gas Ship Revenue Share (%), by Application 2025 & 2033
- Figure 10: South America Liquefied Gas Ship Revenue (undefined), by Type 2025 & 2033
- Figure 11: South America Liquefied Gas Ship Revenue Share (%), by Type 2025 & 2033
- Figure 12: South America Liquefied Gas Ship Revenue (undefined), by Country 2025 & 2033
- Figure 13: South America Liquefied Gas Ship Revenue Share (%), by Country 2025 & 2033
- Figure 14: Europe Liquefied Gas Ship Revenue (undefined), by Application 2025 & 2033
- Figure 15: Europe Liquefied Gas Ship Revenue Share (%), by Application 2025 & 2033
- Figure 16: Europe Liquefied Gas Ship Revenue (undefined), by Type 2025 & 2033
- Figure 17: Europe Liquefied Gas Ship Revenue Share (%), by Type 2025 & 2033
- Figure 18: Europe Liquefied Gas Ship Revenue (undefined), by Country 2025 & 2033
- Figure 19: Europe Liquefied Gas Ship Revenue Share (%), by Country 2025 & 2033
- Figure 20: Middle East & Africa Liquefied Gas Ship Revenue (undefined), by Application 2025 & 2033
- Figure 21: Middle East & Africa Liquefied Gas Ship Revenue Share (%), by Application 2025 & 2033
- Figure 22: Middle East & Africa Liquefied Gas Ship Revenue (undefined), by Type 2025 & 2033
- Figure 23: Middle East & Africa Liquefied Gas Ship Revenue Share (%), by Type 2025 & 2033
- Figure 24: Middle East & Africa Liquefied Gas Ship Revenue (undefined), by Country 2025 & 2033
- Figure 25: Middle East & Africa Liquefied Gas Ship Revenue Share (%), by Country 2025 & 2033
- Figure 26: Asia Pacific Liquefied Gas Ship Revenue (undefined), by Application 2025 & 2033
- Figure 27: Asia Pacific Liquefied Gas Ship Revenue Share (%), by Application 2025 & 2033
- Figure 28: Asia Pacific Liquefied Gas Ship Revenue (undefined), by Type 2025 & 2033
- Figure 29: Asia Pacific Liquefied Gas Ship Revenue Share (%), by Type 2025 & 2033
- Figure 30: Asia Pacific Liquefied Gas Ship Revenue (undefined), by Country 2025 & 2033
- Figure 31: Asia Pacific Liquefied Gas Ship Revenue Share (%), by Country 2025 & 2033
List of Tables
- Table 1: Global Liquefied Gas Ship Revenue undefined Forecast, by Application 2020 & 2033
- Table 2: Global Liquefied Gas Ship Revenue undefined Forecast, by Type 2020 & 2033
- Table 3: Global Liquefied Gas Ship Revenue undefined Forecast, by Region 2020 & 2033
- Table 4: Global Liquefied Gas Ship Revenue undefined Forecast, by Application 2020 & 2033
- Table 5: Global Liquefied Gas Ship Revenue undefined Forecast, by Type 2020 & 2033
- Table 6: Global Liquefied Gas Ship Revenue undefined Forecast, by Country 2020 & 2033
- Table 7: United States Liquefied Gas Ship Revenue (undefined) Forecast, by Application 2020 & 2033
- Table 8: Canada Liquefied Gas Ship Revenue (undefined) Forecast, by Application 2020 & 2033
- Table 9: Mexico Liquefied Gas Ship Revenue (undefined) Forecast, by Application 2020 & 2033
- Table 10: Global Liquefied Gas Ship Revenue undefined Forecast, by Application 2020 & 2033
- Table 11: Global Liquefied Gas Ship Revenue undefined Forecast, by Type 2020 & 2033
- Table 12: Global Liquefied Gas Ship Revenue undefined Forecast, by Country 2020 & 2033
- Table 13: Brazil Liquefied Gas Ship Revenue (undefined) Forecast, by Application 2020 & 2033
- Table 14: Argentina Liquefied Gas Ship Revenue (undefined) Forecast, by Application 2020 & 2033
- Table 15: Rest of South America Liquefied Gas Ship Revenue (undefined) Forecast, by Application 2020 & 2033
- Table 16: Global Liquefied Gas Ship Revenue undefined Forecast, by Application 2020 & 2033
- Table 17: Global Liquefied Gas Ship Revenue undefined Forecast, by Type 2020 & 2033
- Table 18: Global Liquefied Gas Ship Revenue undefined Forecast, by Country 2020 & 2033
- Table 19: United Kingdom Liquefied Gas Ship Revenue (undefined) Forecast, by Application 2020 & 2033
- Table 20: Germany Liquefied Gas Ship Revenue (undefined) Forecast, by Application 2020 & 2033
- Table 21: France Liquefied Gas Ship Revenue (undefined) Forecast, by Application 2020 & 2033
- Table 22: Italy Liquefied Gas Ship Revenue (undefined) Forecast, by Application 2020 & 2033
- Table 23: Spain Liquefied Gas Ship Revenue (undefined) Forecast, by Application 2020 & 2033
- Table 24: Russia Liquefied Gas Ship Revenue (undefined) Forecast, by Application 2020 & 2033
- Table 25: Benelux Liquefied Gas Ship Revenue (undefined) Forecast, by Application 2020 & 2033
- Table 26: Nordics Liquefied Gas Ship Revenue (undefined) Forecast, by Application 2020 & 2033
- Table 27: Rest of Europe Liquefied Gas Ship Revenue (undefined) Forecast, by Application 2020 & 2033
- Table 28: Global Liquefied Gas Ship Revenue undefined Forecast, by Application 2020 & 2033
- Table 29: Global Liquefied Gas Ship Revenue undefined Forecast, by Type 2020 & 2033
- Table 30: Global Liquefied Gas Ship Revenue undefined Forecast, by Country 2020 & 2033
- Table 31: Turkey Liquefied Gas Ship Revenue (undefined) Forecast, by Application 2020 & 2033
- Table 32: Israel Liquefied Gas Ship Revenue (undefined) Forecast, by Application 2020 & 2033
- Table 33: GCC Liquefied Gas Ship Revenue (undefined) Forecast, by Application 2020 & 2033
- Table 34: North Africa Liquefied Gas Ship Revenue (undefined) Forecast, by Application 2020 & 2033
- Table 35: South Africa Liquefied Gas Ship Revenue (undefined) Forecast, by Application 2020 & 2033
- Table 36: Rest of Middle East & Africa Liquefied Gas Ship Revenue (undefined) Forecast, by Application 2020 & 2033
- Table 37: Global Liquefied Gas Ship Revenue undefined Forecast, by Application 2020 & 2033
- Table 38: Global Liquefied Gas Ship Revenue undefined Forecast, by Type 2020 & 2033
- Table 39: Global Liquefied Gas Ship Revenue undefined Forecast, by Country 2020 & 2033
- Table 40: China Liquefied Gas Ship Revenue (undefined) Forecast, by Application 2020 & 2033
- Table 41: India Liquefied Gas Ship Revenue (undefined) Forecast, by Application 2020 & 2033
- Table 42: Japan Liquefied Gas Ship Revenue (undefined) Forecast, by Application 2020 & 2033
- Table 43: South Korea Liquefied Gas Ship Revenue (undefined) Forecast, by Application 2020 & 2033
- Table 44: ASEAN Liquefied Gas Ship Revenue (undefined) Forecast, by Application 2020 & 2033
- Table 45: Oceania Liquefied Gas Ship Revenue (undefined) Forecast, by Application 2020 & 2033
- Table 46: Rest of Asia Pacific Liquefied Gas Ship Revenue (undefined) Forecast, by Application 2020 & 2033
Frequently Asked Questions
1. What is the projected Compound Annual Growth Rate (CAGR) of the Liquefied Gas Ship?
The projected CAGR is approximately 4.71%.
2. Which companies are prominent players in the Liquefied Gas Ship?
Key companies in the market include Samsung Heavy Industries, Hyundai Heavy Industries, Daewoo Shipbuilding & Marine Engineering, Sembcorp Marine, Keppel Offshore & Marine, Wison, Hudong Zhonghua, Knutsen Group, Mitsui O.S.K. Lines, Fiskerstrand, MHI Nagasaki, Kawassaki HI Sakaide, Mitsubishi Heavy Industries, Hyundai Mipo, Namura Shipbuilding, Barkmeijer Stroobos BV, Damen Shipyard, Meyer Werft, Kawasaki Shipbuilding Corporation, Meyer Turku, Stx Shipbuilding.
3. What are the main segments of the Liquefied Gas Ship?
The market segments include Application, Type.
4. Can you provide details about the market size?
The market size is estimated to be USD XXX N/A as of 2022.
5. What are some drivers contributing to market growth?
N/A
6. What are the notable trends driving market growth?
N/A
7. Are there any restraints impacting market growth?
N/A
8. Can you provide examples of recent developments in the market?
N/A
9. What pricing options are available for accessing the report?
Pricing options include single-user, multi-user, and enterprise licenses priced at USD 4250.00, USD 6375.00, and USD 8500.00 respectively.
10. Is the market size provided in terms of value or volume?
The market size is provided in terms of value, measured in N/A.
11. Are there any specific market keywords associated with the report?
Yes, the market keyword associated with the report is "Liquefied Gas Ship," which aids in identifying and referencing the specific market segment covered.
12. How do I determine which pricing option suits my needs best?
The pricing options vary based on user requirements and access needs. Individual users may opt for single-user licenses, while businesses requiring broader access may choose multi-user or enterprise licenses for cost-effective access to the report.
13. Are there any additional resources or data provided in the Liquefied Gas Ship report?
While the report offers comprehensive insights, it's advisable to review the specific contents or supplementary materials provided to ascertain if additional resources or data are available.
14. How can I stay updated on further developments or reports in the Liquefied Gas Ship?
To stay informed about further developments, trends, and reports in the Liquefied Gas Ship, consider subscribing to industry newsletters, following relevant companies and organizations, or regularly checking reputable industry news sources and publications.
Methodology
Step 1 - Identification of Relevant Samples Size from Population Database


Step 2 - Approaches for Defining Global Market Size (Value, Volume* & Price*)

Note*: In applicable scenarios
Step 3 - Data Sources
Primary Research
- Web Analytics
- Survey Reports
- Research Institute
- Latest Research Reports
- Opinion Leaders
Secondary Research
- Annual Reports
- White Paper
- Latest Press Release
- Industry Association
- Paid Database
- Investor Presentations

Step 4 - Data Triangulation
Involves using different sources of information in order to increase the validity of a study
These sources are likely to be stakeholders in a program - participants, other researchers, program staff, other community members, and so on.
Then we put all data in single framework & apply various statistical tools to find out the dynamic on the market.
During the analysis stage, feedback from the stakeholder groups would be compared to determine areas of agreement as well as areas of divergence