

Key Insights
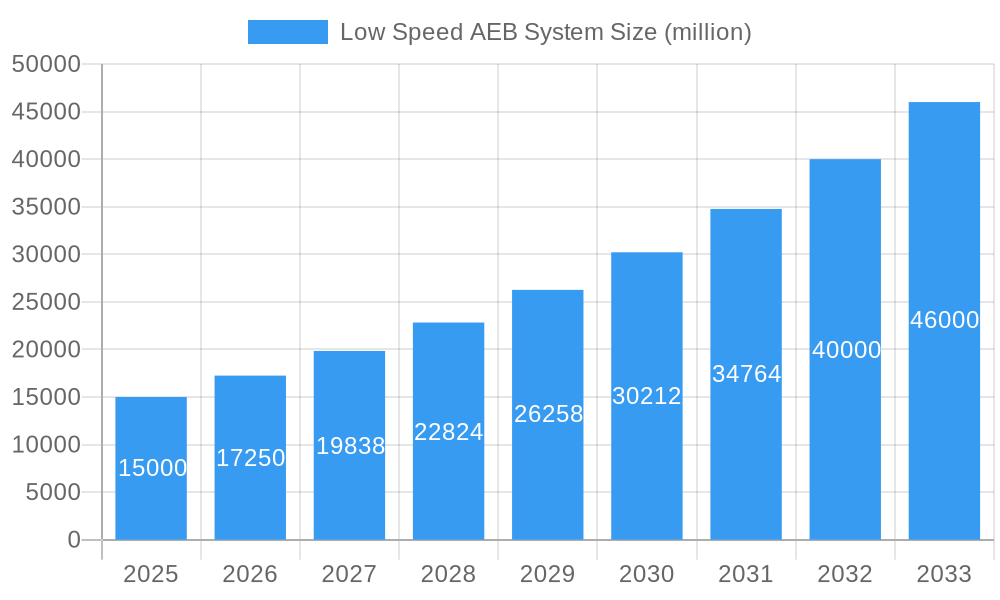
The Low Speed Automatic Emergency Braking (AEB) System market is experiencing robust growth, driven by increasing vehicle production, stringent government regulations mandating AEB in new vehicles, and rising consumer awareness of safety features. The market's expansion is fueled by technological advancements leading to more sophisticated and cost-effective AEB systems, making them increasingly accessible across various vehicle segments. We project a substantial market value increase over the forecast period (2025-2033), driven by a Compound Annual Growth Rate (CAGR) of approximately 15%. This growth is largely attributed to the widespread adoption of AEB across passenger cars and light commercial vehicles, particularly in developed regions with strong safety standards like North America and Europe. The increasing integration of AEB with advanced driver-assistance systems (ADAS) further bolsters market expansion.
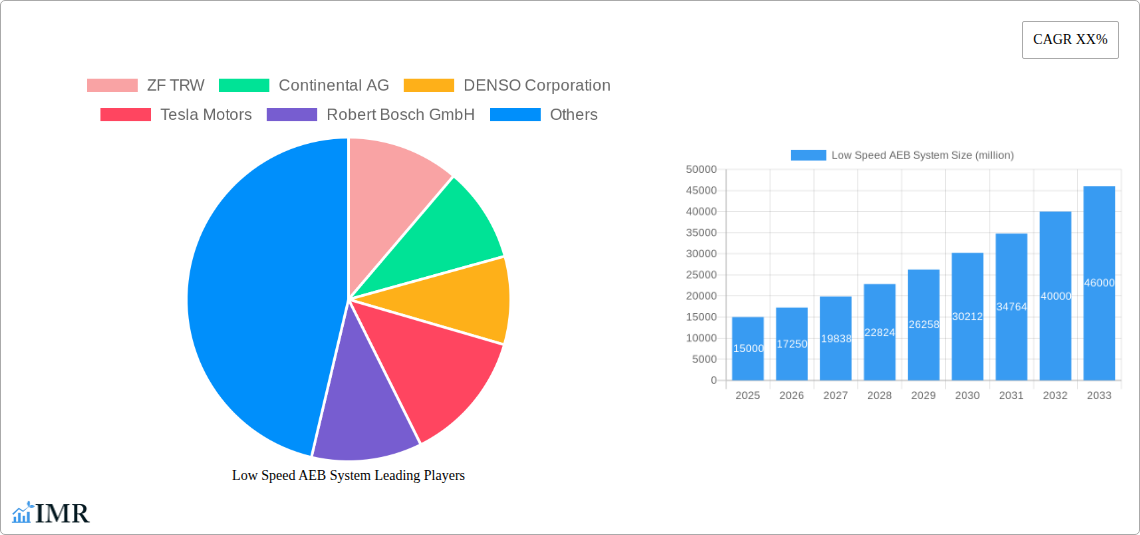
Low Speed AEB System Market Size (In Billion)
However, certain factors could potentially restrain market growth. The high initial investment required for AEB system integration might pose a challenge for smaller automakers, particularly in emerging markets. Furthermore, the complexity of integrating AEB with existing vehicle systems and the potential for false positives require continuous technological refinement. Nevertheless, the long-term market outlook remains positive, with increasing government support and consumer demand expected to overcome these challenges, leading to sustained and significant growth throughout the forecast period. Key players in the market include established automotive parts suppliers and automotive manufacturers, continuously innovating and competing to enhance system performance and affordability.
Low Speed AEB System Company Market Share
Low Speed AEB System Market Report: 2019-2033
This comprehensive report provides a detailed analysis of the Low Speed Automatic Emergency Braking (AEB) system market, encompassing market dynamics, growth trends, regional dominance, product landscape, key players, and future outlook. The study period covers 2019-2033, with a base year of 2025 and a forecast period of 2025-2033. This report is crucial for automotive manufacturers, Tier-1 suppliers, technology providers, investors, and regulatory bodies seeking to understand and capitalize on this rapidly evolving market. The parent market is the Advanced Driver-Assistance Systems (ADAS) market, and the child market is specifically Low Speed AEB systems within ADAS. The global market size in 2025 is estimated at xx million units.
Low Speed AEB System Market Dynamics & Structure
The low-speed AEB system market is characterized by intense competition among established automotive suppliers and emerging technology companies. Market concentration is moderate, with several key players holding significant shares. Technological innovation, driven by advancements in sensor technology (radar, lidar, camera), artificial intelligence (AI), and machine learning (ML), is a major driver of market growth. Stringent government regulations mandating AEB systems in new vehicles are accelerating adoption. The competitive landscape includes both established players and startups developing innovative solutions. The market also sees increasing mergers and acquisitions (M&A) activity as companies seek to expand their product portfolio and market reach. During the historical period (2019-2024), approximately xx M&A deals were recorded, leading to an increased market concentration of xx%.
- Market Concentration: Moderate, with top 5 players holding approximately xx% market share in 2025.
- Technological Innovation: Advancements in sensor fusion, AI, and ML are key drivers.
- Regulatory Frameworks: Government mandates for AEB are driving significant adoption.
- Competitive Substitutes: Limited direct substitutes, but alternative safety features exist.
- End-User Demographics: Primarily automotive manufacturers (OEMs) and Tier-1 suppliers.
- M&A Trends: Consolidation through acquisitions to enhance technological capabilities and market reach. xx major M&A deals predicted between 2025-2033.
Low Speed AEB System Growth Trends & Insights
The low-speed AEB system market experienced robust growth during the historical period (2019-2024), with a CAGR of xx%. This growth is primarily attributed to increasing vehicle production, rising consumer demand for advanced safety features, and government regulations. Market penetration is expected to increase significantly during the forecast period (2025-2033), driven by factors such as affordability improvements, enhanced system performance, and expanding applications beyond passenger vehicles to include commercial vehicles. Technological advancements, specifically in sensor technology and processing power, are contributing to higher accuracy and reliability of AEB systems, further fueling market adoption. Shifting consumer preferences towards vehicles equipped with advanced safety features are boosting demand. The market is expected to reach xx million units by 2033, demonstrating a CAGR of xx% during the forecast period.
Dominant Regions, Countries, or Segments in Low Speed AEB System
North America and Europe are currently the leading regions for low-speed AEB system adoption, driven by stringent safety regulations and high vehicle ownership rates. However, Asia-Pacific is expected to witness the fastest growth in the coming years due to rising disposable incomes, increasing vehicle sales, and government initiatives promoting vehicle safety. Within these regions, countries with strong automotive industries and robust safety regulations are demonstrating higher market penetration.
- Key Drivers: Stringent safety regulations, high vehicle sales, rising consumer awareness, government support for ADAS adoption.
- Dominance Factors: North America and Europe lead in market share due to early adoption and established regulations. Asia-Pacific exhibits the highest growth potential.
Low Speed AEB System Product Landscape
The market offers various low-speed AEB systems categorized by sensor technology (radar, camera, lidar, or fusion), performance parameters (braking distance, speed thresholds), and vehicle integration methods. Recent innovations focus on improved sensor accuracy, enhanced object recognition capabilities using AI and ML, and seamless integration with other ADAS functionalities. Unique selling propositions include superior performance in diverse driving conditions and reduced false-positive alerts.
Key Drivers, Barriers & Challenges in Low Speed AEB System
Key Drivers: Increasing consumer demand for safety features, stringent government regulations mandating AEB in new vehicles, technological advancements leading to more affordable and efficient systems.
Challenges: High initial costs of implementation, integration complexity with existing vehicle systems, potential for false positives, and supply chain constraints. The impact of these challenges can lead to a delay in adoption rates, slowing overall market growth by approximately xx% in 2027.
Emerging Opportunities in Low Speed AEB System
Emerging opportunities include expansion into untapped markets (developing economies), integration with autonomous driving systems, and development of more sophisticated algorithms for improved accuracy and reliability. The development of systems adaptable to diverse driving conditions and integration with other ADAS functions present further growth opportunities.
Growth Accelerators in the Low Speed AEB System Industry
Technological breakthroughs in sensor fusion, AI, and machine learning are key growth catalysts. Strategic partnerships between automotive manufacturers, Tier-1 suppliers, and technology companies are accelerating innovation and market penetration. The expansion into new vehicle segments (e.g., commercial vehicles, motorcycles) will further drive market expansion.
Key Players Shaping the Low Speed AEB System Market
- ZF TRW
- Continental AG
- DENSO Corporation
- Tesla Motors
- Robert Bosch GmbH
- Delphi Automotive Plc.
- Autoliv Inc.
- Magna International Inc.
- Mobileye NV
- Volvo Car Corporation
- Ford Motor
- Daimler
- Audi
- Volkswagen
- Toyota Motor
- Honda Motor
Notable Milestones in Low Speed AEB System Sector
- 2020: Increased regulatory mandates for AEB systems in several major markets.
- 2021: Launch of several advanced AEB systems integrating AI and machine learning.
- 2022: Significant M&A activity among Tier-1 suppliers to expand their product portfolio.
- 2023: Introduction of low-cost AEB systems targeting mass-market vehicles.
- 2024: Expansion of AEB technology into commercial vehicle segments.
In-Depth Low Speed AEB System Market Outlook
The low-speed AEB system market is poised for continued strong growth driven by technological advancements, regulatory changes, and increasing consumer demand for advanced safety features. Strategic partnerships, expansion into new markets and segments, and continuous innovation are expected to further accelerate market growth. The market presents significant opportunities for companies that can develop cost-effective, reliable, and highly accurate AEB systems.
Low Speed AEB System Segmentation
-
1. Application
- 1.1. Passenger Cars
- 1.2. Light Commercial Vehicle
- 1.3. Heavy Commercial Vehicle
-
2. Types
- 2.1. Forward Collision Warning
- 2.2. Dynamic Brake Support
- 2.3. Crash Imminent Braking
Low Speed AEB System Segmentation By Geography
-
1. North America
- 1.1. United States
- 1.2. Canada
- 1.3. Mexico
-
2. South America
- 2.1. Brazil
- 2.2. Argentina
- 2.3. Rest of South America
-
3. Europe
- 3.1. United Kingdom
- 3.2. Germany
- 3.3. France
- 3.4. Italy
- 3.5. Spain
- 3.6. Russia
- 3.7. Benelux
- 3.8. Nordics
- 3.9. Rest of Europe
-
4. Middle East & Africa
- 4.1. Turkey
- 4.2. Israel
- 4.3. GCC
- 4.4. North Africa
- 4.5. South Africa
- 4.6. Rest of Middle East & Africa
-
5. Asia Pacific
- 5.1. China
- 5.2. India
- 5.3. Japan
- 5.4. South Korea
- 5.5. ASEAN
- 5.6. Oceania
- 5.7. Rest of Asia Pacific

Low Speed AEB System Regional Market Share
Geographic Coverage of Low Speed AEB System
Low Speed AEB System REPORT HIGHLIGHTS
| Aspects | Details |
|---|---|
| Study Period | 2020-2034 |
| Base Year | 2025 |
| Estimated Year | 2026 |
| Forecast Period | 2026-2034 |
| Historical Period | 2020-2025 |
| Growth Rate | CAGR of XX% from 2020-2034 |
| Segmentation |
|
Table of Contents
- 1. Introduction
- 1.1. Research Scope
- 1.2. Market Segmentation
- 1.3. Research Objective
- 1.4. Definitions and Assumptions
- 2. Executive Summary
- 2.1. Market Snapshot
- 3. Market Dynamics
- 3.1. Market Drivers
- 3.2. Market Restrains
- 3.3. Market Trends
- 3.4. Market Opportunities
- 4. Market Factor Analysis
- 4.1. Porters Five Forces
- 4.1.1. Bargaining Power of Suppliers
- 4.1.2. Bargaining Power of Buyers
- 4.1.3. Threat of New Entrants
- 4.1.4. Threat of Substitutes
- 4.1.5. Competitive Rivalry
- 4.2. PESTEL analysis
- 4.3. BCG Analysis
- 4.3.1. Stars (High Growth, High Market Share)
- 4.3.2. Cash Cows (Low Growth, High Market Share)
- 4.3.3. Question Mark (High Growth, Low Market Share)
- 4.3.4. Dogs (Low Growth, Low Market Share)
- 4.4. Ansoff Matrix Analysis
- 4.5. Supply Chain Analysis
- 4.6. Regulatory Landscape
- 4.7. Current Market Potential and Opportunity Assessment (TAM–SAM–SOM Framework)
- 4.8. IMR Analyst Note
- 4.1. Porters Five Forces
- 5. Market Analysis, Insights and Forecast 2021-2033
- 5.1. Market Analysis, Insights and Forecast - by Application
- 5.1.1. Passenger Cars
- 5.1.2. Light Commercial Vehicle
- 5.1.3. Heavy Commercial Vehicle
- 5.2. Market Analysis, Insights and Forecast - by Types
- 5.2.1. Forward Collision Warning
- 5.2.2. Dynamic Brake Support
- 5.2.3. Crash Imminent Braking
- 5.3. Market Analysis, Insights and Forecast - by Region
- 5.3.1. North America
- 5.3.2. South America
- 5.3.3. Europe
- 5.3.4. Middle East & Africa
- 5.3.5. Asia Pacific
- 5.1. Market Analysis, Insights and Forecast - by Application
- 6. Global Low Speed AEB System Analysis, Insights and Forecast, 2021-2033
- 6.1. Market Analysis, Insights and Forecast - by Application
- 6.1.1. Passenger Cars
- 6.1.2. Light Commercial Vehicle
- 6.1.3. Heavy Commercial Vehicle
- 6.2. Market Analysis, Insights and Forecast - by Types
- 6.2.1. Forward Collision Warning
- 6.2.2. Dynamic Brake Support
- 6.2.3. Crash Imminent Braking
- 6.1. Market Analysis, Insights and Forecast - by Application
- 7. North America Low Speed AEB System Analysis, Insights and Forecast, 2020-2032
- 7.1. Market Analysis, Insights and Forecast - by Application
- 7.1.1. Passenger Cars
- 7.1.2. Light Commercial Vehicle
- 7.1.3. Heavy Commercial Vehicle
- 7.2. Market Analysis, Insights and Forecast - by Types
- 7.2.1. Forward Collision Warning
- 7.2.2. Dynamic Brake Support
- 7.2.3. Crash Imminent Braking
- 7.1. Market Analysis, Insights and Forecast - by Application
- 8. South America Low Speed AEB System Analysis, Insights and Forecast, 2020-2032
- 8.1. Market Analysis, Insights and Forecast - by Application
- 8.1.1. Passenger Cars
- 8.1.2. Light Commercial Vehicle
- 8.1.3. Heavy Commercial Vehicle
- 8.2. Market Analysis, Insights and Forecast - by Types
- 8.2.1. Forward Collision Warning
- 8.2.2. Dynamic Brake Support
- 8.2.3. Crash Imminent Braking
- 8.1. Market Analysis, Insights and Forecast - by Application
- 9. Europe Low Speed AEB System Analysis, Insights and Forecast, 2020-2032
- 9.1. Market Analysis, Insights and Forecast - by Application
- 9.1.1. Passenger Cars
- 9.1.2. Light Commercial Vehicle
- 9.1.3. Heavy Commercial Vehicle
- 9.2. Market Analysis, Insights and Forecast - by Types
- 9.2.1. Forward Collision Warning
- 9.2.2. Dynamic Brake Support
- 9.2.3. Crash Imminent Braking
- 9.1. Market Analysis, Insights and Forecast - by Application
- 10. Middle East & Africa Low Speed AEB System Analysis, Insights and Forecast, 2020-2032
- 10.1. Market Analysis, Insights and Forecast - by Application
- 10.1.1. Passenger Cars
- 10.1.2. Light Commercial Vehicle
- 10.1.3. Heavy Commercial Vehicle
- 10.2. Market Analysis, Insights and Forecast - by Types
- 10.2.1. Forward Collision Warning
- 10.2.2. Dynamic Brake Support
- 10.2.3. Crash Imminent Braking
- 10.1. Market Analysis, Insights and Forecast - by Application
- 11. Asia Pacific Low Speed AEB System Analysis, Insights and Forecast, 2020-2032
- 11.1. Market Analysis, Insights and Forecast - by Application
- 11.1.1. Passenger Cars
- 11.1.2. Light Commercial Vehicle
- 11.1.3. Heavy Commercial Vehicle
- 11.2. Market Analysis, Insights and Forecast - by Types
- 11.2.1. Forward Collision Warning
- 11.2.2. Dynamic Brake Support
- 11.2.3. Crash Imminent Braking
- 11.1. Market Analysis, Insights and Forecast - by Application
- 12. Competitive Analysis
- 12.1. Company Profiles
- 12.1.1 ZF TRW
- 12.1.1.1. Company Overview
- 12.1.1.2. Products
- 12.1.1.3. Company Financials
- 12.1.1.4. SWOT Analysis
- 12.1.2 Continental AG
- 12.1.2.1. Company Overview
- 12.1.2.2. Products
- 12.1.2.3. Company Financials
- 12.1.2.4. SWOT Analysis
- 12.1.3 DENSO Corporation
- 12.1.3.1. Company Overview
- 12.1.3.2. Products
- 12.1.3.3. Company Financials
- 12.1.3.4. SWOT Analysis
- 12.1.4 Tesla Motors
- 12.1.4.1. Company Overview
- 12.1.4.2. Products
- 12.1.4.3. Company Financials
- 12.1.4.4. SWOT Analysis
- 12.1.5 Robert Bosch GmbH
- 12.1.5.1. Company Overview
- 12.1.5.2. Products
- 12.1.5.3. Company Financials
- 12.1.5.4. SWOT Analysis
- 12.1.6 Delphi Automotive Plc.
- 12.1.6.1. Company Overview
- 12.1.6.2. Products
- 12.1.6.3. Company Financials
- 12.1.6.4. SWOT Analysis
- 12.1.7 Autoliv Inc.
- 12.1.7.1. Company Overview
- 12.1.7.2. Products
- 12.1.7.3. Company Financials
- 12.1.7.4. SWOT Analysis
- 12.1.8 Magna International Inc.
- 12.1.8.1. Company Overview
- 12.1.8.2. Products
- 12.1.8.3. Company Financials
- 12.1.8.4. SWOT Analysis
- 12.1.9 Mobileye NV
- 12.1.9.1. Company Overview
- 12.1.9.2. Products
- 12.1.9.3. Company Financials
- 12.1.9.4. SWOT Analysis
- 12.1.10 Volvo Car Corporation
- 12.1.10.1. Company Overview
- 12.1.10.2. Products
- 12.1.10.3. Company Financials
- 12.1.10.4. SWOT Analysis
- 12.1.11 Ford Motor
- 12.1.11.1. Company Overview
- 12.1.11.2. Products
- 12.1.11.3. Company Financials
- 12.1.11.4. SWOT Analysis
- 12.1.12 Daimler
- 12.1.12.1. Company Overview
- 12.1.12.2. Products
- 12.1.12.3. Company Financials
- 12.1.12.4. SWOT Analysis
- 12.1.13 Audi
- 12.1.13.1. Company Overview
- 12.1.13.2. Products
- 12.1.13.3. Company Financials
- 12.1.13.4. SWOT Analysis
- 12.1.14 Volkswagen
- 12.1.14.1. Company Overview
- 12.1.14.2. Products
- 12.1.14.3. Company Financials
- 12.1.14.4. SWOT Analysis
- 12.1.15 Toyota Motor
- 12.1.15.1. Company Overview
- 12.1.15.2. Products
- 12.1.15.3. Company Financials
- 12.1.15.4. SWOT Analysis
- 12.1.16 Honda Motor
- 12.1.16.1. Company Overview
- 12.1.16.2. Products
- 12.1.16.3. Company Financials
- 12.1.16.4. SWOT Analysis
- 12.1.1 ZF TRW
- 12.2. Market Entropy
- 12.2.1 Company's Key Areas Served
- 12.2.2 Recent Developments
- 12.3. Company Market Share Analysis 2025
- 12.3.1 Top 5 Companies Market Share Analysis
- 12.3.2 Top 3 Companies Market Share Analysis
- 12.4. List of Potential Customers
- 13. Research Methodology
List of Figures
- Figure 1: Global Low Speed AEB System Revenue Breakdown (million, %) by Region 2025 & 2033
- Figure 2: Global Low Speed AEB System Volume Breakdown (K, %) by Region 2025 & 2033
- Figure 3: North America Low Speed AEB System Revenue (million), by Application 2025 & 2033
- Figure 4: North America Low Speed AEB System Volume (K), by Application 2025 & 2033
- Figure 5: North America Low Speed AEB System Revenue Share (%), by Application 2025 & 2033
- Figure 6: North America Low Speed AEB System Volume Share (%), by Application 2025 & 2033
- Figure 7: North America Low Speed AEB System Revenue (million), by Types 2025 & 2033
- Figure 8: North America Low Speed AEB System Volume (K), by Types 2025 & 2033
- Figure 9: North America Low Speed AEB System Revenue Share (%), by Types 2025 & 2033
- Figure 10: North America Low Speed AEB System Volume Share (%), by Types 2025 & 2033
- Figure 11: North America Low Speed AEB System Revenue (million), by Country 2025 & 2033
- Figure 12: North America Low Speed AEB System Volume (K), by Country 2025 & 2033
- Figure 13: North America Low Speed AEB System Revenue Share (%), by Country 2025 & 2033
- Figure 14: North America Low Speed AEB System Volume Share (%), by Country 2025 & 2033
- Figure 15: South America Low Speed AEB System Revenue (million), by Application 2025 & 2033
- Figure 16: South America Low Speed AEB System Volume (K), by Application 2025 & 2033
- Figure 17: South America Low Speed AEB System Revenue Share (%), by Application 2025 & 2033
- Figure 18: South America Low Speed AEB System Volume Share (%), by Application 2025 & 2033
- Figure 19: South America Low Speed AEB System Revenue (million), by Types 2025 & 2033
- Figure 20: South America Low Speed AEB System Volume (K), by Types 2025 & 2033
- Figure 21: South America Low Speed AEB System Revenue Share (%), by Types 2025 & 2033
- Figure 22: South America Low Speed AEB System Volume Share (%), by Types 2025 & 2033
- Figure 23: South America Low Speed AEB System Revenue (million), by Country 2025 & 2033
- Figure 24: South America Low Speed AEB System Volume (K), by Country 2025 & 2033
- Figure 25: South America Low Speed AEB System Revenue Share (%), by Country 2025 & 2033
- Figure 26: South America Low Speed AEB System Volume Share (%), by Country 2025 & 2033
- Figure 27: Europe Low Speed AEB System Revenue (million), by Application 2025 & 2033
- Figure 28: Europe Low Speed AEB System Volume (K), by Application 2025 & 2033
- Figure 29: Europe Low Speed AEB System Revenue Share (%), by Application 2025 & 2033
- Figure 30: Europe Low Speed AEB System Volume Share (%), by Application 2025 & 2033
- Figure 31: Europe Low Speed AEB System Revenue (million), by Types 2025 & 2033
- Figure 32: Europe Low Speed AEB System Volume (K), by Types 2025 & 2033
- Figure 33: Europe Low Speed AEB System Revenue Share (%), by Types 2025 & 2033
- Figure 34: Europe Low Speed AEB System Volume Share (%), by Types 2025 & 2033
- Figure 35: Europe Low Speed AEB System Revenue (million), by Country 2025 & 2033
- Figure 36: Europe Low Speed AEB System Volume (K), by Country 2025 & 2033
- Figure 37: Europe Low Speed AEB System Revenue Share (%), by Country 2025 & 2033
- Figure 38: Europe Low Speed AEB System Volume Share (%), by Country 2025 & 2033
- Figure 39: Middle East & Africa Low Speed AEB System Revenue (million), by Application 2025 & 2033
- Figure 40: Middle East & Africa Low Speed AEB System Volume (K), by Application 2025 & 2033
- Figure 41: Middle East & Africa Low Speed AEB System Revenue Share (%), by Application 2025 & 2033
- Figure 42: Middle East & Africa Low Speed AEB System Volume Share (%), by Application 2025 & 2033
- Figure 43: Middle East & Africa Low Speed AEB System Revenue (million), by Types 2025 & 2033
- Figure 44: Middle East & Africa Low Speed AEB System Volume (K), by Types 2025 & 2033
- Figure 45: Middle East & Africa Low Speed AEB System Revenue Share (%), by Types 2025 & 2033
- Figure 46: Middle East & Africa Low Speed AEB System Volume Share (%), by Types 2025 & 2033
- Figure 47: Middle East & Africa Low Speed AEB System Revenue (million), by Country 2025 & 2033
- Figure 48: Middle East & Africa Low Speed AEB System Volume (K), by Country 2025 & 2033
- Figure 49: Middle East & Africa Low Speed AEB System Revenue Share (%), by Country 2025 & 2033
- Figure 50: Middle East & Africa Low Speed AEB System Volume Share (%), by Country 2025 & 2033
- Figure 51: Asia Pacific Low Speed AEB System Revenue (million), by Application 2025 & 2033
- Figure 52: Asia Pacific Low Speed AEB System Volume (K), by Application 2025 & 2033
- Figure 53: Asia Pacific Low Speed AEB System Revenue Share (%), by Application 2025 & 2033
- Figure 54: Asia Pacific Low Speed AEB System Volume Share (%), by Application 2025 & 2033
- Figure 55: Asia Pacific Low Speed AEB System Revenue (million), by Types 2025 & 2033
- Figure 56: Asia Pacific Low Speed AEB System Volume (K), by Types 2025 & 2033
- Figure 57: Asia Pacific Low Speed AEB System Revenue Share (%), by Types 2025 & 2033
- Figure 58: Asia Pacific Low Speed AEB System Volume Share (%), by Types 2025 & 2033
- Figure 59: Asia Pacific Low Speed AEB System Revenue (million), by Country 2025 & 2033
- Figure 60: Asia Pacific Low Speed AEB System Volume (K), by Country 2025 & 2033
- Figure 61: Asia Pacific Low Speed AEB System Revenue Share (%), by Country 2025 & 2033
- Figure 62: Asia Pacific Low Speed AEB System Volume Share (%), by Country 2025 & 2033
List of Tables
- Table 1: Global Low Speed AEB System Revenue million Forecast, by Application 2020 & 2033
- Table 2: Global Low Speed AEB System Volume K Forecast, by Application 2020 & 2033
- Table 3: Global Low Speed AEB System Revenue million Forecast, by Types 2020 & 2033
- Table 4: Global Low Speed AEB System Volume K Forecast, by Types 2020 & 2033
- Table 5: Global Low Speed AEB System Revenue million Forecast, by Region 2020 & 2033
- Table 6: Global Low Speed AEB System Volume K Forecast, by Region 2020 & 2033
- Table 7: Global Low Speed AEB System Revenue million Forecast, by Application 2020 & 2033
- Table 8: Global Low Speed AEB System Volume K Forecast, by Application 2020 & 2033
- Table 9: Global Low Speed AEB System Revenue million Forecast, by Types 2020 & 2033
- Table 10: Global Low Speed AEB System Volume K Forecast, by Types 2020 & 2033
- Table 11: Global Low Speed AEB System Revenue million Forecast, by Country 2020 & 2033
- Table 12: Global Low Speed AEB System Volume K Forecast, by Country 2020 & 2033
- Table 13: United States Low Speed AEB System Revenue (million) Forecast, by Application 2020 & 2033
- Table 14: United States Low Speed AEB System Volume (K) Forecast, by Application 2020 & 2033
- Table 15: Canada Low Speed AEB System Revenue (million) Forecast, by Application 2020 & 2033
- Table 16: Canada Low Speed AEB System Volume (K) Forecast, by Application 2020 & 2033
- Table 17: Mexico Low Speed AEB System Revenue (million) Forecast, by Application 2020 & 2033
- Table 18: Mexico Low Speed AEB System Volume (K) Forecast, by Application 2020 & 2033
- Table 19: Global Low Speed AEB System Revenue million Forecast, by Application 2020 & 2033
- Table 20: Global Low Speed AEB System Volume K Forecast, by Application 2020 & 2033
- Table 21: Global Low Speed AEB System Revenue million Forecast, by Types 2020 & 2033
- Table 22: Global Low Speed AEB System Volume K Forecast, by Types 2020 & 2033
- Table 23: Global Low Speed AEB System Revenue million Forecast, by Country 2020 & 2033
- Table 24: Global Low Speed AEB System Volume K Forecast, by Country 2020 & 2033
- Table 25: Brazil Low Speed AEB System Revenue (million) Forecast, by Application 2020 & 2033
- Table 26: Brazil Low Speed AEB System Volume (K) Forecast, by Application 2020 & 2033
- Table 27: Argentina Low Speed AEB System Revenue (million) Forecast, by Application 2020 & 2033
- Table 28: Argentina Low Speed AEB System Volume (K) Forecast, by Application 2020 & 2033
- Table 29: Rest of South America Low Speed AEB System Revenue (million) Forecast, by Application 2020 & 2033
- Table 30: Rest of South America Low Speed AEB System Volume (K) Forecast, by Application 2020 & 2033
- Table 31: Global Low Speed AEB System Revenue million Forecast, by Application 2020 & 2033
- Table 32: Global Low Speed AEB System Volume K Forecast, by Application 2020 & 2033
- Table 33: Global Low Speed AEB System Revenue million Forecast, by Types 2020 & 2033
- Table 34: Global Low Speed AEB System Volume K Forecast, by Types 2020 & 2033
- Table 35: Global Low Speed AEB System Revenue million Forecast, by Country 2020 & 2033
- Table 36: Global Low Speed AEB System Volume K Forecast, by Country 2020 & 2033
- Table 37: United Kingdom Low Speed AEB System Revenue (million) Forecast, by Application 2020 & 2033
- Table 38: United Kingdom Low Speed AEB System Volume (K) Forecast, by Application 2020 & 2033
- Table 39: Germany Low Speed AEB System Revenue (million) Forecast, by Application 2020 & 2033
- Table 40: Germany Low Speed AEB System Volume (K) Forecast, by Application 2020 & 2033
- Table 41: France Low Speed AEB System Revenue (million) Forecast, by Application 2020 & 2033
- Table 42: France Low Speed AEB System Volume (K) Forecast, by Application 2020 & 2033
- Table 43: Italy Low Speed AEB System Revenue (million) Forecast, by Application 2020 & 2033
- Table 44: Italy Low Speed AEB System Volume (K) Forecast, by Application 2020 & 2033
- Table 45: Spain Low Speed AEB System Revenue (million) Forecast, by Application 2020 & 2033
- Table 46: Spain Low Speed AEB System Volume (K) Forecast, by Application 2020 & 2033
- Table 47: Russia Low Speed AEB System Revenue (million) Forecast, by Application 2020 & 2033
- Table 48: Russia Low Speed AEB System Volume (K) Forecast, by Application 2020 & 2033
- Table 49: Benelux Low Speed AEB System Revenue (million) Forecast, by Application 2020 & 2033
- Table 50: Benelux Low Speed AEB System Volume (K) Forecast, by Application 2020 & 2033
- Table 51: Nordics Low Speed AEB System Revenue (million) Forecast, by Application 2020 & 2033
- Table 52: Nordics Low Speed AEB System Volume (K) Forecast, by Application 2020 & 2033
- Table 53: Rest of Europe Low Speed AEB System Revenue (million) Forecast, by Application 2020 & 2033
- Table 54: Rest of Europe Low Speed AEB System Volume (K) Forecast, by Application 2020 & 2033
- Table 55: Global Low Speed AEB System Revenue million Forecast, by Application 2020 & 2033
- Table 56: Global Low Speed AEB System Volume K Forecast, by Application 2020 & 2033
- Table 57: Global Low Speed AEB System Revenue million Forecast, by Types 2020 & 2033
- Table 58: Global Low Speed AEB System Volume K Forecast, by Types 2020 & 2033
- Table 59: Global Low Speed AEB System Revenue million Forecast, by Country 2020 & 2033
- Table 60: Global Low Speed AEB System Volume K Forecast, by Country 2020 & 2033
- Table 61: Turkey Low Speed AEB System Revenue (million) Forecast, by Application 2020 & 2033
- Table 62: Turkey Low Speed AEB System Volume (K) Forecast, by Application 2020 & 2033
- Table 63: Israel Low Speed AEB System Revenue (million) Forecast, by Application 2020 & 2033
- Table 64: Israel Low Speed AEB System Volume (K) Forecast, by Application 2020 & 2033
- Table 65: GCC Low Speed AEB System Revenue (million) Forecast, by Application 2020 & 2033
- Table 66: GCC Low Speed AEB System Volume (K) Forecast, by Application 2020 & 2033
- Table 67: North Africa Low Speed AEB System Revenue (million) Forecast, by Application 2020 & 2033
- Table 68: North Africa Low Speed AEB System Volume (K) Forecast, by Application 2020 & 2033
- Table 69: South Africa Low Speed AEB System Revenue (million) Forecast, by Application 2020 & 2033
- Table 70: South Africa Low Speed AEB System Volume (K) Forecast, by Application 2020 & 2033
- Table 71: Rest of Middle East & Africa Low Speed AEB System Revenue (million) Forecast, by Application 2020 & 2033
- Table 72: Rest of Middle East & Africa Low Speed AEB System Volume (K) Forecast, by Application 2020 & 2033
- Table 73: Global Low Speed AEB System Revenue million Forecast, by Application 2020 & 2033
- Table 74: Global Low Speed AEB System Volume K Forecast, by Application 2020 & 2033
- Table 75: Global Low Speed AEB System Revenue million Forecast, by Types 2020 & 2033
- Table 76: Global Low Speed AEB System Volume K Forecast, by Types 2020 & 2033
- Table 77: Global Low Speed AEB System Revenue million Forecast, by Country 2020 & 2033
- Table 78: Global Low Speed AEB System Volume K Forecast, by Country 2020 & 2033
- Table 79: China Low Speed AEB System Revenue (million) Forecast, by Application 2020 & 2033
- Table 80: China Low Speed AEB System Volume (K) Forecast, by Application 2020 & 2033
- Table 81: India Low Speed AEB System Revenue (million) Forecast, by Application 2020 & 2033
- Table 82: India Low Speed AEB System Volume (K) Forecast, by Application 2020 & 2033
- Table 83: Japan Low Speed AEB System Revenue (million) Forecast, by Application 2020 & 2033
- Table 84: Japan Low Speed AEB System Volume (K) Forecast, by Application 2020 & 2033
- Table 85: South Korea Low Speed AEB System Revenue (million) Forecast, by Application 2020 & 2033
- Table 86: South Korea Low Speed AEB System Volume (K) Forecast, by Application 2020 & 2033
- Table 87: ASEAN Low Speed AEB System Revenue (million) Forecast, by Application 2020 & 2033
- Table 88: ASEAN Low Speed AEB System Volume (K) Forecast, by Application 2020 & 2033
- Table 89: Oceania Low Speed AEB System Revenue (million) Forecast, by Application 2020 & 2033
- Table 90: Oceania Low Speed AEB System Volume (K) Forecast, by Application 2020 & 2033
- Table 91: Rest of Asia Pacific Low Speed AEB System Revenue (million) Forecast, by Application 2020 & 2033
- Table 92: Rest of Asia Pacific Low Speed AEB System Volume (K) Forecast, by Application 2020 & 2033
Frequently Asked Questions
1. What is the projected Compound Annual Growth Rate (CAGR) of the Low Speed AEB System?
The projected CAGR is approximately XX%.
2. Which companies are prominent players in the Low Speed AEB System?
Key companies in the market include ZF TRW, Continental AG, DENSO Corporation, Tesla Motors, Robert Bosch GmbH, Delphi Automotive Plc., Autoliv Inc., Magna International Inc., Mobileye NV, Volvo Car Corporation, Ford Motor, Daimler, Audi, Volkswagen, Toyota Motor, Honda Motor.
3. What are the main segments of the Low Speed AEB System?
The market segments include Application, Types.
4. Can you provide details about the market size?
The market size is estimated to be USD XXX million as of 2022.
5. What are some drivers contributing to market growth?
N/A
6. What are the notable trends driving market growth?
N/A
7. Are there any restraints impacting market growth?
N/A
8. Can you provide examples of recent developments in the market?
N/A
9. What pricing options are available for accessing the report?
Pricing options include single-user, multi-user, and enterprise licenses priced at USD 3350.00, USD 5025.00, and USD 6700.00 respectively.
10. Is the market size provided in terms of value or volume?
The market size is provided in terms of value, measured in million and volume, measured in K.
11. Are there any specific market keywords associated with the report?
Yes, the market keyword associated with the report is "Low Speed AEB System," which aids in identifying and referencing the specific market segment covered.
12. How do I determine which pricing option suits my needs best?
The pricing options vary based on user requirements and access needs. Individual users may opt for single-user licenses, while businesses requiring broader access may choose multi-user or enterprise licenses for cost-effective access to the report.
13. Are there any additional resources or data provided in the Low Speed AEB System report?
While the report offers comprehensive insights, it's advisable to review the specific contents or supplementary materials provided to ascertain if additional resources or data are available.
14. How can I stay updated on further developments or reports in the Low Speed AEB System?
To stay informed about further developments, trends, and reports in the Low Speed AEB System, consider subscribing to industry newsletters, following relevant companies and organizations, or regularly checking reputable industry news sources and publications.
Methodology
Step 1 - Identification of Relevant Samples Size from Population Database


Step 2 - Approaches for Defining Global Market Size (Value, Volume* & Price*)

Note*: In applicable scenarios
Step 3 - Data Sources
Primary Research
- Web Analytics
- Survey Reports
- Research Institute
- Latest Research Reports
- Opinion Leaders
Secondary Research
- Annual Reports
- White Paper
- Latest Press Release
- Industry Association
- Paid Database
- Investor Presentations

Step 4 - Data Triangulation
Involves using different sources of information in order to increase the validity of a study
These sources are likely to be stakeholders in a program - participants, other researchers, program staff, other community members, and so on.
Then we put all data in single framework & apply various statistical tools to find out the dynamic on the market.
During the analysis stage, feedback from the stakeholder groups would be compared to determine areas of agreement as well as areas of divergence