

Key Insights
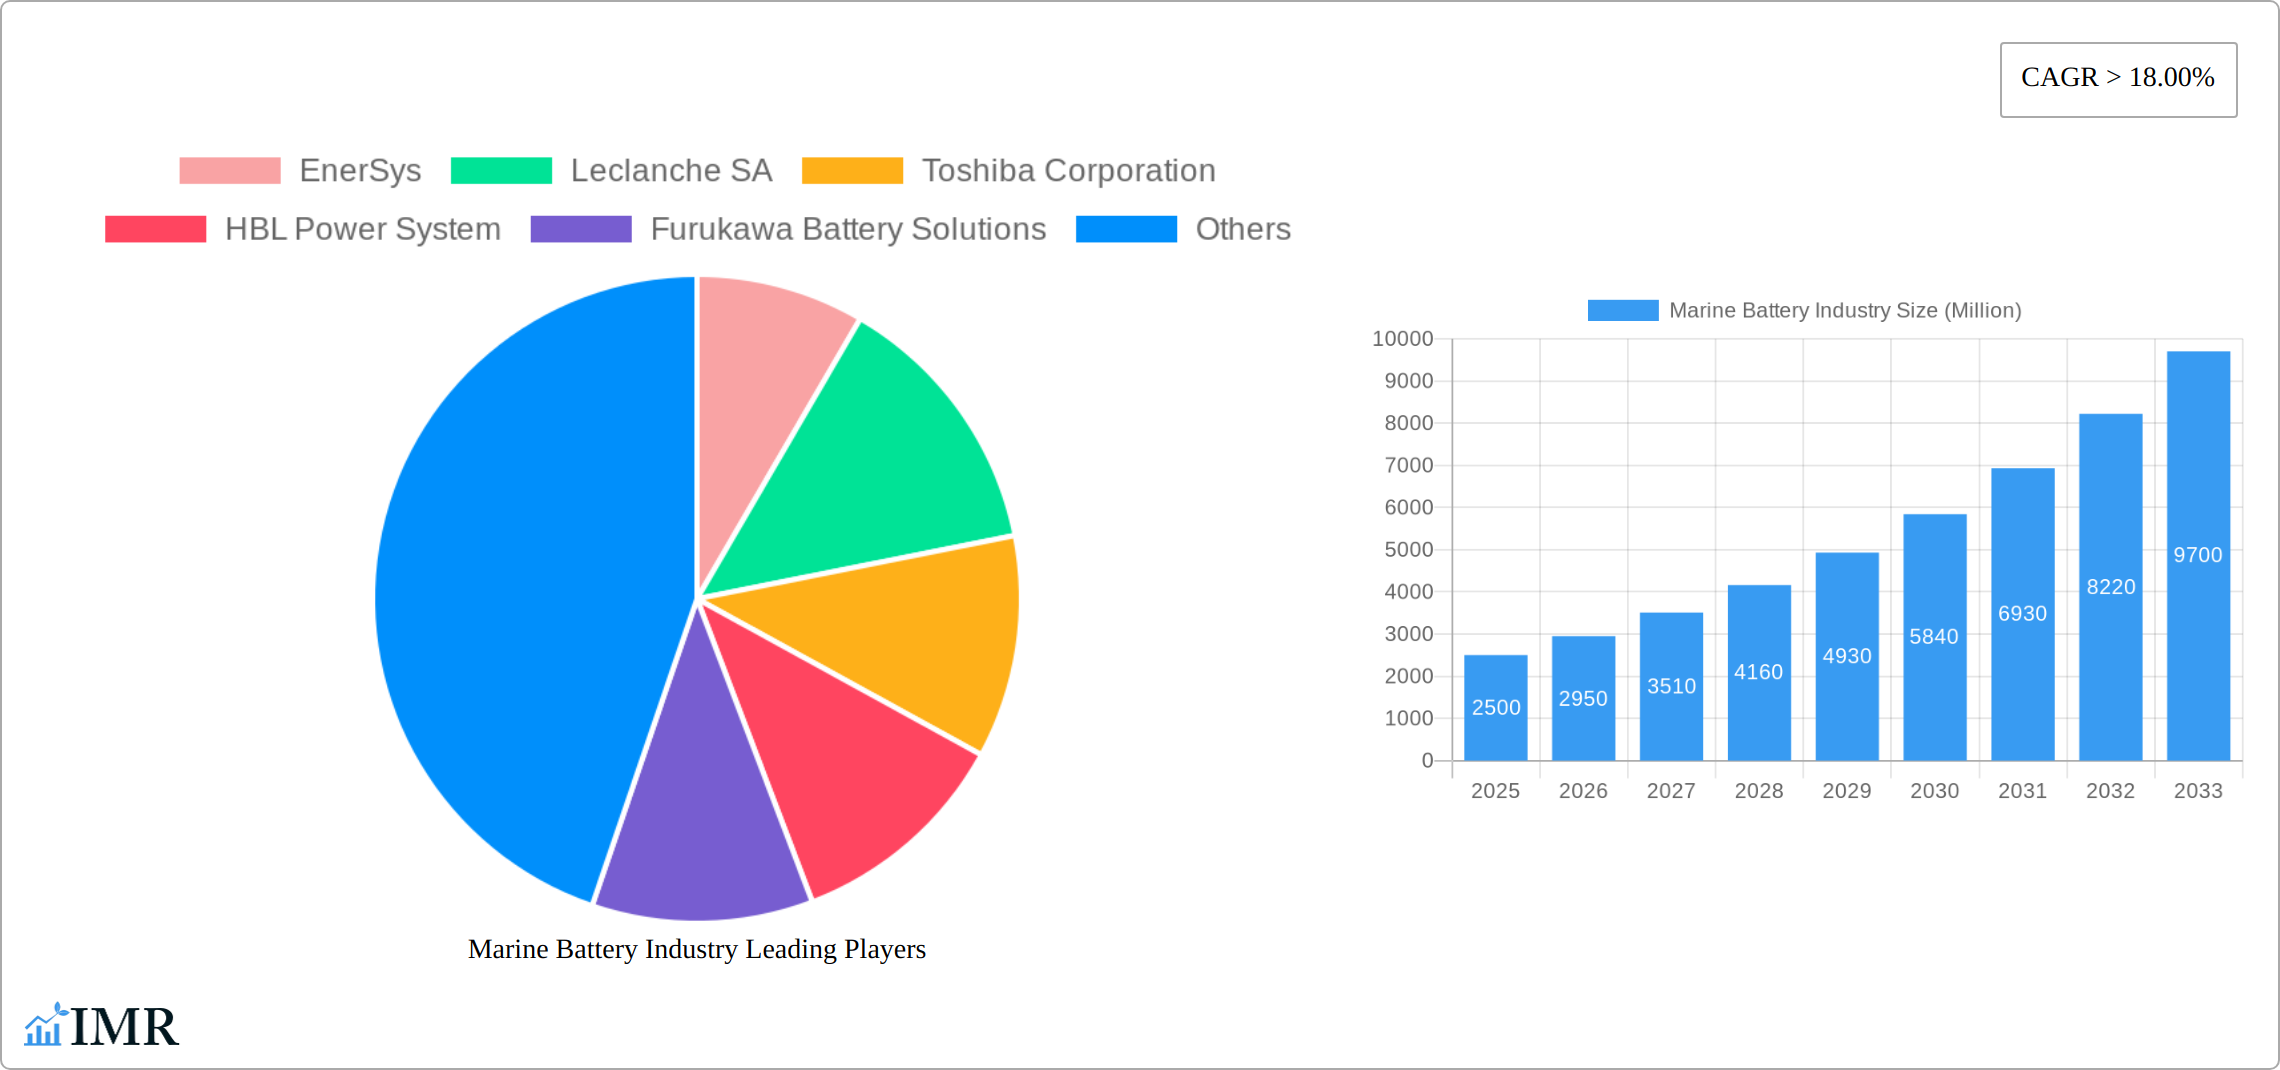
The marine battery market, projected to reach $1.54 billion by 2025, is poised for significant expansion. The sector is anticipated to witness a robust Compound Annual Growth Rate (CAGR) of 17.89% between 2025 and 2033. This growth trajectory is driven by the increasing integration of electric and hybrid propulsion systems across commercial and defense maritime applications, demanding advanced and dependable battery solutions. Furthermore, stringent environmental regulations targeting greenhouse gas emissions from vessels are a key market accelerant. Technological advancements, particularly in lithium-ion batteries offering enhanced energy density and longevity, are also fostering wider adoption. The maritime sector's embrace of automation and smart technologies further amplifies demand for reliable power sources. Geographically, North America and Asia-Pacific are expected to lead market expansion, supported by governmental initiatives promoting green shipping and substantial commercial fleets. However, substantial initial investment costs and challenges in battery safety and lifecycle management present notable market restraints.
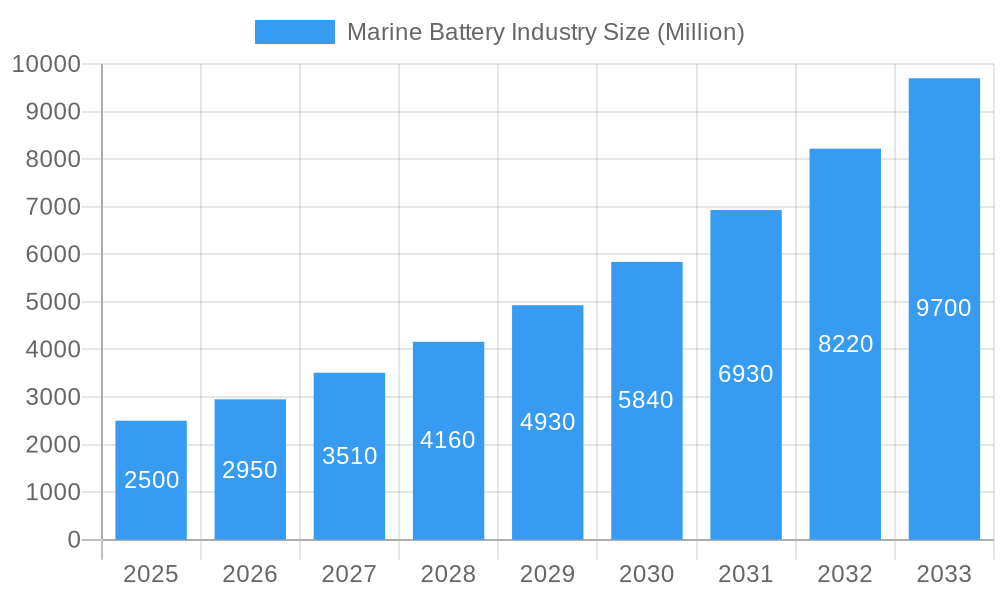
Marine Battery Industry Market Size (In Billion)
Market segmentation highlights the evolving landscape. Lithium-ion batteries are increasingly favored for their superior performance, while fuel cell technology adoption is on a steady rise. The commercial shipping segment currently leads market share, with the defense sector demonstrating considerable growth potential driven by naval electrification. Prominent industry players, including EnerSys, Leclanche SA, and Toshiba Corporation, are actively investing in research and development, product diversification, and strategic alliances to capitalize on this dynamic market. The competitive environment is expected to remain highly active, with continuous innovation and market consolidation shaping future trends. The forecast period of 2025-2033 presents substantial opportunities for investment and development within the marine battery sector, with technological breakthroughs and supportive regulatory policies anticipated to accelerate market growth.
Marine Battery Industry Company Market Share
Marine Battery Industry Market Report: 2019-2033
This comprehensive report provides a detailed analysis of the marine battery industry, encompassing market dynamics, growth trends, regional dominance, product landscape, key players, and future outlook. The study period spans from 2019 to 2033, with 2025 serving as the base and estimated year. The report leverages extensive data and insights to offer a clear understanding of this rapidly evolving sector, vital for industry professionals, investors, and strategic decision-makers. The report covers parent markets (renewable energy, transportation) and child markets (commercial shipping, defense, recreational boating) for comprehensive coverage.
Marine Battery Industry Market Dynamics & Structure
The marine battery market is characterized by a dynamic interplay of moderate concentration and a growing fragmented landscape. Leading entities such as EnerSys, Leclanche SA, and Toshiba Corporation are pivotal, but the emergence of innovative startups and specialized manufacturers contributes to the sector's diversity. A significant catalyst for this evolution is the relentless pace of technological innovation, particularly the advancements in lithium-ion battery technology, which offer superior energy density, lifespan, and safety. This is further amplified by the increasing stringency of environmental regulations worldwide, compelling the maritime industry to embrace cleaner energy sources and more sustainable propulsion methods. The market also navigates competitive pressures from rapidly developing alternative propulsion systems, including advanced fuel cells and sophisticated hybrid solutions, each vying for a significant share of the marine energy market. Concurrently, the end-user demographics are undergoing a notable shift, with a pronounced growth trend observed in both larger commercial vessels, driven by the need for efficient and eco-friendly operations, and the expanding recreational boating segment, where consumers increasingly seek sustainable and high-performance options. To capitalize on these trends, M&A activity has seen a significant uptick, with approximately [Insert Specific Number Here] strategic deals recorded between 2019 and 2024, signaling a clear trajectory towards industry consolidation and the integration of key capabilities.
- Market Concentration: Moderately concentrated, with the top 5 players projected to hold approximately [Insert Percentage Here]% market share by the end of 2024.
- Technological Innovation: The primary focus is on achieving higher energy density, extended lifespan, enhanced safety protocols, and faster charging capabilities within lithium-ion battery architectures.
- Regulatory Framework: Increasingly stringent global emission standards and international maritime organization mandates are significant drivers for the widespread adoption of advanced and cleaner battery technologies.
- Competitive Substitutes: The market faces robust competition from the continued development and adoption of fuel cells, integrated hybrid systems, and other emerging alternative propulsion technologies.
- End-User Demographics: Growth is prominently driven by the commercial shipping sector, the defense industry, and the rapidly expanding recreational boating segment, all seeking sustainable power solutions.
- M&A Trends: The industry is witnessing increasing consolidation through strategic mergers and acquisitions, with an estimated [Insert Specific Number Here] significant deals completed between 2019 and 2024.
Marine Battery Industry Growth Trends & Insights
The global marine battery market is experiencing robust growth, driven by increasing demand for eco-friendly maritime transportation and advancements in battery technology. The market size expanded from xx million units in 2019 to xx million units in 2024, exhibiting a CAGR of xx%. This growth trajectory is expected to continue, with the market projected to reach xx million units by 2033, driven by factors such as stricter emission regulations, the rising adoption of electric and hybrid vessels, and technological improvements leading to enhanced battery performance and reduced costs. Increased adoption rates across various ship types, particularly commercial and defense, further contribute to this positive growth trend. Consumer behavior is shifting towards sustainable and efficient solutions, leading to higher demand for marine batteries.
Dominant Regions, Countries, or Segments in Marine Battery Industry
The Asia-Pacific region currently stands as the dominant force in the marine battery market, propelled by substantial growth in its commercial shipping sector and proactive government initiatives aimed at fostering sustainable maritime transport. Within this powerhouse region, China and Japan are emerging as leading countries, benefiting from their robust manufacturing infrastructure, advanced technological capabilities, and strong governmental support for renewable energy solutions. The Lithium-ion battery segment is experiencing the most rapid expansion, a trend attributed to its superior energy density, extended operational lifespan, and enhanced performance characteristics when compared to legacy battery technologies such as Lead-acid and Nickel-Cadmium. The commercial shipping segment represents the largest market, characterized by significant and ongoing investments in electric and hybrid vessel technologies, particularly within the container shipping and passenger ferry sub-segments.
- Key Drivers (Asia-Pacific): Government policies championing green shipping initiatives, high economic growth rates, and the continuous expansion of maritime trade are key regional catalysts.
- Key Drivers (Lithium-ion): The segment's growth is fueled by its inherent advantages: high energy density, extended lifespan, and significantly improved safety features.
- Key Drivers (Commercial Shipping): The escalating demand for sustainable transportation solutions and substantial investments in the development and deployment of electric and hybrid vessels are critical growth factors.
Marine Battery Industry Product Landscape
The marine battery market showcases a diverse product landscape encompassing lithium-ion, lead-acid, nickel-cadmium, and fuel cell technologies. Lithium-ion batteries dominate due to their superior energy density and lifecycle, though lead-acid remains prevalent in certain applications. Continuous innovations focus on enhancing energy density, extending battery life, improving safety features (such as thermal management), and reducing costs. Unique selling propositions include customized solutions for specific vessel types, integrated energy management systems, and extended warranty options. Advancements in fast charging technologies and improved battery management systems are key areas of ongoing development.
Key Drivers, Barriers & Challenges in Marine Battery Industry
Key Drivers: The marine battery industry is propelled by a confluence of factors including increasingly stringent environmental regulations and international mandates, a surging demand for sustainable maritime transport solutions, and significant advancements in battery technology leading to improved energy density and reduced costs. Furthermore, supportive government incentives for adopting green shipping technologies play a crucial role in accelerating market growth.
Key Challenges: Despite the positive momentum, the industry grapples with substantial hurdles. The high initial investment costs associated with advanced battery systems remain a significant barrier for many operators. The limited availability of robust charging infrastructure in key ports presents logistical challenges. Moreover, persistent concerns regarding battery safety, optimal lifespan, and efficient end-of-life management necessitate continued research and development. The crucial need for sophisticated battery management systems (BMS) to optimize performance and ensure longevity is also paramount. Additionally, global supply chain disruptions and the secure availability of critical raw materials pose ongoing challenges, potentially impacting production timelines and increasing overall costs.
Emerging Opportunities in Marine Battery Industry
Significant opportunities exist in developing customized battery solutions for specific vessel types (e.g., smaller passenger ferries, larger container ships), expanding into emerging markets with high maritime activity (e.g., South America, Africa), and integrating battery systems with advanced energy management and monitoring technologies. The growth of the recreational boating sector presents another substantial opportunity.
Growth Accelerators in the Marine Battery Industry Industry
The long-term growth trajectory of the marine battery industry is poised to be significantly boosted by several key factors. These include groundbreaking technological breakthroughs in battery chemistry and advanced energy storage systems, which promise enhanced performance and cost efficiencies. Strategic partnerships between leading battery manufacturers and prominent shipbuilders will be instrumental in integrating these technologies seamlessly into vessel designs. Robust government support, manifesting through subsidies, tax incentives, and favorable regulatory frameworks for green shipping initiatives, will further accelerate adoption. Critically, the increasing global emphasis on circular economy principles, encompassing efficient battery recycling and reuse processes, will not only address environmental concerns but also contribute to a more sustainable and cost-effective supply chain, acting as a powerful engine for sustained industry expansion.
Key Players Shaping the Marine Battery Market
- EnerSys
- Leclanche SA
- Toshiba Corporation
- HBL Power System
- Furukawa Battery Solutions
- Siemens AG
- BorgWarner Inc
- Wartsila
- Saft
- Exide Technologies
Notable Milestones in Marine Battery Industry Sector
- October 2022: ABS and CATL sign a cooperation agreement to research lithium battery propulsion for next-generation vessels, focusing on safety-related technologies.
- January 2022: Vision Marine Technologies partners with Octillion Power Systems to develop a high-voltage battery pack for recreational boating.
In-Depth Marine Battery Industry Market Outlook
The marine battery market is poised for significant growth over the next decade, driven by a confluence of factors including stricter environmental regulations, advancements in battery technology, and increasing demand for sustainable maritime transport. Strategic partnerships, investments in research and development, and the expansion into new market segments will shape the industry's future. The focus on improving battery safety, lifespan, and charging infrastructure will be crucial for continued market expansion and wider adoption of electric and hybrid vessels.
Marine Battery Industry Segmentation
-
1. Battery
- 1.1. Lithium-ion
- 1.2. Nickel-Cadmium
- 1.3. Fuel Cell
- 1.4. Lead Acid
-
2. Ship Type
- 2.1. Commercial
- 2.2. Defense
Marine Battery Industry Segmentation By Geography
-
1. North America
- 1.1. United States
- 1.2. Canada
-
2. Europe
- 2.1. Germany
- 2.2. United Kingdom
- 2.3. France
- 2.4. Russia
- 2.5. Rest of Europe
-
3. Asia Pacific
- 3.1. India
- 3.2. China
- 3.3. Japan
- 3.4. South Korea
- 3.5. Rest of Asia Pacific
-
4. Latin America
- 4.1. Brazil
- 4.2. Rest of Latin America
-
5. Middle East and Africa
- 5.1. United Arab Emirates
- 5.2. Saudi Arabia
- 5.3. Israel
- 5.4. South Africa
- 5.5. Rest of Middle East and Africa
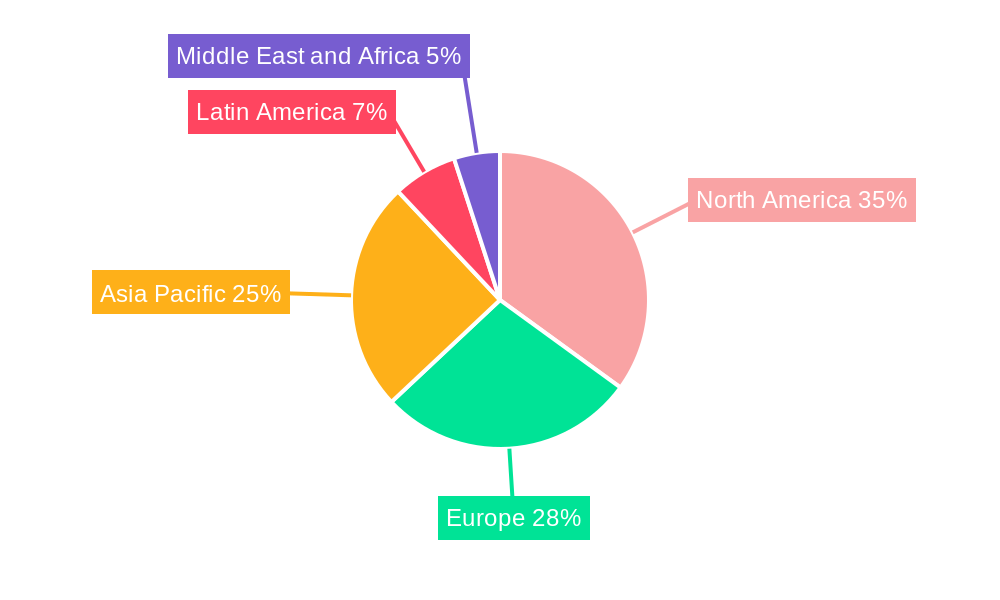
Marine Battery Industry Regional Market Share
Geographic Coverage of Marine Battery Industry
Marine Battery Industry REPORT HIGHLIGHTS
| Aspects | Details |
|---|---|
| Study Period | 2020-2034 |
| Base Year | 2025 |
| Estimated Year | 2026 |
| Forecast Period | 2026-2034 |
| Historical Period | 2020-2025 |
| Growth Rate | CAGR of 17.89% from 2020-2034 |
| Segmentation |
|
Table of Contents
- 1. Introduction
- 1.1. Research Scope
- 1.2. Market Segmentation
- 1.3. Research Objective
- 1.4. Definitions and Assumptions
- 2. Executive Summary
- 2.1. Market Snapshot
- 3. Market Dynamics
- 3.1. Market Drivers
- 3.2. Market Restrains
- 3.3. Market Trends
- 3.4. Market Opportunities
- 4. Market Factor Analysis
- 4.1. Porters Five Forces
- 4.1.1. Bargaining Power of Suppliers
- 4.1.2. Bargaining Power of Buyers
- 4.1.3. Threat of New Entrants
- 4.1.4. Threat of Substitutes
- 4.1.5. Competitive Rivalry
- 4.2. PESTEL analysis
- 4.3. BCG Analysis
- 4.3.1. Stars (High Growth, High Market Share)
- 4.3.2. Cash Cows (Low Growth, High Market Share)
- 4.3.3. Question Mark (High Growth, Low Market Share)
- 4.3.4. Dogs (Low Growth, Low Market Share)
- 4.4. Ansoff Matrix Analysis
- 4.5. Supply Chain Analysis
- 4.6. Regulatory Landscape
- 4.7. Current Market Potential and Opportunity Assessment (TAM–SAM–SOM Framework)
- 4.8. IMR Analyst Note
- 4.1. Porters Five Forces
- 5. Market Analysis, Insights and Forecast 2021-2033
- 5.1. Market Analysis, Insights and Forecast - by Battery
- 5.1.1. Lithium-ion
- 5.1.2. Nickel-Cadmium
- 5.1.3. Fuel Cell
- 5.1.4. Lead Acid
- 5.2. Market Analysis, Insights and Forecast - by Ship Type
- 5.2.1. Commercial
- 5.2.2. Defense
- 5.3. Market Analysis, Insights and Forecast - by Region
- 5.3.1. North America
- 5.3.2. Europe
- 5.3.3. Asia Pacific
- 5.3.4. Latin America
- 5.3.5. Middle East and Africa
- 5.1. Market Analysis, Insights and Forecast - by Battery
- 6. Global Marine Battery Industry Analysis, Insights and Forecast, 2021-2033
- 6.1. Market Analysis, Insights and Forecast - by Battery
- 6.1.1. Lithium-ion
- 6.1.2. Nickel-Cadmium
- 6.1.3. Fuel Cell
- 6.1.4. Lead Acid
- 6.2. Market Analysis, Insights and Forecast - by Ship Type
- 6.2.1. Commercial
- 6.2.2. Defense
- 6.1. Market Analysis, Insights and Forecast - by Battery
- 7. North America Marine Battery Industry Analysis, Insights and Forecast, 2020-2032
- 7.1. Market Analysis, Insights and Forecast - by Battery
- 7.1.1. Lithium-ion
- 7.1.2. Nickel-Cadmium
- 7.1.3. Fuel Cell
- 7.1.4. Lead Acid
- 7.2. Market Analysis, Insights and Forecast - by Ship Type
- 7.2.1. Commercial
- 7.2.2. Defense
- 7.1. Market Analysis, Insights and Forecast - by Battery
- 8. Europe Marine Battery Industry Analysis, Insights and Forecast, 2020-2032
- 8.1. Market Analysis, Insights and Forecast - by Battery
- 8.1.1. Lithium-ion
- 8.1.2. Nickel-Cadmium
- 8.1.3. Fuel Cell
- 8.1.4. Lead Acid
- 8.2. Market Analysis, Insights and Forecast - by Ship Type
- 8.2.1. Commercial
- 8.2.2. Defense
- 8.1. Market Analysis, Insights and Forecast - by Battery
- 9. Asia Pacific Marine Battery Industry Analysis, Insights and Forecast, 2020-2032
- 9.1. Market Analysis, Insights and Forecast - by Battery
- 9.1.1. Lithium-ion
- 9.1.2. Nickel-Cadmium
- 9.1.3. Fuel Cell
- 9.1.4. Lead Acid
- 9.2. Market Analysis, Insights and Forecast - by Ship Type
- 9.2.1. Commercial
- 9.2.2. Defense
- 9.1. Market Analysis, Insights and Forecast - by Battery
- 10. Latin America Marine Battery Industry Analysis, Insights and Forecast, 2020-2032
- 10.1. Market Analysis, Insights and Forecast - by Battery
- 10.1.1. Lithium-ion
- 10.1.2. Nickel-Cadmium
- 10.1.3. Fuel Cell
- 10.1.4. Lead Acid
- 10.2. Market Analysis, Insights and Forecast - by Ship Type
- 10.2.1. Commercial
- 10.2.2. Defense
- 10.1. Market Analysis, Insights and Forecast - by Battery
- 11. Middle East and Africa Marine Battery Industry Analysis, Insights and Forecast, 2020-2032
- 11.1. Market Analysis, Insights and Forecast - by Battery
- 11.1.1. Lithium-ion
- 11.1.2. Nickel-Cadmium
- 11.1.3. Fuel Cell
- 11.1.4. Lead Acid
- 11.2. Market Analysis, Insights and Forecast - by Ship Type
- 11.2.1. Commercial
- 11.2.2. Defense
- 11.1. Market Analysis, Insights and Forecast - by Battery
- 12. Competitive Analysis
- 12.1. Company Profiles
- 12.1.1 EnerSys
- 12.1.1.1. Company Overview
- 12.1.1.2. Products
- 12.1.1.3. Company Financials
- 12.1.1.4. SWOT Analysis
- 12.1.2 Leclanche SA
- 12.1.2.1. Company Overview
- 12.1.2.2. Products
- 12.1.2.3. Company Financials
- 12.1.2.4. SWOT Analysis
- 12.1.3 Toshiba Corporation
- 12.1.3.1. Company Overview
- 12.1.3.2. Products
- 12.1.3.3. Company Financials
- 12.1.3.4. SWOT Analysis
- 12.1.4 HBL Power System
- 12.1.4.1. Company Overview
- 12.1.4.2. Products
- 12.1.4.3. Company Financials
- 12.1.4.4. SWOT Analysis
- 12.1.5 Furukawa Battery Solutions
- 12.1.5.1. Company Overview
- 12.1.5.2. Products
- 12.1.5.3. Company Financials
- 12.1.5.4. SWOT Analysis
- 12.1.6 Siemens AG
- 12.1.6.1. Company Overview
- 12.1.6.2. Products
- 12.1.6.3. Company Financials
- 12.1.6.4. SWOT Analysis
- 12.1.7 BorgWarner Inc
- 12.1.7.1. Company Overview
- 12.1.7.2. Products
- 12.1.7.3. Company Financials
- 12.1.7.4. SWOT Analysis
- 12.1.8 Wartsila
- 12.1.8.1. Company Overview
- 12.1.8.2. Products
- 12.1.8.3. Company Financials
- 12.1.8.4. SWOT Analysis
- 12.1.9 Saft
- 12.1.9.1. Company Overview
- 12.1.9.2. Products
- 12.1.9.3. Company Financials
- 12.1.9.4. SWOT Analysis
- 12.1.10 Exide Technologies
- 12.1.10.1. Company Overview
- 12.1.10.2. Products
- 12.1.10.3. Company Financials
- 12.1.10.4. SWOT Analysis
- 12.1.1 EnerSys
- 12.2. Market Entropy
- 12.2.1 Company's Key Areas Served
- 12.2.2 Recent Developments
- 12.3. Company Market Share Analysis 2025
- 12.3.1 Top 5 Companies Market Share Analysis
- 12.3.2 Top 3 Companies Market Share Analysis
- 12.4. List of Potential Customers
- 13. Research Methodology
List of Figures
- Figure 1: Global Marine Battery Industry Revenue Breakdown (billion, %) by Region 2025 & 2033
- Figure 2: North America Marine Battery Industry Revenue (billion), by Battery 2025 & 2033
- Figure 3: North America Marine Battery Industry Revenue Share (%), by Battery 2025 & 2033
- Figure 4: North America Marine Battery Industry Revenue (billion), by Ship Type 2025 & 2033
- Figure 5: North America Marine Battery Industry Revenue Share (%), by Ship Type 2025 & 2033
- Figure 6: North America Marine Battery Industry Revenue (billion), by Country 2025 & 2033
- Figure 7: North America Marine Battery Industry Revenue Share (%), by Country 2025 & 2033
- Figure 8: Europe Marine Battery Industry Revenue (billion), by Battery 2025 & 2033
- Figure 9: Europe Marine Battery Industry Revenue Share (%), by Battery 2025 & 2033
- Figure 10: Europe Marine Battery Industry Revenue (billion), by Ship Type 2025 & 2033
- Figure 11: Europe Marine Battery Industry Revenue Share (%), by Ship Type 2025 & 2033
- Figure 12: Europe Marine Battery Industry Revenue (billion), by Country 2025 & 2033
- Figure 13: Europe Marine Battery Industry Revenue Share (%), by Country 2025 & 2033
- Figure 14: Asia Pacific Marine Battery Industry Revenue (billion), by Battery 2025 & 2033
- Figure 15: Asia Pacific Marine Battery Industry Revenue Share (%), by Battery 2025 & 2033
- Figure 16: Asia Pacific Marine Battery Industry Revenue (billion), by Ship Type 2025 & 2033
- Figure 17: Asia Pacific Marine Battery Industry Revenue Share (%), by Ship Type 2025 & 2033
- Figure 18: Asia Pacific Marine Battery Industry Revenue (billion), by Country 2025 & 2033
- Figure 19: Asia Pacific Marine Battery Industry Revenue Share (%), by Country 2025 & 2033
- Figure 20: Latin America Marine Battery Industry Revenue (billion), by Battery 2025 & 2033
- Figure 21: Latin America Marine Battery Industry Revenue Share (%), by Battery 2025 & 2033
- Figure 22: Latin America Marine Battery Industry Revenue (billion), by Ship Type 2025 & 2033
- Figure 23: Latin America Marine Battery Industry Revenue Share (%), by Ship Type 2025 & 2033
- Figure 24: Latin America Marine Battery Industry Revenue (billion), by Country 2025 & 2033
- Figure 25: Latin America Marine Battery Industry Revenue Share (%), by Country 2025 & 2033
- Figure 26: Middle East and Africa Marine Battery Industry Revenue (billion), by Battery 2025 & 2033
- Figure 27: Middle East and Africa Marine Battery Industry Revenue Share (%), by Battery 2025 & 2033
- Figure 28: Middle East and Africa Marine Battery Industry Revenue (billion), by Ship Type 2025 & 2033
- Figure 29: Middle East and Africa Marine Battery Industry Revenue Share (%), by Ship Type 2025 & 2033
- Figure 30: Middle East and Africa Marine Battery Industry Revenue (billion), by Country 2025 & 2033
- Figure 31: Middle East and Africa Marine Battery Industry Revenue Share (%), by Country 2025 & 2033
List of Tables
- Table 1: Global Marine Battery Industry Revenue billion Forecast, by Battery 2020 & 2033
- Table 2: Global Marine Battery Industry Revenue billion Forecast, by Ship Type 2020 & 2033
- Table 3: Global Marine Battery Industry Revenue billion Forecast, by Region 2020 & 2033
- Table 4: Global Marine Battery Industry Revenue billion Forecast, by Battery 2020 & 2033
- Table 5: Global Marine Battery Industry Revenue billion Forecast, by Ship Type 2020 & 2033
- Table 6: Global Marine Battery Industry Revenue billion Forecast, by Country 2020 & 2033
- Table 7: United States Marine Battery Industry Revenue (billion) Forecast, by Application 2020 & 2033
- Table 8: Canada Marine Battery Industry Revenue (billion) Forecast, by Application 2020 & 2033
- Table 9: Global Marine Battery Industry Revenue billion Forecast, by Battery 2020 & 2033
- Table 10: Global Marine Battery Industry Revenue billion Forecast, by Ship Type 2020 & 2033
- Table 11: Global Marine Battery Industry Revenue billion Forecast, by Country 2020 & 2033
- Table 12: Germany Marine Battery Industry Revenue (billion) Forecast, by Application 2020 & 2033
- Table 13: United Kingdom Marine Battery Industry Revenue (billion) Forecast, by Application 2020 & 2033
- Table 14: France Marine Battery Industry Revenue (billion) Forecast, by Application 2020 & 2033
- Table 15: Russia Marine Battery Industry Revenue (billion) Forecast, by Application 2020 & 2033
- Table 16: Rest of Europe Marine Battery Industry Revenue (billion) Forecast, by Application 2020 & 2033
- Table 17: Global Marine Battery Industry Revenue billion Forecast, by Battery 2020 & 2033
- Table 18: Global Marine Battery Industry Revenue billion Forecast, by Ship Type 2020 & 2033
- Table 19: Global Marine Battery Industry Revenue billion Forecast, by Country 2020 & 2033
- Table 20: India Marine Battery Industry Revenue (billion) Forecast, by Application 2020 & 2033
- Table 21: China Marine Battery Industry Revenue (billion) Forecast, by Application 2020 & 2033
- Table 22: Japan Marine Battery Industry Revenue (billion) Forecast, by Application 2020 & 2033
- Table 23: South Korea Marine Battery Industry Revenue (billion) Forecast, by Application 2020 & 2033
- Table 24: Rest of Asia Pacific Marine Battery Industry Revenue (billion) Forecast, by Application 2020 & 2033
- Table 25: Global Marine Battery Industry Revenue billion Forecast, by Battery 2020 & 2033
- Table 26: Global Marine Battery Industry Revenue billion Forecast, by Ship Type 2020 & 2033
- Table 27: Global Marine Battery Industry Revenue billion Forecast, by Country 2020 & 2033
- Table 28: Brazil Marine Battery Industry Revenue (billion) Forecast, by Application 2020 & 2033
- Table 29: Rest of Latin America Marine Battery Industry Revenue (billion) Forecast, by Application 2020 & 2033
- Table 30: Global Marine Battery Industry Revenue billion Forecast, by Battery 2020 & 2033
- Table 31: Global Marine Battery Industry Revenue billion Forecast, by Ship Type 2020 & 2033
- Table 32: Global Marine Battery Industry Revenue billion Forecast, by Country 2020 & 2033
- Table 33: United Arab Emirates Marine Battery Industry Revenue (billion) Forecast, by Application 2020 & 2033
- Table 34: Saudi Arabia Marine Battery Industry Revenue (billion) Forecast, by Application 2020 & 2033
- Table 35: Israel Marine Battery Industry Revenue (billion) Forecast, by Application 2020 & 2033
- Table 36: South Africa Marine Battery Industry Revenue (billion) Forecast, by Application 2020 & 2033
- Table 37: Rest of Middle East and Africa Marine Battery Industry Revenue (billion) Forecast, by Application 2020 & 2033
Frequently Asked Questions
1. What is the projected Compound Annual Growth Rate (CAGR) of the Marine Battery Industry?
The projected CAGR is approximately 17.89%.
2. Which companies are prominent players in the Marine Battery Industry?
Key companies in the market include EnerSys, Leclanche SA, Toshiba Corporation, HBL Power System, Furukawa Battery Solutions, Siemens AG, BorgWarner Inc, Wartsila, Saft, Exide Technologies.
3. What are the main segments of the Marine Battery Industry?
The market segments include Battery, Ship Type.
4. Can you provide details about the market size?
The market size is estimated to be USD 1.54 billion as of 2022.
5. What are some drivers contributing to market growth?
Increasing Adoption of 2-wheelers across the Globe.
6. What are the notable trends driving market growth?
Lithium-ion Segment is Projected to Highest Growth During the Forecast Period.
7. Are there any restraints impacting market growth?
Rise in demand of Electric Vehicles.
8. Can you provide examples of recent developments in the market?
October 2022: ABS signed a cooperation agreement with Contemporary Amperex Technology Co., Limited (CATL) to work together and research lithium battery propulsion for next-generation vessels. Under the agreement, the two companies would carry out research on the technical standards for battery-powered vessels, which includes key safety-related technologies such as the charging system, power battery compartment layout, propulsion system, and fire control.
9. What pricing options are available for accessing the report?
Pricing options include single-user, multi-user, and enterprise licenses priced at USD 4750, USD 5250, and USD 8750 respectively.
10. Is the market size provided in terms of value or volume?
The market size is provided in terms of value, measured in billion.
11. Are there any specific market keywords associated with the report?
Yes, the market keyword associated with the report is "Marine Battery Industry," which aids in identifying and referencing the specific market segment covered.
12. How do I determine which pricing option suits my needs best?
The pricing options vary based on user requirements and access needs. Individual users may opt for single-user licenses, while businesses requiring broader access may choose multi-user or enterprise licenses for cost-effective access to the report.
13. Are there any additional resources or data provided in the Marine Battery Industry report?
While the report offers comprehensive insights, it's advisable to review the specific contents or supplementary materials provided to ascertain if additional resources or data are available.
14. How can I stay updated on further developments or reports in the Marine Battery Industry?
To stay informed about further developments, trends, and reports in the Marine Battery Industry, consider subscribing to industry newsletters, following relevant companies and organizations, or regularly checking reputable industry news sources and publications.
Methodology
Step 1 - Identification of Relevant Samples Size from Population Database


Step 2 - Approaches for Defining Global Market Size (Value, Volume* & Price*)

Note*: In applicable scenarios
Step 3 - Data Sources
Primary Research
- Web Analytics
- Survey Reports
- Research Institute
- Latest Research Reports
- Opinion Leaders
Secondary Research
- Annual Reports
- White Paper
- Latest Press Release
- Industry Association
- Paid Database
- Investor Presentations

Step 4 - Data Triangulation
Involves using different sources of information in order to increase the validity of a study
These sources are likely to be stakeholders in a program - participants, other researchers, program staff, other community members, and so on.
Then we put all data in single framework & apply various statistical tools to find out the dynamic on the market.
During the analysis stage, feedback from the stakeholder groups would be compared to determine areas of agreement as well as areas of divergence