

Key Insights
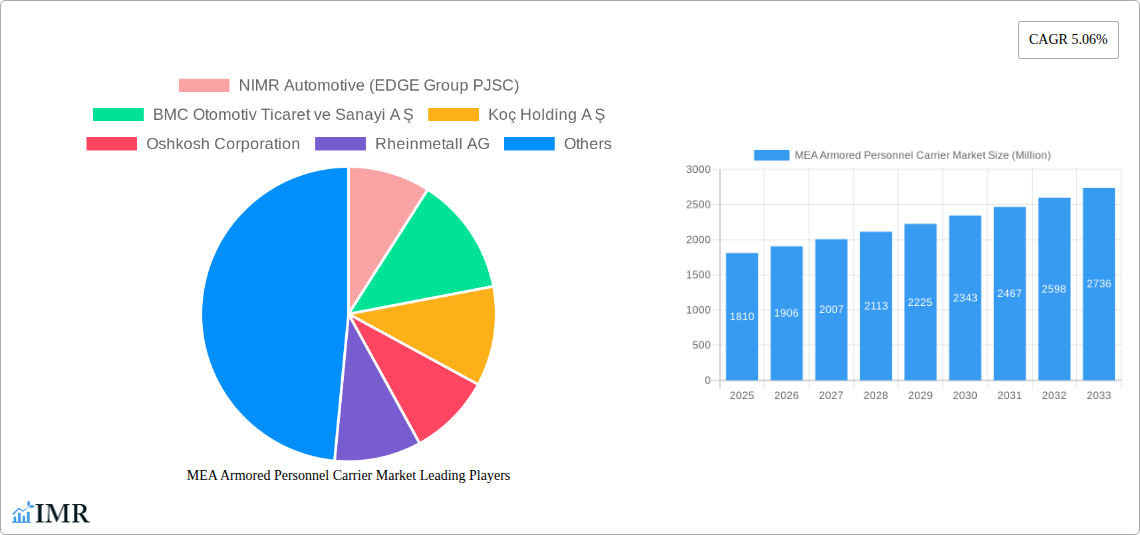
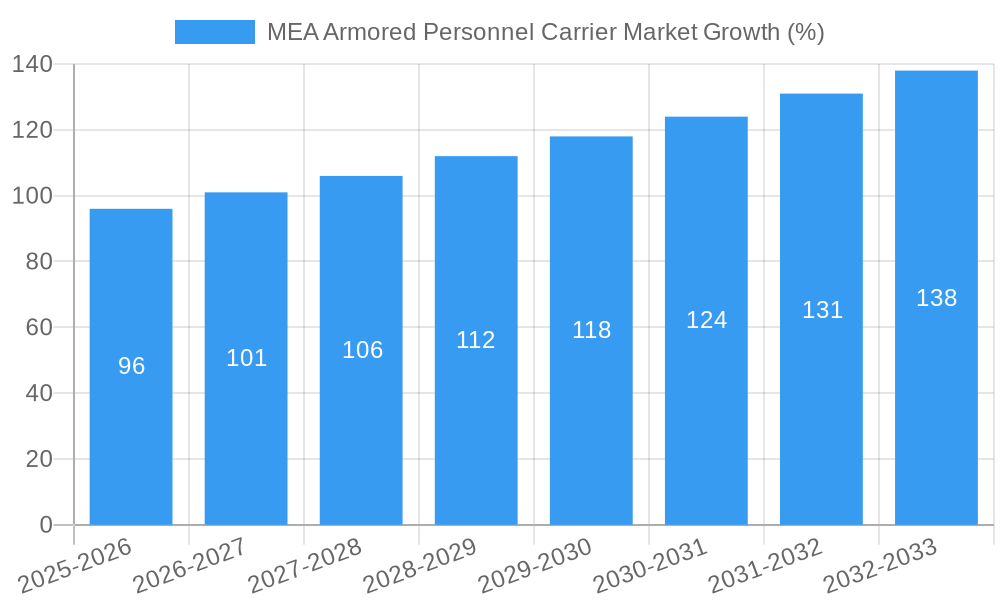
The Middle East and Africa (MEA) Armored Personnel Carrier (APC) market, valued at $1.81 billion in 2025, is projected to experience robust growth, driven by escalating geopolitical instability, modernization of armed forces, and increasing cross-border conflicts. A Compound Annual Growth Rate (CAGR) of 5.06% from 2025 to 2033 indicates a significant market expansion, reaching an estimated value exceeding $2.8 billion by 2033. Key growth drivers include substantial government investments in defense modernization programs across the region, particularly in Saudi Arabia, the UAE, and Turkey. Furthermore, the rising demand for technologically advanced APCs with enhanced protection features, such as improved armor and integrated countermeasures, fuels market growth. The increasing adoption of unmanned and remotely operated APCs is also a significant trend shaping the market landscape. However, economic fluctuations in certain MEA countries and budget constraints in some defense sectors could potentially pose challenges to sustained market growth. The market is segmented by type, with Main Battle Tanks (MBTs), APCs, Infantry Fighting Vehicles (IFVs), and other types representing distinct market segments, each experiencing varying growth rates based on specific regional needs and defense strategies. Leading players like NIMR Automotive, BMC Otomotiv, Koç Holding, Oshkosh Corporation, and Rheinmetall AG are actively competing through technological innovation and strategic partnerships to capture market share.
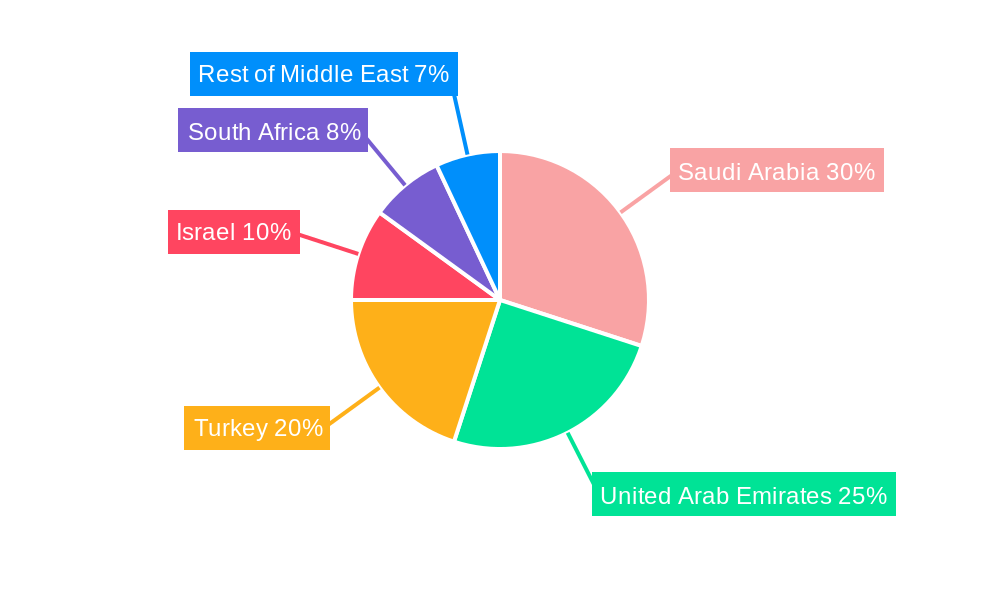
The competitive landscape is characterized by both domestic and international players, resulting in a dynamic market environment. The presence of significant domestic manufacturers, coupled with the involvement of established global defense contractors, ensures a diverse range of APC offerings. Regional factors play a crucial role in shaping the market, with countries like Saudi Arabia, the UAE, and Turkey representing major contributors to market demand due to their robust defense budgets and ongoing military modernization efforts. The South African market also holds considerable potential due to its regional influence and defense manufacturing capabilities. Future market growth hinges on several factors including evolving geopolitical situations, evolving technological advancements in APC design and functionality, and the continued investment in defense capabilities across the MEA region. Continued focus on improving vehicle survivability, mobility, and technological integration will be crucial for vendors seeking to successfully navigate the complexities of this dynamic market.
MEA Armored Personnel Carrier Market: A Comprehensive Report (2019-2033)
This comprehensive report provides an in-depth analysis of the Middle East & Africa (MEA) Armored Personnel Carrier (APC) market, encompassing market dynamics, growth trends, regional dominance, product landscape, key players, and future outlook. It serves as an invaluable resource for industry professionals, investors, and strategic decision-makers seeking a detailed understanding of this vital sector within the broader Land Systems market. The report covers the period from 2019 to 2033, with a focus on the forecast period of 2025-2033 and a base year of 2025. The market is segmented by type: Main Battle Tank (MBT), Armored Personnel Carrier (APC), Infantry Fighting Vehicle (IFV), and Other Types.
MEA Armored Personnel Carrier Market Market Dynamics & Structure
This section analyzes the MEA armored personnel carrier market's competitive landscape, technological advancements, regulatory influences, and market evolution. The market is characterized by a moderate level of concentration, with key players holding significant market shares. Technological innovation, driven by the need for enhanced protection, mobility, and firepower, is a primary growth driver. Stringent regulatory frameworks concerning the procurement and deployment of military equipment significantly impact market dynamics. The presence of substitute products, such as alternative troop transport vehicles, presents a competitive challenge. The end-user demographics, primarily comprising national armed forces and potentially internal security agencies, influence market demand. Furthermore, the report examines mergers and acquisitions (M&A) activity within the sector, analyzing deal volumes and their impact on market consolidation. Quantitative data, including specific market share percentages and M&A deal volumes, are presented throughout the analysis.
- Market Concentration: Moderately concentrated, with top 5 players holding approximately xx% market share in 2025.
- Technological Innovation: Focus on enhanced survivability, mobility, and integration of advanced technologies. Major barriers include high R&D costs and stringent testing requirements.
- Regulatory Framework: Varying regulations across MEA nations influence procurement processes and market access.
- Competitive Substitutes: Alternative troop transport solutions exert competitive pressure.
- End-User Demographics: Primarily national armed forces and internal security agencies.
- M&A Activity: xx major M&A deals observed between 2019 and 2024, with an estimated xx million USD total deal value.
MEA Armored Personnel Carrier Market Growth Trends & Insights
This section details the MEA APC market's historical and projected growth trajectory, analyzing market size evolution, adoption rates, technological disruptions, and shifts in consumer behavior (government procurement strategies). Using robust forecasting methodologies, the report projects a Compound Annual Growth Rate (CAGR) of xx% during the forecast period (2025-2033). Market penetration rates are analyzed, considering factors like defense budgets, geopolitical instability, and technological advancements. Specific metrics and data points are provided to support these insights. The analysis considers the impact of technological disruptions, such as the integration of unmanned systems and advanced sensor technologies, on market growth.
- Market Size (Million Units): 2019: xx; 2024: xx; 2025: xx (Estimated); 2033: xx (Projected).
- CAGR (2025-2033): xx%
- Market Penetration: xx% in 2025, projected to reach xx% by 2033.
Dominant Regions, Countries, or Segments in MEA Armored Personnel Carrier Market
This section pinpoints the leading regions, countries, and segments within the MEA APC market driving growth. It identifies key factors contributing to the dominance of specific regions or segments, encompassing economic policies, infrastructure development, and geopolitical factors. The analysis utilizes market share data and growth potential projections to substantiate the findings. Detailed breakdowns by country and segment (MBT, APC, IFV, Other) are provided. The APC segment is expected to maintain a significant market share, due to its versatile applications.
- Dominant Region: The Gulf Cooperation Council (GCC) countries are expected to remain dominant due to high defense spending and regional instability.
- Key Country Drivers: [Specific country examples with rationale for market dominance e.g., Saudi Arabia, UAE].
- Dominant Segment: Armored Personnel Carriers (APCs) due to their versatility and widespread use.
- Growth Drivers: Increased defense spending, regional conflicts, modernization of armed forces, and counter-terrorism operations.
MEA Armored Personnel Carrier Market Product Landscape
This section offers a concise overview of product innovations, applications, and performance metrics within the MEA APC market. It highlights unique selling propositions (USPs), technological advancements, and the key features that differentiate products in the market. The discussion includes details on improvements in armor protection, mobility, firepower, and integration of advanced technologies.
The MEA APC market shows a trend towards lighter, more mobile vehicles incorporating advanced technologies like improved situational awareness systems and enhanced communication capabilities. This allows for greater tactical flexibility and improved survivability on the battlefield. Performance metrics, such as speed, payload capacity, and range, are critical factors in determining market competitiveness.
Key Drivers, Barriers & Challenges in MEA Armored Personnel Carrier Market
This section explores the key drivers and challenges influencing the MEA APC market. Drivers include factors such as escalating defense budgets, geopolitical instability, the need for modernization of armed forces, and counter-terrorism operations. Challenges include high procurement costs, supply chain disruptions, and evolving technological demands. Specific examples are used to illustrate these aspects, quantifying the impact of supply chain disruptions or regulatory hurdles on market growth.
Key Drivers:
- Increasing defense spending in the region.
- Modernization of armed forces in various MEA countries.
- Geopolitical instability and regional conflicts.
Key Challenges:
- High procurement costs impacting affordability for some nations.
- Supply chain disruptions affecting timely delivery of components.
- Stringent regulatory approvals can cause delays in procurement processes.
Emerging Opportunities in MEA Armored Personnel Carrier Market
This section highlights promising growth areas and untapped opportunities within the MEA APC market. It emphasizes potential markets, such as specialized APCs for internal security applications or emerging technologies like autonomous and remotely controlled vehicles. The section also considers evolving consumer (government) preferences for enhanced capabilities and improved cost-effectiveness.
- Expanding markets for specialized APCs designed for specific missions.
- Adoption of advanced technologies such as AI and autonomous driving systems.
- Opportunities in the aftermarket for upgrades and maintenance services.
Growth Accelerators in the MEA Armored Personnel Carrier Market Industry
This section focuses on long-term growth catalysts, including strategic partnerships, technological breakthroughs, and successful market expansion strategies by key players. Technological advancements in materials science, power systems, and information technology will lead to more capable and efficient APCs. Strategic collaborations between governments and private sector manufacturers can accelerate innovation and market penetration.
Key Players Shaping the MEA Armored Personnel Carrier Market Market
- NIMR Automotive (EDGE Group PJSC)
- BMC Otomotiv Ticaret ve Sanayi A Ş
- Koç Holding A Ş
- Oshkosh Corporation
- Rheinmetall AG
- Denel SOC Ltd
- IAI
- Mahindra Emirates Vehicle Armouring FZ-LLC
- BAE Systems plc
- Streit Group
Notable Milestones in MEA Armored Personnel Carrier Market Sector
- 2021: [Example: Launch of a new APC model by a key player with sales figures and any notable features].
- 2022: [Example: Significant contract awarded to a supplier].
- 2023: [Example: Regulatory change impacting the market].
- 2024: [Example: A merger or acquisition involving a major player in the market].
In-Depth MEA Armored Personnel Carrier Market Market Outlook
The MEA APC market is poised for continued growth, driven by sustained defense spending, modernization efforts, and persistent regional security concerns. Strategic opportunities exist for companies that can adapt to evolving technological demands and cater to the specific needs of different MEA nations. Focus on innovation, strategic partnerships, and efficient supply chains will be crucial for success in this dynamic market.
MEA Armored Personnel Carrier Market Segmentation
- 1. Production Analysis
- 2. Consumption Analysis
- 3. Import Market Analysis (Value & Volume)
- 4. Export Market Analysis (Value & Volume)
- 5. Price Trend Analysis
MEA Armored Personnel Carrier Market Segmentation By Geography
-
1. North America
- 1.1. United States
- 1.2. Canada
- 1.3. Mexico
-
2. South America
- 2.1. Brazil
- 2.2. Argentina
- 2.3. Rest of South America
-
3. Europe
- 3.1. United Kingdom
- 3.2. Germany
- 3.3. France
- 3.4. Italy
- 3.5. Spain
- 3.6. Russia
- 3.7. Benelux
- 3.8. Nordics
- 3.9. Rest of Europe
-
4. Middle East & Africa
- 4.1. Turkey
- 4.2. Israel
- 4.3. GCC
- 4.4. North Africa
- 4.5. South Africa
- 4.6. Rest of Middle East & Africa
-
5. Asia Pacific
- 5.1. China
- 5.2. India
- 5.3. Japan
- 5.4. South Korea
- 5.5. ASEAN
- 5.6. Oceania
- 5.7. Rest of Asia Pacific
MEA Armored Personnel Carrier Market REPORT HIGHLIGHTS
| Aspects | Details |
|---|---|
| Study Period | 2019-2033 |
| Base Year | 2024 |
| Estimated Year | 2025 |
| Forecast Period | 2025-2033 |
| Historical Period | 2019-2024 |
| Growth Rate | CAGR of 5.06% from 2019-2033 |
| Segmentation |
|
Table of Contents
- 1. Introduction
- 1.1. Research Scope
- 1.2. Market Segmentation
- 1.3. Research Methodology
- 1.4. Definitions and Assumptions
- 2. Executive Summary
- 2.1. Introduction
- 3. Market Dynamics
- 3.1. Introduction
- 3.2. Market Drivers
- 3.2.1. Increase in Internet of Things (IoT) and Autonomous Systems; Rise in Demand for Military and Defense Satellite Communication Solutions
- 3.3. Market Restrains
- 3.3.1. Cybersecurity Threats to Satellite Communication; Interference in Transmission of Data
- 3.4. Market Trends
- 3.4.1. Armored Personnel Carrier (APC) Segment will Showcase Remarkable Growth During the Forecast Period
- 4. Market Factor Analysis
- 4.1. Porters Five Forces
- 4.2. Supply/Value Chain
- 4.3. PESTEL analysis
- 4.4. Market Entropy
- 4.5. Patent/Trademark Analysis
- 5. Global MEA Armored Personnel Carrier Market Analysis, Insights and Forecast, 2019-2031
- 5.1. Market Analysis, Insights and Forecast - by Production Analysis
- 5.2. Market Analysis, Insights and Forecast - by Consumption Analysis
- 5.3. Market Analysis, Insights and Forecast - by Import Market Analysis (Value & Volume)
- 5.4. Market Analysis, Insights and Forecast - by Export Market Analysis (Value & Volume)
- 5.5. Market Analysis, Insights and Forecast - by Price Trend Analysis
- 5.6. Market Analysis, Insights and Forecast - by Region
- 5.6.1. North America
- 5.6.2. South America
- 5.6.3. Europe
- 5.6.4. Middle East & Africa
- 5.6.5. Asia Pacific
- 5.1. Market Analysis, Insights and Forecast - by Production Analysis
- 6. North America MEA Armored Personnel Carrier Market Analysis, Insights and Forecast, 2019-2031
- 6.1. Market Analysis, Insights and Forecast - by Production Analysis
- 6.2. Market Analysis, Insights and Forecast - by Consumption Analysis
- 6.3. Market Analysis, Insights and Forecast - by Import Market Analysis (Value & Volume)
- 6.4. Market Analysis, Insights and Forecast - by Export Market Analysis (Value & Volume)
- 6.5. Market Analysis, Insights and Forecast - by Price Trend Analysis
- 6.1. Market Analysis, Insights and Forecast - by Production Analysis
- 7. South America MEA Armored Personnel Carrier Market Analysis, Insights and Forecast, 2019-2031
- 7.1. Market Analysis, Insights and Forecast - by Production Analysis
- 7.2. Market Analysis, Insights and Forecast - by Consumption Analysis
- 7.3. Market Analysis, Insights and Forecast - by Import Market Analysis (Value & Volume)
- 7.4. Market Analysis, Insights and Forecast - by Export Market Analysis (Value & Volume)
- 7.5. Market Analysis, Insights and Forecast - by Price Trend Analysis
- 7.1. Market Analysis, Insights and Forecast - by Production Analysis
- 8. Europe MEA Armored Personnel Carrier Market Analysis, Insights and Forecast, 2019-2031
- 8.1. Market Analysis, Insights and Forecast - by Production Analysis
- 8.2. Market Analysis, Insights and Forecast - by Consumption Analysis
- 8.3. Market Analysis, Insights and Forecast - by Import Market Analysis (Value & Volume)
- 8.4. Market Analysis, Insights and Forecast - by Export Market Analysis (Value & Volume)
- 8.5. Market Analysis, Insights and Forecast - by Price Trend Analysis
- 8.1. Market Analysis, Insights and Forecast - by Production Analysis
- 9. Middle East & Africa MEA Armored Personnel Carrier Market Analysis, Insights and Forecast, 2019-2031
- 9.1. Market Analysis, Insights and Forecast - by Production Analysis
- 9.2. Market Analysis, Insights and Forecast - by Consumption Analysis
- 9.3. Market Analysis, Insights and Forecast - by Import Market Analysis (Value & Volume)
- 9.4. Market Analysis, Insights and Forecast - by Export Market Analysis (Value & Volume)
- 9.5. Market Analysis, Insights and Forecast - by Price Trend Analysis
- 9.1. Market Analysis, Insights and Forecast - by Production Analysis
- 10. Asia Pacific MEA Armored Personnel Carrier Market Analysis, Insights and Forecast, 2019-2031
- 10.1. Market Analysis, Insights and Forecast - by Production Analysis
- 10.2. Market Analysis, Insights and Forecast - by Consumption Analysis
- 10.3. Market Analysis, Insights and Forecast - by Import Market Analysis (Value & Volume)
- 10.4. Market Analysis, Insights and Forecast - by Export Market Analysis (Value & Volume)
- 10.5. Market Analysis, Insights and Forecast - by Price Trend Analysis
- 10.1. Market Analysis, Insights and Forecast - by Production Analysis
- 11. Saudi Arabia MEA Armored Personnel Carrier Market Analysis, Insights and Forecast, 2019-2031
- 11.1. Market Analysis, Insights and Forecast - By Country/Sub-region
- 11.1.1.
- 12. United Arab Emirates MEA Armored Personnel Carrier Market Analysis, Insights and Forecast, 2019-2031
- 12.1. Market Analysis, Insights and Forecast - By Country/Sub-region
- 12.1.1.
- 13. Turkey MEA Armored Personnel Carrier Market Analysis, Insights and Forecast, 2019-2031
- 13.1. Market Analysis, Insights and Forecast - By Country/Sub-region
- 13.1.1.
- 14. Israel MEA Armored Personnel Carrier Market Analysis, Insights and Forecast, 2019-2031
- 14.1. Market Analysis, Insights and Forecast - By Country/Sub-region
- 14.1.1.
- 15. South Africa MEA Armored Personnel Carrier Market Analysis, Insights and Forecast, 2019-2031
- 15.1. Market Analysis, Insights and Forecast - By Country/Sub-region
- 15.1.1.
- 16. Rest of Middle East MEA Armored Personnel Carrier Market Analysis, Insights and Forecast, 2019-2031
- 16.1. Market Analysis, Insights and Forecast - By Country/Sub-region
- 16.1.1.
- 17. Competitive Analysis
- 17.1. Global Market Share Analysis 2024
- 17.2. Company Profiles
- 17.2.1 NIMR Automotive (EDGE Group PJSC)
- 17.2.1.1. Overview
- 17.2.1.2. Products
- 17.2.1.3. SWOT Analysis
- 17.2.1.4. Recent Developments
- 17.2.1.5. Financials (Based on Availability)
- 17.2.2 BMC Otomotiv Ticaret ve Sanayi A Ş
- 17.2.2.1. Overview
- 17.2.2.2. Products
- 17.2.2.3. SWOT Analysis
- 17.2.2.4. Recent Developments
- 17.2.2.5. Financials (Based on Availability)
- 17.2.3 Koç Holding A Ş
- 17.2.3.1. Overview
- 17.2.3.2. Products
- 17.2.3.3. SWOT Analysis
- 17.2.3.4. Recent Developments
- 17.2.3.5. Financials (Based on Availability)
- 17.2.4 Oshkosh Corporation
- 17.2.4.1. Overview
- 17.2.4.2. Products
- 17.2.4.3. SWOT Analysis
- 17.2.4.4. Recent Developments
- 17.2.4.5. Financials (Based on Availability)
- 17.2.5 Rheinmetall AG
- 17.2.5.1. Overview
- 17.2.5.2. Products
- 17.2.5.3. SWOT Analysis
- 17.2.5.4. Recent Developments
- 17.2.5.5. Financials (Based on Availability)
- 17.2.6 Denel SOC Ltd
- 17.2.6.1. Overview
- 17.2.6.2. Products
- 17.2.6.3. SWOT Analysis
- 17.2.6.4. Recent Developments
- 17.2.6.5. Financials (Based on Availability)
- 17.2.7 IAI
- 17.2.7.1. Overview
- 17.2.7.2. Products
- 17.2.7.3. SWOT Analysis
- 17.2.7.4. Recent Developments
- 17.2.7.5. Financials (Based on Availability)
- 17.2.8 Mahindra Emirates Vehicle Armouring FZ-LLC
- 17.2.8.1. Overview
- 17.2.8.2. Products
- 17.2.8.3. SWOT Analysis
- 17.2.8.4. Recent Developments
- 17.2.8.5. Financials (Based on Availability)
- 17.2.9 BAE Systems plc
- 17.2.9.1. Overview
- 17.2.9.2. Products
- 17.2.9.3. SWOT Analysis
- 17.2.9.4. Recent Developments
- 17.2.9.5. Financials (Based on Availability)
- 17.2.10 Streit Group
- 17.2.10.1. Overview
- 17.2.10.2. Products
- 17.2.10.3. SWOT Analysis
- 17.2.10.4. Recent Developments
- 17.2.10.5. Financials (Based on Availability)
- 17.2.1 NIMR Automotive (EDGE Group PJSC)
List of Figures
- Figure 1: Global MEA Armored Personnel Carrier Market Revenue Breakdown (Million, %) by Region 2024 & 2032
- Figure 2: Saudi Arabia MEA Armored Personnel Carrier Market Revenue (Million), by Country 2024 & 2032
- Figure 3: Saudi Arabia MEA Armored Personnel Carrier Market Revenue Share (%), by Country 2024 & 2032
- Figure 4: United Arab Emirates MEA Armored Personnel Carrier Market Revenue (Million), by Country 2024 & 2032
- Figure 5: United Arab Emirates MEA Armored Personnel Carrier Market Revenue Share (%), by Country 2024 & 2032
- Figure 6: Turkey MEA Armored Personnel Carrier Market Revenue (Million), by Country 2024 & 2032
- Figure 7: Turkey MEA Armored Personnel Carrier Market Revenue Share (%), by Country 2024 & 2032
- Figure 8: Israel MEA Armored Personnel Carrier Market Revenue (Million), by Country 2024 & 2032
- Figure 9: Israel MEA Armored Personnel Carrier Market Revenue Share (%), by Country 2024 & 2032
- Figure 10: South Africa MEA Armored Personnel Carrier Market Revenue (Million), by Country 2024 & 2032
- Figure 11: South Africa MEA Armored Personnel Carrier Market Revenue Share (%), by Country 2024 & 2032
- Figure 12: Rest of Middle East MEA Armored Personnel Carrier Market Revenue (Million), by Country 2024 & 2032
- Figure 13: Rest of Middle East MEA Armored Personnel Carrier Market Revenue Share (%), by Country 2024 & 2032
- Figure 14: North America MEA Armored Personnel Carrier Market Revenue (Million), by Production Analysis 2024 & 2032
- Figure 15: North America MEA Armored Personnel Carrier Market Revenue Share (%), by Production Analysis 2024 & 2032
- Figure 16: North America MEA Armored Personnel Carrier Market Revenue (Million), by Consumption Analysis 2024 & 2032
- Figure 17: North America MEA Armored Personnel Carrier Market Revenue Share (%), by Consumption Analysis 2024 & 2032
- Figure 18: North America MEA Armored Personnel Carrier Market Revenue (Million), by Import Market Analysis (Value & Volume) 2024 & 2032
- Figure 19: North America MEA Armored Personnel Carrier Market Revenue Share (%), by Import Market Analysis (Value & Volume) 2024 & 2032
- Figure 20: North America MEA Armored Personnel Carrier Market Revenue (Million), by Export Market Analysis (Value & Volume) 2024 & 2032
- Figure 21: North America MEA Armored Personnel Carrier Market Revenue Share (%), by Export Market Analysis (Value & Volume) 2024 & 2032
- Figure 22: North America MEA Armored Personnel Carrier Market Revenue (Million), by Price Trend Analysis 2024 & 2032
- Figure 23: North America MEA Armored Personnel Carrier Market Revenue Share (%), by Price Trend Analysis 2024 & 2032
- Figure 24: North America MEA Armored Personnel Carrier Market Revenue (Million), by Country 2024 & 2032
- Figure 25: North America MEA Armored Personnel Carrier Market Revenue Share (%), by Country 2024 & 2032
- Figure 26: South America MEA Armored Personnel Carrier Market Revenue (Million), by Production Analysis 2024 & 2032
- Figure 27: South America MEA Armored Personnel Carrier Market Revenue Share (%), by Production Analysis 2024 & 2032
- Figure 28: South America MEA Armored Personnel Carrier Market Revenue (Million), by Consumption Analysis 2024 & 2032
- Figure 29: South America MEA Armored Personnel Carrier Market Revenue Share (%), by Consumption Analysis 2024 & 2032
- Figure 30: South America MEA Armored Personnel Carrier Market Revenue (Million), by Import Market Analysis (Value & Volume) 2024 & 2032
- Figure 31: South America MEA Armored Personnel Carrier Market Revenue Share (%), by Import Market Analysis (Value & Volume) 2024 & 2032
- Figure 32: South America MEA Armored Personnel Carrier Market Revenue (Million), by Export Market Analysis (Value & Volume) 2024 & 2032
- Figure 33: South America MEA Armored Personnel Carrier Market Revenue Share (%), by Export Market Analysis (Value & Volume) 2024 & 2032
- Figure 34: South America MEA Armored Personnel Carrier Market Revenue (Million), by Price Trend Analysis 2024 & 2032
- Figure 35: South America MEA Armored Personnel Carrier Market Revenue Share (%), by Price Trend Analysis 2024 & 2032
- Figure 36: South America MEA Armored Personnel Carrier Market Revenue (Million), by Country 2024 & 2032
- Figure 37: South America MEA Armored Personnel Carrier Market Revenue Share (%), by Country 2024 & 2032
- Figure 38: Europe MEA Armored Personnel Carrier Market Revenue (Million), by Production Analysis 2024 & 2032
- Figure 39: Europe MEA Armored Personnel Carrier Market Revenue Share (%), by Production Analysis 2024 & 2032
- Figure 40: Europe MEA Armored Personnel Carrier Market Revenue (Million), by Consumption Analysis 2024 & 2032
- Figure 41: Europe MEA Armored Personnel Carrier Market Revenue Share (%), by Consumption Analysis 2024 & 2032
- Figure 42: Europe MEA Armored Personnel Carrier Market Revenue (Million), by Import Market Analysis (Value & Volume) 2024 & 2032
- Figure 43: Europe MEA Armored Personnel Carrier Market Revenue Share (%), by Import Market Analysis (Value & Volume) 2024 & 2032
- Figure 44: Europe MEA Armored Personnel Carrier Market Revenue (Million), by Export Market Analysis (Value & Volume) 2024 & 2032
- Figure 45: Europe MEA Armored Personnel Carrier Market Revenue Share (%), by Export Market Analysis (Value & Volume) 2024 & 2032
- Figure 46: Europe MEA Armored Personnel Carrier Market Revenue (Million), by Price Trend Analysis 2024 & 2032
- Figure 47: Europe MEA Armored Personnel Carrier Market Revenue Share (%), by Price Trend Analysis 2024 & 2032
- Figure 48: Europe MEA Armored Personnel Carrier Market Revenue (Million), by Country 2024 & 2032
- Figure 49: Europe MEA Armored Personnel Carrier Market Revenue Share (%), by Country 2024 & 2032
- Figure 50: Middle East & Africa MEA Armored Personnel Carrier Market Revenue (Million), by Production Analysis 2024 & 2032
- Figure 51: Middle East & Africa MEA Armored Personnel Carrier Market Revenue Share (%), by Production Analysis 2024 & 2032
- Figure 52: Middle East & Africa MEA Armored Personnel Carrier Market Revenue (Million), by Consumption Analysis 2024 & 2032
- Figure 53: Middle East & Africa MEA Armored Personnel Carrier Market Revenue Share (%), by Consumption Analysis 2024 & 2032
- Figure 54: Middle East & Africa MEA Armored Personnel Carrier Market Revenue (Million), by Import Market Analysis (Value & Volume) 2024 & 2032
- Figure 55: Middle East & Africa MEA Armored Personnel Carrier Market Revenue Share (%), by Import Market Analysis (Value & Volume) 2024 & 2032
- Figure 56: Middle East & Africa MEA Armored Personnel Carrier Market Revenue (Million), by Export Market Analysis (Value & Volume) 2024 & 2032
- Figure 57: Middle East & Africa MEA Armored Personnel Carrier Market Revenue Share (%), by Export Market Analysis (Value & Volume) 2024 & 2032
- Figure 58: Middle East & Africa MEA Armored Personnel Carrier Market Revenue (Million), by Price Trend Analysis 2024 & 2032
- Figure 59: Middle East & Africa MEA Armored Personnel Carrier Market Revenue Share (%), by Price Trend Analysis 2024 & 2032
- Figure 60: Middle East & Africa MEA Armored Personnel Carrier Market Revenue (Million), by Country 2024 & 2032
- Figure 61: Middle East & Africa MEA Armored Personnel Carrier Market Revenue Share (%), by Country 2024 & 2032
- Figure 62: Asia Pacific MEA Armored Personnel Carrier Market Revenue (Million), by Production Analysis 2024 & 2032
- Figure 63: Asia Pacific MEA Armored Personnel Carrier Market Revenue Share (%), by Production Analysis 2024 & 2032
- Figure 64: Asia Pacific MEA Armored Personnel Carrier Market Revenue (Million), by Consumption Analysis 2024 & 2032
- Figure 65: Asia Pacific MEA Armored Personnel Carrier Market Revenue Share (%), by Consumption Analysis 2024 & 2032
- Figure 66: Asia Pacific MEA Armored Personnel Carrier Market Revenue (Million), by Import Market Analysis (Value & Volume) 2024 & 2032
- Figure 67: Asia Pacific MEA Armored Personnel Carrier Market Revenue Share (%), by Import Market Analysis (Value & Volume) 2024 & 2032
- Figure 68: Asia Pacific MEA Armored Personnel Carrier Market Revenue (Million), by Export Market Analysis (Value & Volume) 2024 & 2032
- Figure 69: Asia Pacific MEA Armored Personnel Carrier Market Revenue Share (%), by Export Market Analysis (Value & Volume) 2024 & 2032
- Figure 70: Asia Pacific MEA Armored Personnel Carrier Market Revenue (Million), by Price Trend Analysis 2024 & 2032
- Figure 71: Asia Pacific MEA Armored Personnel Carrier Market Revenue Share (%), by Price Trend Analysis 2024 & 2032
- Figure 72: Asia Pacific MEA Armored Personnel Carrier Market Revenue (Million), by Country 2024 & 2032
- Figure 73: Asia Pacific MEA Armored Personnel Carrier Market Revenue Share (%), by Country 2024 & 2032
List of Tables
- Table 1: Global MEA Armored Personnel Carrier Market Revenue Million Forecast, by Region 2019 & 2032
- Table 2: Global MEA Armored Personnel Carrier Market Revenue Million Forecast, by Production Analysis 2019 & 2032
- Table 3: Global MEA Armored Personnel Carrier Market Revenue Million Forecast, by Consumption Analysis 2019 & 2032
- Table 4: Global MEA Armored Personnel Carrier Market Revenue Million Forecast, by Import Market Analysis (Value & Volume) 2019 & 2032
- Table 5: Global MEA Armored Personnel Carrier Market Revenue Million Forecast, by Export Market Analysis (Value & Volume) 2019 & 2032
- Table 6: Global MEA Armored Personnel Carrier Market Revenue Million Forecast, by Price Trend Analysis 2019 & 2032
- Table 7: Global MEA Armored Personnel Carrier Market Revenue Million Forecast, by Region 2019 & 2032
- Table 8: Global MEA Armored Personnel Carrier Market Revenue Million Forecast, by Country 2019 & 2032
- Table 9: MEA Armored Personnel Carrier Market Revenue (Million) Forecast, by Application 2019 & 2032
- Table 10: Global MEA Armored Personnel Carrier Market Revenue Million Forecast, by Country 2019 & 2032
- Table 11: MEA Armored Personnel Carrier Market Revenue (Million) Forecast, by Application 2019 & 2032
- Table 12: Global MEA Armored Personnel Carrier Market Revenue Million Forecast, by Country 2019 & 2032
- Table 13: MEA Armored Personnel Carrier Market Revenue (Million) Forecast, by Application 2019 & 2032
- Table 14: Global MEA Armored Personnel Carrier Market Revenue Million Forecast, by Country 2019 & 2032
- Table 15: MEA Armored Personnel Carrier Market Revenue (Million) Forecast, by Application 2019 & 2032
- Table 16: Global MEA Armored Personnel Carrier Market Revenue Million Forecast, by Country 2019 & 2032
- Table 17: MEA Armored Personnel Carrier Market Revenue (Million) Forecast, by Application 2019 & 2032
- Table 18: Global MEA Armored Personnel Carrier Market Revenue Million Forecast, by Country 2019 & 2032
- Table 19: MEA Armored Personnel Carrier Market Revenue (Million) Forecast, by Application 2019 & 2032
- Table 20: Global MEA Armored Personnel Carrier Market Revenue Million Forecast, by Production Analysis 2019 & 2032
- Table 21: Global MEA Armored Personnel Carrier Market Revenue Million Forecast, by Consumption Analysis 2019 & 2032
- Table 22: Global MEA Armored Personnel Carrier Market Revenue Million Forecast, by Import Market Analysis (Value & Volume) 2019 & 2032
- Table 23: Global MEA Armored Personnel Carrier Market Revenue Million Forecast, by Export Market Analysis (Value & Volume) 2019 & 2032
- Table 24: Global MEA Armored Personnel Carrier Market Revenue Million Forecast, by Price Trend Analysis 2019 & 2032
- Table 25: Global MEA Armored Personnel Carrier Market Revenue Million Forecast, by Country 2019 & 2032
- Table 26: United States MEA Armored Personnel Carrier Market Revenue (Million) Forecast, by Application 2019 & 2032
- Table 27: Canada MEA Armored Personnel Carrier Market Revenue (Million) Forecast, by Application 2019 & 2032
- Table 28: Mexico MEA Armored Personnel Carrier Market Revenue (Million) Forecast, by Application 2019 & 2032
- Table 29: Global MEA Armored Personnel Carrier Market Revenue Million Forecast, by Production Analysis 2019 & 2032
- Table 30: Global MEA Armored Personnel Carrier Market Revenue Million Forecast, by Consumption Analysis 2019 & 2032
- Table 31: Global MEA Armored Personnel Carrier Market Revenue Million Forecast, by Import Market Analysis (Value & Volume) 2019 & 2032
- Table 32: Global MEA Armored Personnel Carrier Market Revenue Million Forecast, by Export Market Analysis (Value & Volume) 2019 & 2032
- Table 33: Global MEA Armored Personnel Carrier Market Revenue Million Forecast, by Price Trend Analysis 2019 & 2032
- Table 34: Global MEA Armored Personnel Carrier Market Revenue Million Forecast, by Country 2019 & 2032
- Table 35: Brazil MEA Armored Personnel Carrier Market Revenue (Million) Forecast, by Application 2019 & 2032
- Table 36: Argentina MEA Armored Personnel Carrier Market Revenue (Million) Forecast, by Application 2019 & 2032
- Table 37: Rest of South America MEA Armored Personnel Carrier Market Revenue (Million) Forecast, by Application 2019 & 2032
- Table 38: Global MEA Armored Personnel Carrier Market Revenue Million Forecast, by Production Analysis 2019 & 2032
- Table 39: Global MEA Armored Personnel Carrier Market Revenue Million Forecast, by Consumption Analysis 2019 & 2032
- Table 40: Global MEA Armored Personnel Carrier Market Revenue Million Forecast, by Import Market Analysis (Value & Volume) 2019 & 2032
- Table 41: Global MEA Armored Personnel Carrier Market Revenue Million Forecast, by Export Market Analysis (Value & Volume) 2019 & 2032
- Table 42: Global MEA Armored Personnel Carrier Market Revenue Million Forecast, by Price Trend Analysis 2019 & 2032
- Table 43: Global MEA Armored Personnel Carrier Market Revenue Million Forecast, by Country 2019 & 2032
- Table 44: United Kingdom MEA Armored Personnel Carrier Market Revenue (Million) Forecast, by Application 2019 & 2032
- Table 45: Germany MEA Armored Personnel Carrier Market Revenue (Million) Forecast, by Application 2019 & 2032
- Table 46: France MEA Armored Personnel Carrier Market Revenue (Million) Forecast, by Application 2019 & 2032
- Table 47: Italy MEA Armored Personnel Carrier Market Revenue (Million) Forecast, by Application 2019 & 2032
- Table 48: Spain MEA Armored Personnel Carrier Market Revenue (Million) Forecast, by Application 2019 & 2032
- Table 49: Russia MEA Armored Personnel Carrier Market Revenue (Million) Forecast, by Application 2019 & 2032
- Table 50: Benelux MEA Armored Personnel Carrier Market Revenue (Million) Forecast, by Application 2019 & 2032
- Table 51: Nordics MEA Armored Personnel Carrier Market Revenue (Million) Forecast, by Application 2019 & 2032
- Table 52: Rest of Europe MEA Armored Personnel Carrier Market Revenue (Million) Forecast, by Application 2019 & 2032
- Table 53: Global MEA Armored Personnel Carrier Market Revenue Million Forecast, by Production Analysis 2019 & 2032
- Table 54: Global MEA Armored Personnel Carrier Market Revenue Million Forecast, by Consumption Analysis 2019 & 2032
- Table 55: Global MEA Armored Personnel Carrier Market Revenue Million Forecast, by Import Market Analysis (Value & Volume) 2019 & 2032
- Table 56: Global MEA Armored Personnel Carrier Market Revenue Million Forecast, by Export Market Analysis (Value & Volume) 2019 & 2032
- Table 57: Global MEA Armored Personnel Carrier Market Revenue Million Forecast, by Price Trend Analysis 2019 & 2032
- Table 58: Global MEA Armored Personnel Carrier Market Revenue Million Forecast, by Country 2019 & 2032
- Table 59: Turkey MEA Armored Personnel Carrier Market Revenue (Million) Forecast, by Application 2019 & 2032
- Table 60: Israel MEA Armored Personnel Carrier Market Revenue (Million) Forecast, by Application 2019 & 2032
- Table 61: GCC MEA Armored Personnel Carrier Market Revenue (Million) Forecast, by Application 2019 & 2032
- Table 62: North Africa MEA Armored Personnel Carrier Market Revenue (Million) Forecast, by Application 2019 & 2032
- Table 63: South Africa MEA Armored Personnel Carrier Market Revenue (Million) Forecast, by Application 2019 & 2032
- Table 64: Rest of Middle East & Africa MEA Armored Personnel Carrier Market Revenue (Million) Forecast, by Application 2019 & 2032
- Table 65: Global MEA Armored Personnel Carrier Market Revenue Million Forecast, by Production Analysis 2019 & 2032
- Table 66: Global MEA Armored Personnel Carrier Market Revenue Million Forecast, by Consumption Analysis 2019 & 2032
- Table 67: Global MEA Armored Personnel Carrier Market Revenue Million Forecast, by Import Market Analysis (Value & Volume) 2019 & 2032
- Table 68: Global MEA Armored Personnel Carrier Market Revenue Million Forecast, by Export Market Analysis (Value & Volume) 2019 & 2032
- Table 69: Global MEA Armored Personnel Carrier Market Revenue Million Forecast, by Price Trend Analysis 2019 & 2032
- Table 70: Global MEA Armored Personnel Carrier Market Revenue Million Forecast, by Country 2019 & 2032
- Table 71: China MEA Armored Personnel Carrier Market Revenue (Million) Forecast, by Application 2019 & 2032
- Table 72: India MEA Armored Personnel Carrier Market Revenue (Million) Forecast, by Application 2019 & 2032
- Table 73: Japan MEA Armored Personnel Carrier Market Revenue (Million) Forecast, by Application 2019 & 2032
- Table 74: South Korea MEA Armored Personnel Carrier Market Revenue (Million) Forecast, by Application 2019 & 2032
- Table 75: ASEAN MEA Armored Personnel Carrier Market Revenue (Million) Forecast, by Application 2019 & 2032
- Table 76: Oceania MEA Armored Personnel Carrier Market Revenue (Million) Forecast, by Application 2019 & 2032
- Table 77: Rest of Asia Pacific MEA Armored Personnel Carrier Market Revenue (Million) Forecast, by Application 2019 & 2032
Frequently Asked Questions
1. What is the projected Compound Annual Growth Rate (CAGR) of the MEA Armored Personnel Carrier Market?
The projected CAGR is approximately 5.06%.
2. Which companies are prominent players in the MEA Armored Personnel Carrier Market?
Key companies in the market include NIMR Automotive (EDGE Group PJSC), BMC Otomotiv Ticaret ve Sanayi A Ş, Koç Holding A Ş, Oshkosh Corporation, Rheinmetall AG, Denel SOC Ltd, IAI, Mahindra Emirates Vehicle Armouring FZ-LLC, BAE Systems plc, Streit Group.
3. What are the main segments of the MEA Armored Personnel Carrier Market?
The market segments include Production Analysis, Consumption Analysis, Import Market Analysis (Value & Volume), Export Market Analysis (Value & Volume), Price Trend Analysis.
4. Can you provide details about the market size?
The market size is estimated to be USD 1.81 Million as of 2022.
5. What are some drivers contributing to market growth?
Increase in Internet of Things (IoT) and Autonomous Systems; Rise in Demand for Military and Defense Satellite Communication Solutions.
6. What are the notable trends driving market growth?
Armored Personnel Carrier (APC) Segment will Showcase Remarkable Growth During the Forecast Period.
7. Are there any restraints impacting market growth?
Cybersecurity Threats to Satellite Communication; Interference in Transmission of Data.
8. Can you provide examples of recent developments in the market?
N/A
9. What pricing options are available for accessing the report?
Pricing options include single-user, multi-user, and enterprise licenses priced at USD 4750, USD 5250, and USD 8750 respectively.
10. Is the market size provided in terms of value or volume?
The market size is provided in terms of value, measured in Million.
11. Are there any specific market keywords associated with the report?
Yes, the market keyword associated with the report is "MEA Armored Personnel Carrier Market," which aids in identifying and referencing the specific market segment covered.
12. How do I determine which pricing option suits my needs best?
The pricing options vary based on user requirements and access needs. Individual users may opt for single-user licenses, while businesses requiring broader access may choose multi-user or enterprise licenses for cost-effective access to the report.
13. Are there any additional resources or data provided in the MEA Armored Personnel Carrier Market report?
While the report offers comprehensive insights, it's advisable to review the specific contents or supplementary materials provided to ascertain if additional resources or data are available.
14. How can I stay updated on further developments or reports in the MEA Armored Personnel Carrier Market?
To stay informed about further developments, trends, and reports in the MEA Armored Personnel Carrier Market, consider subscribing to industry newsletters, following relevant companies and organizations, or regularly checking reputable industry news sources and publications.
Methodology
Step 1 - Identification of Relevant Samples Size from Population Database


Step 2 - Approaches for Defining Global Market Size (Value, Volume* & Price*)

Note*: In applicable scenarios
Step 3 - Data Sources
Primary Research
- Web Analytics
- Survey Reports
- Research Institute
- Latest Research Reports
- Opinion Leaders
Secondary Research
- Annual Reports
- White Paper
- Latest Press Release
- Industry Association
- Paid Database
- Investor Presentations

Step 4 - Data Triangulation
Involves using different sources of information in order to increase the validity of a study
These sources are likely to be stakeholders in a program - participants, other researchers, program staff, other community members, and so on.
Then we put all data in single framework & apply various statistical tools to find out the dynamic on the market.
During the analysis stage, feedback from the stakeholder groups would be compared to determine areas of agreement as well as areas of divergence
