

Key Insights
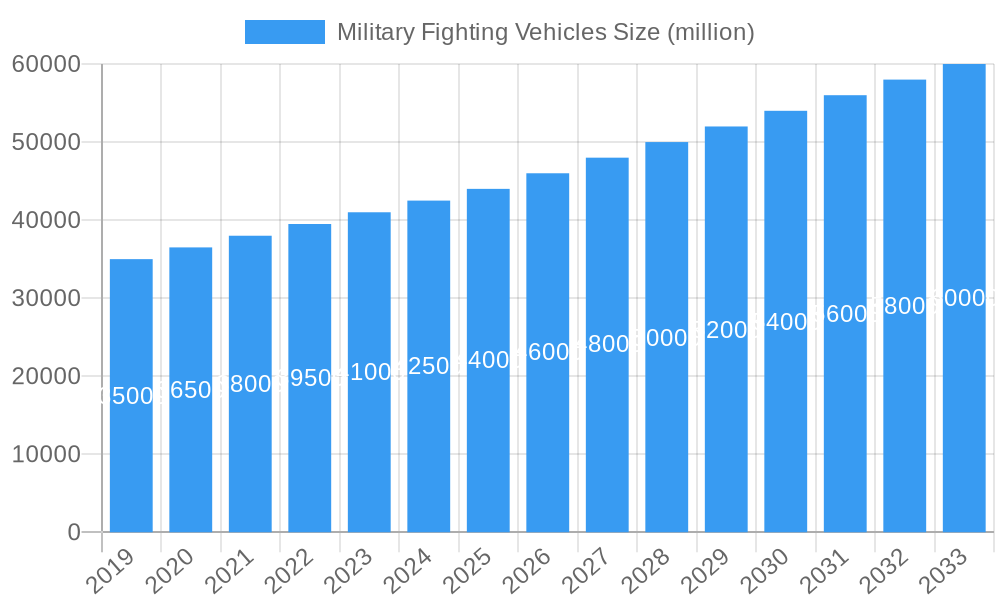
The global Military Fighting Vehicles market is projected for substantial growth, expected to reach USD 51.6 billion by 2025, driven by a Compound Annual Growth Rate (CAGR) of 3.3%. This expansion is propelled by rising geopolitical complexities, increased global defense expenditure, and the ongoing necessity for advanced combat platforms. Key growth factors include the demand for enhanced protection, superior firepower, and improved mobility in varied operational theaters. Technological advancements in AI, autonomous systems, and advanced sensor integration are reshaping military vehicle capabilities. The evolving landscape of warfare, emphasizing asymmetric threats and urban combat, further necessitates versatile and survivable vehicle designs.
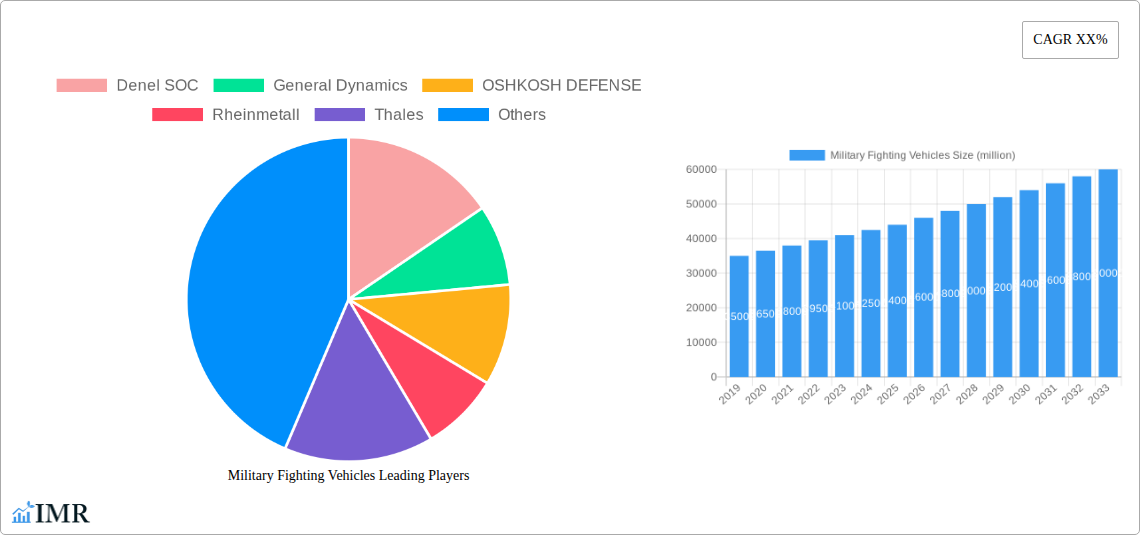
Military Fighting Vehicles Market Size (In Billion)
Market segmentation reveals a strong focus on Tanks and Fighting Vehicles and Armored Personnel Carriers (APCs), crucial for modern military operations in both Homeland Security and Military War applications. Leading companies like General Dynamics, BAE Systems, and Rheinmetall are investing in R&D for next-generation vehicles. However, significant market restraints include the high cost of R&D and procurement, lengthy regulatory approvals, and intricate global supply chains. Despite these challenges, persistent global security concerns and the drive for military modernization ensure a positive growth outlook for the Military Fighting Vehicles market.
Military Fighting Vehicles Company Market Share
Military Fighting Vehicles Market: Comprehensive Analysis and Future Outlook (2019–2033)
This in-depth market research report provides a definitive analysis of the global Military Fighting Vehicles market, encompassing historical trends, current dynamics, and future projections. Covering the period from 2019 to 2033, with a base year of 2025, this report offers unparalleled insights into market size, segmentation, competitive landscape, and growth drivers. Designed for defense manufacturers, government procurement agencies, technology providers, and investors, this report equips you with the strategic intelligence needed to navigate this evolving sector.
Military Fighting Vehicles Market Dynamics & Structure
The Military Fighting Vehicles market is characterized by a moderately concentrated structure, driven by significant R&D investments and the stringent regulatory requirements inherent in defense procurement. Technological innovation remains a primary driver, with advancements in sensor fusion, artificial intelligence, advanced materials, and unmanned systems constantly reshaping battlefield capabilities. Nations are increasingly prioritizing modernized fleets to counter evolving threats, leading to sustained demand for advanced combat platforms. Regulatory frameworks, including national defense policies, international arms control treaties, and interoperability standards, profoundly influence market access and product development. Competitive product substitutes, while limited in the direct military fighting vehicle segment, can emerge from advancements in unmanned aerial vehicles (UAVs) and specialized support systems that augment or partially replace traditional armored platforms. End-user demographics are primarily government military and homeland security agencies. Mergers and acquisitions (M&A) trends reflect strategic consolidations aimed at achieving economies of scale, acquiring specialized technologies, and expanding market reach. For instance, recent years have seen strategic acquisitions focused on enhancing electronic warfare capabilities and unmanned system integration.
- Market Concentration: Moderate to High, with a few key global players dominating significant market share.
- Technological Innovation Drivers: AI integration, advanced optics, active protection systems, modular design, electrification, and autonomous capabilities.
- Regulatory Frameworks: National defense budgets, export control regimes, NATO STANAGs, and procurement modernization initiatives.
- Competitive Product Substitutes: Advanced UAVs for reconnaissance and strike, sophisticated electronic warfare systems, and advanced missile technologies.
- End-User Demographics: National Armed Forces, Homeland Security agencies, and paramilitary organizations.
- M&A Trends: Focus on consolidating specialized technologies, expanding global footprints, and vertical integration of supply chains. Recent deal volumes indicate increased strategic partnerships to share R&D costs and market access.
Military Fighting Vehicles Growth Trends & Insights
The global Military Fighting Vehicles market is projected for robust growth, driven by escalating geopolitical tensions and the continuous need for national defense modernization. The market size evolution from 2019–2024 demonstrated a steady upward trajectory, and this trend is anticipated to accelerate through the forecast period of 2025–2033. Adoption rates of next-generation fighting vehicles are increasing as nations transition from legacy platforms to more capable and adaptable systems. This shift is fueled by the imperative to counter sophisticated threats, including advanced conventional weapons, hybrid warfare tactics, and asymmetric engagements. Technological disruptions are profoundly impacting the sector, with the integration of artificial intelligence for enhanced situational awareness, autonomous operations, and intelligent targeting systems becoming paramount. Furthermore, the development of lighter, more survivable platforms utilizing advanced composite materials and active protection systems is transforming vehicle design. Consumer behavior shifts, within the context of defense procurement, are characterized by a growing demand for multi-role capabilities, reduced logistical footprints, enhanced crew survivability, and greater interoperability across allied forces. Governments are increasingly emphasizing lifecycle cost reduction through modular designs and integrated sustainment strategies. The market penetration of advanced technologies like remote weapon stations and advanced networking capabilities is also on the rise. The Compound Annual Growth Rate (CAGR) for the Military Fighting Vehicles market is estimated to be approximately 4.5% over the forecast period, reflecting sustained demand for upgrades and new platform acquisitions. For example, the widespread adoption of modern Armored Personnel Carriers (APCs) with enhanced mine-blast protection and advanced anti-tank guided missile (ATGM) capabilities is a significant growth area. The emphasis on networked warfare and the integration of these vehicles into broader combat systems further drives their adoption. Investments in domestic defense manufacturing capabilities also play a crucial role in national procurement decisions.
Dominant Regions, Countries, or Segments in Military Fighting Vehicles
The Military War application segment, particularly Tanks and Fighting Vehicles, is currently the dominant force driving growth in the global Military Fighting Vehicles market. This dominance is attributed to several critical factors that underscore the ongoing demand for heavy armored capabilities in conventional warfare scenarios. Nations worldwide are undertaking significant fleet modernization programs to maintain a strategic edge and deter potential adversaries. The ongoing geopolitical landscape, marked by increased regional instability and the resurgence of peer-to-peer competition, necessitates robust land-based combat power. This translates directly into substantial procurement and upgrade cycles for main battle tanks (MBTs), infantry fighting vehicles (IFVs), and self-propelled artillery. Countries with large land armies and significant territorial defense concerns are the primary consumers, leading to concentrated demand in specific geographical regions.
- Dominant Segment Drivers (Military War - Tanks and Fighting Vehicles):
- Geopolitical Tensions: Heightened security concerns and ongoing regional conflicts necessitate advanced armored capabilities for deterrence and defense.
- Fleet Modernization: A global trend of upgrading or replacing aging tank and IFV fleets with state-of-the-art platforms featuring enhanced firepower, survivability, and mobility.
- Technological Advancements: Integration of new technologies such as advanced composite armor, active protection systems, improved fire control, and enhanced situational awareness suites.
- Deterrence Strategy: The presence of formidable armored forces remains a key component of national defense and deterrence strategies.
- Emerging Threats: The need to counter sophisticated anti-tank weaponry and evolving battlefield tactics drives the demand for more resilient and lethal platforms.
The United States remains a pivotal country in this segment, with substantial defense budgets allocated to its land forces, including ongoing upgrades and procurements of Abrams tanks and Bradley Fighting Vehicles. European nations are also heavily investing in their armored capabilities, with countries like Germany, France, and the United Kingdom spearheading the development and deployment of next-generation platforms. The Asia-Pacific region, particularly China and India, is also witnessing significant expansion and modernization of its tank and fighting vehicle fleets. This sustained demand within the Military War application for Tanks and Fighting Vehicles solidifies its position as the leading segment, influencing the overall market trajectory and investment patterns. The growth potential in this segment is substantial, driven by ongoing modernization efforts and the persistent need for battlefield dominance.
Military Fighting Vehicles Product Landscape
The Military Fighting Vehicles product landscape is defined by continuous innovation aimed at enhancing lethality, survivability, and operational effectiveness. Key product innovations include the integration of advanced composite armor for improved protection-to-weight ratios, sophisticated active protection systems (APS) capable of intercepting incoming threats, and next-generation fire control systems leveraging artificial intelligence for faster and more accurate target engagement. Modular design philosophies are increasingly adopted, allowing for easier upgrades, mission-specific configurations, and reduced lifecycle costs. Unique selling propositions often revolve around enhanced situational awareness through 360-degree camera systems and integrated battlefield management systems, as well as improved crew ergonomics and survivability features. Technological advancements are also focusing on hybrid-electric powertrains for reduced acoustic and thermal signatures and improved fuel efficiency, alongside the integration of unmanned turrets and remote weapon stations for increased crew safety.
Key Drivers, Barriers & Challenges in Military Fighting Vehicles
Key Drivers: The Military Fighting Vehicles market is propelled by a confluence of factors. Escalating geopolitical tensions and the rise of hybrid warfare necessitate robust and modernized land-based combat capabilities. Significant government investments in defense modernization programs worldwide, particularly in upgrading aging fleets and procuring new platforms, are a primary driver. Technological advancements, including AI integration, active protection systems, and advanced materials, are creating demand for next-generation vehicles. Furthermore, the strategic importance of maintaining a deterrent posture and ensuring national security remains a paramount driver for continuous fleet evolution.
Barriers & Challenges: Despite strong demand, the market faces significant challenges. High research and development (R&D) costs and the long procurement cycles inherent in defense contracts pose financial hurdles. Stringent regulatory frameworks and export control policies can limit market access for manufacturers. Supply chain disruptions, particularly for specialized components and rare earth materials, can impact production timelines and costs. The competitive pressure from established players and the increasing complexity of integrated systems present ongoing challenges for new entrants. Moreover, the high initial acquisition cost of advanced fighting vehicles, coupled with substantial lifecycle maintenance expenses, can strain defense budgets.
Emerging Opportunities in Military Fighting Vehicles
Emerging opportunities in the Military Fighting Vehicles sector lie in the increasing demand for unmanned and optionally manned combat platforms, offering enhanced safety and reduced crew fatigue. The integration of advanced cyber warfare capabilities and electronic countermeasures within fighting vehicles presents a significant growth area. Furthermore, the development of modular and adaptable vehicle systems that can be rapidly reconfigured for diverse mission profiles, from urban combat to expeditionary operations, is gaining traction. Untapped markets in developing nations seeking to modernize their defense forces also present considerable potential. The growing emphasis on sustainable and energy-efficient vehicle designs, including hybrid-electric powertrains, is another burgeoning opportunity.
Growth Accelerators in the Military Fighting Vehicles Industry
Long-term growth in the Military Fighting Vehicles industry is being accelerated by several key catalysts. Technological breakthroughs in areas such as autonomous navigation, advanced sensor fusion, and directed energy weapons are paving the way for entirely new classes of combat vehicles. Strategic partnerships and collaborations between defense prime contractors and technology innovators are fostering rapid development and deployment of cutting-edge solutions. Market expansion strategies, including increased export efforts and participation in international joint development programs, are further fueling growth. The persistent need to maintain technological superiority in an increasingly complex global security environment ensures sustained demand and investment in this sector.
Key Players Shaping the Military Fighting Vehicles Market
- Denel SOC
- General Dynamics
- OSHKOSH DEFENSE
- Rheinmetall
- Thales
- BAE Systems
- Navistar Defense
- NORINCO
- Renault Trucks Defense
- ST Engineering
- UralVagonZavod (UVZ)
Notable Milestones in Military Fighting Vehicles Sector
- 2019: Introduction of next-generation main battle tank (MBT) variants with enhanced protection and networked warfare capabilities.
- 2020: Significant advancements in Active Protection Systems (APS) demonstrated through live-fire trials, leading to increased adoption.
- 2021: Key merger and acquisition activities focused on consolidating armored vehicle manufacturing capabilities and specialized technology portfolios.
- 2022: Increased focus on unmanned turret technology and remotely operated weapon systems for enhanced crew survivability.
- 2023: Successful integration of Artificial Intelligence (AI) for improved target recognition and decision-making in combat vehicles.
- 2024: Development and initial deployment of modular fighting vehicles capable of rapid mission role adaptation.
In-Depth Military Fighting Vehicles Market Outlook
The future of the Military Fighting Vehicles market is characterized by sustained growth and transformative innovation. The ongoing global emphasis on defense modernization, coupled with evolving threat landscapes, will continue to drive demand for advanced armored platforms. Growth accelerators, including breakthroughs in AI, robotics, and advanced materials, will redefine combat vehicle capabilities, leading to the widespread adoption of optionally manned and autonomous systems. Strategic partnerships and the expansion into new geopolitical markets will further solidify the industry's trajectory. The market outlook is strongly positive, with significant opportunities for companies that can deliver technologically superior, cost-effective, and adaptable solutions meeting the complex needs of modern armed forces.
Military Fighting Vehicles Segmentation
-
1. Application
- 1.1. Homeland Security
- 1.2. Military War
-
2. Types
- 2.1. Tanks and Fighting Vehicles
- 2.2. Armored Personnel Carriers (APCs)
- 2.3. Others
Military Fighting Vehicles Segmentation By Geography
-
1. North America
- 1.1. United States
- 1.2. Canada
- 1.3. Mexico
-
2. South America
- 2.1. Brazil
- 2.2. Argentina
- 2.3. Rest of South America
-
3. Europe
- 3.1. United Kingdom
- 3.2. Germany
- 3.3. France
- 3.4. Italy
- 3.5. Spain
- 3.6. Russia
- 3.7. Benelux
- 3.8. Nordics
- 3.9. Rest of Europe
-
4. Middle East & Africa
- 4.1. Turkey
- 4.2. Israel
- 4.3. GCC
- 4.4. North Africa
- 4.5. South Africa
- 4.6. Rest of Middle East & Africa
-
5. Asia Pacific
- 5.1. China
- 5.2. India
- 5.3. Japan
- 5.4. South Korea
- 5.5. ASEAN
- 5.6. Oceania
- 5.7. Rest of Asia Pacific
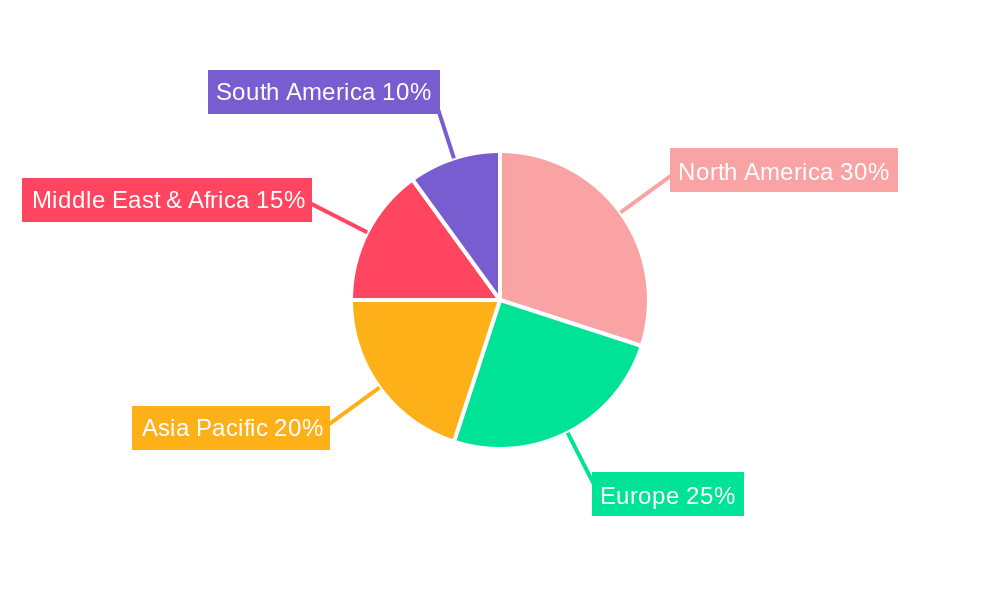
Military Fighting Vehicles Regional Market Share
Geographic Coverage of Military Fighting Vehicles
Military Fighting Vehicles REPORT HIGHLIGHTS
| Aspects | Details |
|---|---|
| Study Period | 2020-2034 |
| Base Year | 2025 |
| Estimated Year | 2026 |
| Forecast Period | 2026-2034 |
| Historical Period | 2020-2025 |
| Growth Rate | CAGR of 3.3% from 2020-2034 |
| Segmentation |
|
Table of Contents
- 1. Introduction
- 1.1. Research Scope
- 1.2. Market Segmentation
- 1.3. Research Objective
- 1.4. Definitions and Assumptions
- 2. Executive Summary
- 2.1. Market Snapshot
- 3. Market Dynamics
- 3.1. Market Drivers
- 3.2. Market Restrains
- 3.3. Market Trends
- 3.4. Market Opportunities
- 4. Market Factor Analysis
- 4.1. Porters Five Forces
- 4.1.1. Bargaining Power of Suppliers
- 4.1.2. Bargaining Power of Buyers
- 4.1.3. Threat of New Entrants
- 4.1.4. Threat of Substitutes
- 4.1.5. Competitive Rivalry
- 4.2. PESTEL analysis
- 4.3. BCG Analysis
- 4.3.1. Stars (High Growth, High Market Share)
- 4.3.2. Cash Cows (Low Growth, High Market Share)
- 4.3.3. Question Mark (High Growth, Low Market Share)
- 4.3.4. Dogs (Low Growth, Low Market Share)
- 4.4. Ansoff Matrix Analysis
- 4.5. Supply Chain Analysis
- 4.6. Regulatory Landscape
- 4.7. Current Market Potential and Opportunity Assessment (TAM–SAM–SOM Framework)
- 4.8. IMR Analyst Note
- 4.1. Porters Five Forces
- 5. Market Analysis, Insights and Forecast 2021-2033
- 5.1. Market Analysis, Insights and Forecast - by Application
- 5.1.1. Homeland Security
- 5.1.2. Military War
- 5.2. Market Analysis, Insights and Forecast - by Types
- 5.2.1. Tanks and Fighting Vehicles
- 5.2.2. Armored Personnel Carriers (APCs)
- 5.2.3. Others
- 5.3. Market Analysis, Insights and Forecast - by Region
- 5.3.1. North America
- 5.3.2. South America
- 5.3.3. Europe
- 5.3.4. Middle East & Africa
- 5.3.5. Asia Pacific
- 5.1. Market Analysis, Insights and Forecast - by Application
- 6. Global Military Fighting Vehicles Analysis, Insights and Forecast, 2021-2033
- 6.1. Market Analysis, Insights and Forecast - by Application
- 6.1.1. Homeland Security
- 6.1.2. Military War
- 6.2. Market Analysis, Insights and Forecast - by Types
- 6.2.1. Tanks and Fighting Vehicles
- 6.2.2. Armored Personnel Carriers (APCs)
- 6.2.3. Others
- 6.1. Market Analysis, Insights and Forecast - by Application
- 7. North America Military Fighting Vehicles Analysis, Insights and Forecast, 2020-2032
- 7.1. Market Analysis, Insights and Forecast - by Application
- 7.1.1. Homeland Security
- 7.1.2. Military War
- 7.2. Market Analysis, Insights and Forecast - by Types
- 7.2.1. Tanks and Fighting Vehicles
- 7.2.2. Armored Personnel Carriers (APCs)
- 7.2.3. Others
- 7.1. Market Analysis, Insights and Forecast - by Application
- 8. South America Military Fighting Vehicles Analysis, Insights and Forecast, 2020-2032
- 8.1. Market Analysis, Insights and Forecast - by Application
- 8.1.1. Homeland Security
- 8.1.2. Military War
- 8.2. Market Analysis, Insights and Forecast - by Types
- 8.2.1. Tanks and Fighting Vehicles
- 8.2.2. Armored Personnel Carriers (APCs)
- 8.2.3. Others
- 8.1. Market Analysis, Insights and Forecast - by Application
- 9. Europe Military Fighting Vehicles Analysis, Insights and Forecast, 2020-2032
- 9.1. Market Analysis, Insights and Forecast - by Application
- 9.1.1. Homeland Security
- 9.1.2. Military War
- 9.2. Market Analysis, Insights and Forecast - by Types
- 9.2.1. Tanks and Fighting Vehicles
- 9.2.2. Armored Personnel Carriers (APCs)
- 9.2.3. Others
- 9.1. Market Analysis, Insights and Forecast - by Application
- 10. Middle East & Africa Military Fighting Vehicles Analysis, Insights and Forecast, 2020-2032
- 10.1. Market Analysis, Insights and Forecast - by Application
- 10.1.1. Homeland Security
- 10.1.2. Military War
- 10.2. Market Analysis, Insights and Forecast - by Types
- 10.2.1. Tanks and Fighting Vehicles
- 10.2.2. Armored Personnel Carriers (APCs)
- 10.2.3. Others
- 10.1. Market Analysis, Insights and Forecast - by Application
- 11. Asia Pacific Military Fighting Vehicles Analysis, Insights and Forecast, 2020-2032
- 11.1. Market Analysis, Insights and Forecast - by Application
- 11.1.1. Homeland Security
- 11.1.2. Military War
- 11.2. Market Analysis, Insights and Forecast - by Types
- 11.2.1. Tanks and Fighting Vehicles
- 11.2.2. Armored Personnel Carriers (APCs)
- 11.2.3. Others
- 11.1. Market Analysis, Insights and Forecast - by Application
- 12. Competitive Analysis
- 12.1. Company Profiles
- 12.1.1 Denel SOC
- 12.1.1.1. Company Overview
- 12.1.1.2. Products
- 12.1.1.3. Company Financials
- 12.1.1.4. SWOT Analysis
- 12.1.2 General Dynamics
- 12.1.2.1. Company Overview
- 12.1.2.2. Products
- 12.1.2.3. Company Financials
- 12.1.2.4. SWOT Analysis
- 12.1.3 OSHKOSH DEFENSE
- 12.1.3.1. Company Overview
- 12.1.3.2. Products
- 12.1.3.3. Company Financials
- 12.1.3.4. SWOT Analysis
- 12.1.4 Rheinmetall
- 12.1.4.1. Company Overview
- 12.1.4.2. Products
- 12.1.4.3. Company Financials
- 12.1.4.4. SWOT Analysis
- 12.1.5 Thales
- 12.1.5.1. Company Overview
- 12.1.5.2. Products
- 12.1.5.3. Company Financials
- 12.1.5.4. SWOT Analysis
- 12.1.6 BAE Systems
- 12.1.6.1. Company Overview
- 12.1.6.2. Products
- 12.1.6.3. Company Financials
- 12.1.6.4. SWOT Analysis
- 12.1.7 Navistar Defense
- 12.1.7.1. Company Overview
- 12.1.7.2. Products
- 12.1.7.3. Company Financials
- 12.1.7.4. SWOT Analysis
- 12.1.8 NORINCO
- 12.1.8.1. Company Overview
- 12.1.8.2. Products
- 12.1.8.3. Company Financials
- 12.1.8.4. SWOT Analysis
- 12.1.9 Renault Trucks Defense
- 12.1.9.1. Company Overview
- 12.1.9.2. Products
- 12.1.9.3. Company Financials
- 12.1.9.4. SWOT Analysis
- 12.1.10 ST Engineering
- 12.1.10.1. Company Overview
- 12.1.10.2. Products
- 12.1.10.3. Company Financials
- 12.1.10.4. SWOT Analysis
- 12.1.11 UralVagonZavod (UVZ)
- 12.1.11.1. Company Overview
- 12.1.11.2. Products
- 12.1.11.3. Company Financials
- 12.1.11.4. SWOT Analysis
- 12.1.1 Denel SOC
- 12.2. Market Entropy
- 12.2.1 Company's Key Areas Served
- 12.2.2 Recent Developments
- 12.3. Company Market Share Analysis 2025
- 12.3.1 Top 5 Companies Market Share Analysis
- 12.3.2 Top 3 Companies Market Share Analysis
- 12.4. List of Potential Customers
- 13. Research Methodology
List of Figures
- Figure 1: Global Military Fighting Vehicles Revenue Breakdown (billion, %) by Region 2025 & 2033
- Figure 2: Global Military Fighting Vehicles Volume Breakdown (K, %) by Region 2025 & 2033
- Figure 3: North America Military Fighting Vehicles Revenue (billion), by Application 2025 & 2033
- Figure 4: North America Military Fighting Vehicles Volume (K), by Application 2025 & 2033
- Figure 5: North America Military Fighting Vehicles Revenue Share (%), by Application 2025 & 2033
- Figure 6: North America Military Fighting Vehicles Volume Share (%), by Application 2025 & 2033
- Figure 7: North America Military Fighting Vehicles Revenue (billion), by Types 2025 & 2033
- Figure 8: North America Military Fighting Vehicles Volume (K), by Types 2025 & 2033
- Figure 9: North America Military Fighting Vehicles Revenue Share (%), by Types 2025 & 2033
- Figure 10: North America Military Fighting Vehicles Volume Share (%), by Types 2025 & 2033
- Figure 11: North America Military Fighting Vehicles Revenue (billion), by Country 2025 & 2033
- Figure 12: North America Military Fighting Vehicles Volume (K), by Country 2025 & 2033
- Figure 13: North America Military Fighting Vehicles Revenue Share (%), by Country 2025 & 2033
- Figure 14: North America Military Fighting Vehicles Volume Share (%), by Country 2025 & 2033
- Figure 15: South America Military Fighting Vehicles Revenue (billion), by Application 2025 & 2033
- Figure 16: South America Military Fighting Vehicles Volume (K), by Application 2025 & 2033
- Figure 17: South America Military Fighting Vehicles Revenue Share (%), by Application 2025 & 2033
- Figure 18: South America Military Fighting Vehicles Volume Share (%), by Application 2025 & 2033
- Figure 19: South America Military Fighting Vehicles Revenue (billion), by Types 2025 & 2033
- Figure 20: South America Military Fighting Vehicles Volume (K), by Types 2025 & 2033
- Figure 21: South America Military Fighting Vehicles Revenue Share (%), by Types 2025 & 2033
- Figure 22: South America Military Fighting Vehicles Volume Share (%), by Types 2025 & 2033
- Figure 23: South America Military Fighting Vehicles Revenue (billion), by Country 2025 & 2033
- Figure 24: South America Military Fighting Vehicles Volume (K), by Country 2025 & 2033
- Figure 25: South America Military Fighting Vehicles Revenue Share (%), by Country 2025 & 2033
- Figure 26: South America Military Fighting Vehicles Volume Share (%), by Country 2025 & 2033
- Figure 27: Europe Military Fighting Vehicles Revenue (billion), by Application 2025 & 2033
- Figure 28: Europe Military Fighting Vehicles Volume (K), by Application 2025 & 2033
- Figure 29: Europe Military Fighting Vehicles Revenue Share (%), by Application 2025 & 2033
- Figure 30: Europe Military Fighting Vehicles Volume Share (%), by Application 2025 & 2033
- Figure 31: Europe Military Fighting Vehicles Revenue (billion), by Types 2025 & 2033
- Figure 32: Europe Military Fighting Vehicles Volume (K), by Types 2025 & 2033
- Figure 33: Europe Military Fighting Vehicles Revenue Share (%), by Types 2025 & 2033
- Figure 34: Europe Military Fighting Vehicles Volume Share (%), by Types 2025 & 2033
- Figure 35: Europe Military Fighting Vehicles Revenue (billion), by Country 2025 & 2033
- Figure 36: Europe Military Fighting Vehicles Volume (K), by Country 2025 & 2033
- Figure 37: Europe Military Fighting Vehicles Revenue Share (%), by Country 2025 & 2033
- Figure 38: Europe Military Fighting Vehicles Volume Share (%), by Country 2025 & 2033
- Figure 39: Middle East & Africa Military Fighting Vehicles Revenue (billion), by Application 2025 & 2033
- Figure 40: Middle East & Africa Military Fighting Vehicles Volume (K), by Application 2025 & 2033
- Figure 41: Middle East & Africa Military Fighting Vehicles Revenue Share (%), by Application 2025 & 2033
- Figure 42: Middle East & Africa Military Fighting Vehicles Volume Share (%), by Application 2025 & 2033
- Figure 43: Middle East & Africa Military Fighting Vehicles Revenue (billion), by Types 2025 & 2033
- Figure 44: Middle East & Africa Military Fighting Vehicles Volume (K), by Types 2025 & 2033
- Figure 45: Middle East & Africa Military Fighting Vehicles Revenue Share (%), by Types 2025 & 2033
- Figure 46: Middle East & Africa Military Fighting Vehicles Volume Share (%), by Types 2025 & 2033
- Figure 47: Middle East & Africa Military Fighting Vehicles Revenue (billion), by Country 2025 & 2033
- Figure 48: Middle East & Africa Military Fighting Vehicles Volume (K), by Country 2025 & 2033
- Figure 49: Middle East & Africa Military Fighting Vehicles Revenue Share (%), by Country 2025 & 2033
- Figure 50: Middle East & Africa Military Fighting Vehicles Volume Share (%), by Country 2025 & 2033
- Figure 51: Asia Pacific Military Fighting Vehicles Revenue (billion), by Application 2025 & 2033
- Figure 52: Asia Pacific Military Fighting Vehicles Volume (K), by Application 2025 & 2033
- Figure 53: Asia Pacific Military Fighting Vehicles Revenue Share (%), by Application 2025 & 2033
- Figure 54: Asia Pacific Military Fighting Vehicles Volume Share (%), by Application 2025 & 2033
- Figure 55: Asia Pacific Military Fighting Vehicles Revenue (billion), by Types 2025 & 2033
- Figure 56: Asia Pacific Military Fighting Vehicles Volume (K), by Types 2025 & 2033
- Figure 57: Asia Pacific Military Fighting Vehicles Revenue Share (%), by Types 2025 & 2033
- Figure 58: Asia Pacific Military Fighting Vehicles Volume Share (%), by Types 2025 & 2033
- Figure 59: Asia Pacific Military Fighting Vehicles Revenue (billion), by Country 2025 & 2033
- Figure 60: Asia Pacific Military Fighting Vehicles Volume (K), by Country 2025 & 2033
- Figure 61: Asia Pacific Military Fighting Vehicles Revenue Share (%), by Country 2025 & 2033
- Figure 62: Asia Pacific Military Fighting Vehicles Volume Share (%), by Country 2025 & 2033
List of Tables
- Table 1: Global Military Fighting Vehicles Revenue billion Forecast, by Application 2020 & 2033
- Table 2: Global Military Fighting Vehicles Volume K Forecast, by Application 2020 & 2033
- Table 3: Global Military Fighting Vehicles Revenue billion Forecast, by Types 2020 & 2033
- Table 4: Global Military Fighting Vehicles Volume K Forecast, by Types 2020 & 2033
- Table 5: Global Military Fighting Vehicles Revenue billion Forecast, by Region 2020 & 2033
- Table 6: Global Military Fighting Vehicles Volume K Forecast, by Region 2020 & 2033
- Table 7: Global Military Fighting Vehicles Revenue billion Forecast, by Application 2020 & 2033
- Table 8: Global Military Fighting Vehicles Volume K Forecast, by Application 2020 & 2033
- Table 9: Global Military Fighting Vehicles Revenue billion Forecast, by Types 2020 & 2033
- Table 10: Global Military Fighting Vehicles Volume K Forecast, by Types 2020 & 2033
- Table 11: Global Military Fighting Vehicles Revenue billion Forecast, by Country 2020 & 2033
- Table 12: Global Military Fighting Vehicles Volume K Forecast, by Country 2020 & 2033
- Table 13: United States Military Fighting Vehicles Revenue (billion) Forecast, by Application 2020 & 2033
- Table 14: United States Military Fighting Vehicles Volume (K) Forecast, by Application 2020 & 2033
- Table 15: Canada Military Fighting Vehicles Revenue (billion) Forecast, by Application 2020 & 2033
- Table 16: Canada Military Fighting Vehicles Volume (K) Forecast, by Application 2020 & 2033
- Table 17: Mexico Military Fighting Vehicles Revenue (billion) Forecast, by Application 2020 & 2033
- Table 18: Mexico Military Fighting Vehicles Volume (K) Forecast, by Application 2020 & 2033
- Table 19: Global Military Fighting Vehicles Revenue billion Forecast, by Application 2020 & 2033
- Table 20: Global Military Fighting Vehicles Volume K Forecast, by Application 2020 & 2033
- Table 21: Global Military Fighting Vehicles Revenue billion Forecast, by Types 2020 & 2033
- Table 22: Global Military Fighting Vehicles Volume K Forecast, by Types 2020 & 2033
- Table 23: Global Military Fighting Vehicles Revenue billion Forecast, by Country 2020 & 2033
- Table 24: Global Military Fighting Vehicles Volume K Forecast, by Country 2020 & 2033
- Table 25: Brazil Military Fighting Vehicles Revenue (billion) Forecast, by Application 2020 & 2033
- Table 26: Brazil Military Fighting Vehicles Volume (K) Forecast, by Application 2020 & 2033
- Table 27: Argentina Military Fighting Vehicles Revenue (billion) Forecast, by Application 2020 & 2033
- Table 28: Argentina Military Fighting Vehicles Volume (K) Forecast, by Application 2020 & 2033
- Table 29: Rest of South America Military Fighting Vehicles Revenue (billion) Forecast, by Application 2020 & 2033
- Table 30: Rest of South America Military Fighting Vehicles Volume (K) Forecast, by Application 2020 & 2033
- Table 31: Global Military Fighting Vehicles Revenue billion Forecast, by Application 2020 & 2033
- Table 32: Global Military Fighting Vehicles Volume K Forecast, by Application 2020 & 2033
- Table 33: Global Military Fighting Vehicles Revenue billion Forecast, by Types 2020 & 2033
- Table 34: Global Military Fighting Vehicles Volume K Forecast, by Types 2020 & 2033
- Table 35: Global Military Fighting Vehicles Revenue billion Forecast, by Country 2020 & 2033
- Table 36: Global Military Fighting Vehicles Volume K Forecast, by Country 2020 & 2033
- Table 37: United Kingdom Military Fighting Vehicles Revenue (billion) Forecast, by Application 2020 & 2033
- Table 38: United Kingdom Military Fighting Vehicles Volume (K) Forecast, by Application 2020 & 2033
- Table 39: Germany Military Fighting Vehicles Revenue (billion) Forecast, by Application 2020 & 2033
- Table 40: Germany Military Fighting Vehicles Volume (K) Forecast, by Application 2020 & 2033
- Table 41: France Military Fighting Vehicles Revenue (billion) Forecast, by Application 2020 & 2033
- Table 42: France Military Fighting Vehicles Volume (K) Forecast, by Application 2020 & 2033
- Table 43: Italy Military Fighting Vehicles Revenue (billion) Forecast, by Application 2020 & 2033
- Table 44: Italy Military Fighting Vehicles Volume (K) Forecast, by Application 2020 & 2033
- Table 45: Spain Military Fighting Vehicles Revenue (billion) Forecast, by Application 2020 & 2033
- Table 46: Spain Military Fighting Vehicles Volume (K) Forecast, by Application 2020 & 2033
- Table 47: Russia Military Fighting Vehicles Revenue (billion) Forecast, by Application 2020 & 2033
- Table 48: Russia Military Fighting Vehicles Volume (K) Forecast, by Application 2020 & 2033
- Table 49: Benelux Military Fighting Vehicles Revenue (billion) Forecast, by Application 2020 & 2033
- Table 50: Benelux Military Fighting Vehicles Volume (K) Forecast, by Application 2020 & 2033
- Table 51: Nordics Military Fighting Vehicles Revenue (billion) Forecast, by Application 2020 & 2033
- Table 52: Nordics Military Fighting Vehicles Volume (K) Forecast, by Application 2020 & 2033
- Table 53: Rest of Europe Military Fighting Vehicles Revenue (billion) Forecast, by Application 2020 & 2033
- Table 54: Rest of Europe Military Fighting Vehicles Volume (K) Forecast, by Application 2020 & 2033
- Table 55: Global Military Fighting Vehicles Revenue billion Forecast, by Application 2020 & 2033
- Table 56: Global Military Fighting Vehicles Volume K Forecast, by Application 2020 & 2033
- Table 57: Global Military Fighting Vehicles Revenue billion Forecast, by Types 2020 & 2033
- Table 58: Global Military Fighting Vehicles Volume K Forecast, by Types 2020 & 2033
- Table 59: Global Military Fighting Vehicles Revenue billion Forecast, by Country 2020 & 2033
- Table 60: Global Military Fighting Vehicles Volume K Forecast, by Country 2020 & 2033
- Table 61: Turkey Military Fighting Vehicles Revenue (billion) Forecast, by Application 2020 & 2033
- Table 62: Turkey Military Fighting Vehicles Volume (K) Forecast, by Application 2020 & 2033
- Table 63: Israel Military Fighting Vehicles Revenue (billion) Forecast, by Application 2020 & 2033
- Table 64: Israel Military Fighting Vehicles Volume (K) Forecast, by Application 2020 & 2033
- Table 65: GCC Military Fighting Vehicles Revenue (billion) Forecast, by Application 2020 & 2033
- Table 66: GCC Military Fighting Vehicles Volume (K) Forecast, by Application 2020 & 2033
- Table 67: North Africa Military Fighting Vehicles Revenue (billion) Forecast, by Application 2020 & 2033
- Table 68: North Africa Military Fighting Vehicles Volume (K) Forecast, by Application 2020 & 2033
- Table 69: South Africa Military Fighting Vehicles Revenue (billion) Forecast, by Application 2020 & 2033
- Table 70: South Africa Military Fighting Vehicles Volume (K) Forecast, by Application 2020 & 2033
- Table 71: Rest of Middle East & Africa Military Fighting Vehicles Revenue (billion) Forecast, by Application 2020 & 2033
- Table 72: Rest of Middle East & Africa Military Fighting Vehicles Volume (K) Forecast, by Application 2020 & 2033
- Table 73: Global Military Fighting Vehicles Revenue billion Forecast, by Application 2020 & 2033
- Table 74: Global Military Fighting Vehicles Volume K Forecast, by Application 2020 & 2033
- Table 75: Global Military Fighting Vehicles Revenue billion Forecast, by Types 2020 & 2033
- Table 76: Global Military Fighting Vehicles Volume K Forecast, by Types 2020 & 2033
- Table 77: Global Military Fighting Vehicles Revenue billion Forecast, by Country 2020 & 2033
- Table 78: Global Military Fighting Vehicles Volume K Forecast, by Country 2020 & 2033
- Table 79: China Military Fighting Vehicles Revenue (billion) Forecast, by Application 2020 & 2033
- Table 80: China Military Fighting Vehicles Volume (K) Forecast, by Application 2020 & 2033
- Table 81: India Military Fighting Vehicles Revenue (billion) Forecast, by Application 2020 & 2033
- Table 82: India Military Fighting Vehicles Volume (K) Forecast, by Application 2020 & 2033
- Table 83: Japan Military Fighting Vehicles Revenue (billion) Forecast, by Application 2020 & 2033
- Table 84: Japan Military Fighting Vehicles Volume (K) Forecast, by Application 2020 & 2033
- Table 85: South Korea Military Fighting Vehicles Revenue (billion) Forecast, by Application 2020 & 2033
- Table 86: South Korea Military Fighting Vehicles Volume (K) Forecast, by Application 2020 & 2033
- Table 87: ASEAN Military Fighting Vehicles Revenue (billion) Forecast, by Application 2020 & 2033
- Table 88: ASEAN Military Fighting Vehicles Volume (K) Forecast, by Application 2020 & 2033
- Table 89: Oceania Military Fighting Vehicles Revenue (billion) Forecast, by Application 2020 & 2033
- Table 90: Oceania Military Fighting Vehicles Volume (K) Forecast, by Application 2020 & 2033
- Table 91: Rest of Asia Pacific Military Fighting Vehicles Revenue (billion) Forecast, by Application 2020 & 2033
- Table 92: Rest of Asia Pacific Military Fighting Vehicles Volume (K) Forecast, by Application 2020 & 2033
Frequently Asked Questions
1. What is the projected Compound Annual Growth Rate (CAGR) of the Military Fighting Vehicles?
The projected CAGR is approximately 3.3%.
2. Which companies are prominent players in the Military Fighting Vehicles?
Key companies in the market include Denel SOC, General Dynamics, OSHKOSH DEFENSE, Rheinmetall, Thales, BAE Systems, Navistar Defense, NORINCO, Renault Trucks Defense, ST Engineering, UralVagonZavod (UVZ).
3. What are the main segments of the Military Fighting Vehicles?
The market segments include Application, Types.
4. Can you provide details about the market size?
The market size is estimated to be USD 51.6 billion as of 2022.
5. What are some drivers contributing to market growth?
N/A
6. What are the notable trends driving market growth?
N/A
7. Are there any restraints impacting market growth?
N/A
8. Can you provide examples of recent developments in the market?
N/A
9. What pricing options are available for accessing the report?
Pricing options include single-user, multi-user, and enterprise licenses priced at USD 3350.00, USD 5025.00, and USD 6700.00 respectively.
10. Is the market size provided in terms of value or volume?
The market size is provided in terms of value, measured in billion and volume, measured in K.
11. Are there any specific market keywords associated with the report?
Yes, the market keyword associated with the report is "Military Fighting Vehicles," which aids in identifying and referencing the specific market segment covered.
12. How do I determine which pricing option suits my needs best?
The pricing options vary based on user requirements and access needs. Individual users may opt for single-user licenses, while businesses requiring broader access may choose multi-user or enterprise licenses for cost-effective access to the report.
13. Are there any additional resources or data provided in the Military Fighting Vehicles report?
While the report offers comprehensive insights, it's advisable to review the specific contents or supplementary materials provided to ascertain if additional resources or data are available.
14. How can I stay updated on further developments or reports in the Military Fighting Vehicles?
To stay informed about further developments, trends, and reports in the Military Fighting Vehicles, consider subscribing to industry newsletters, following relevant companies and organizations, or regularly checking reputable industry news sources and publications.
Methodology
Step 1 - Identification of Relevant Samples Size from Population Database


Step 2 - Approaches for Defining Global Market Size (Value, Volume* & Price*)

Note*: In applicable scenarios
Step 3 - Data Sources
Primary Research
- Web Analytics
- Survey Reports
- Research Institute
- Latest Research Reports
- Opinion Leaders
Secondary Research
- Annual Reports
- White Paper
- Latest Press Release
- Industry Association
- Paid Database
- Investor Presentations

Step 4 - Data Triangulation
Involves using different sources of information in order to increase the validity of a study
These sources are likely to be stakeholders in a program - participants, other researchers, program staff, other community members, and so on.
Then we put all data in single framework & apply various statistical tools to find out the dynamic on the market.
During the analysis stage, feedback from the stakeholder groups would be compared to determine areas of agreement as well as areas of divergence