

Key Insights
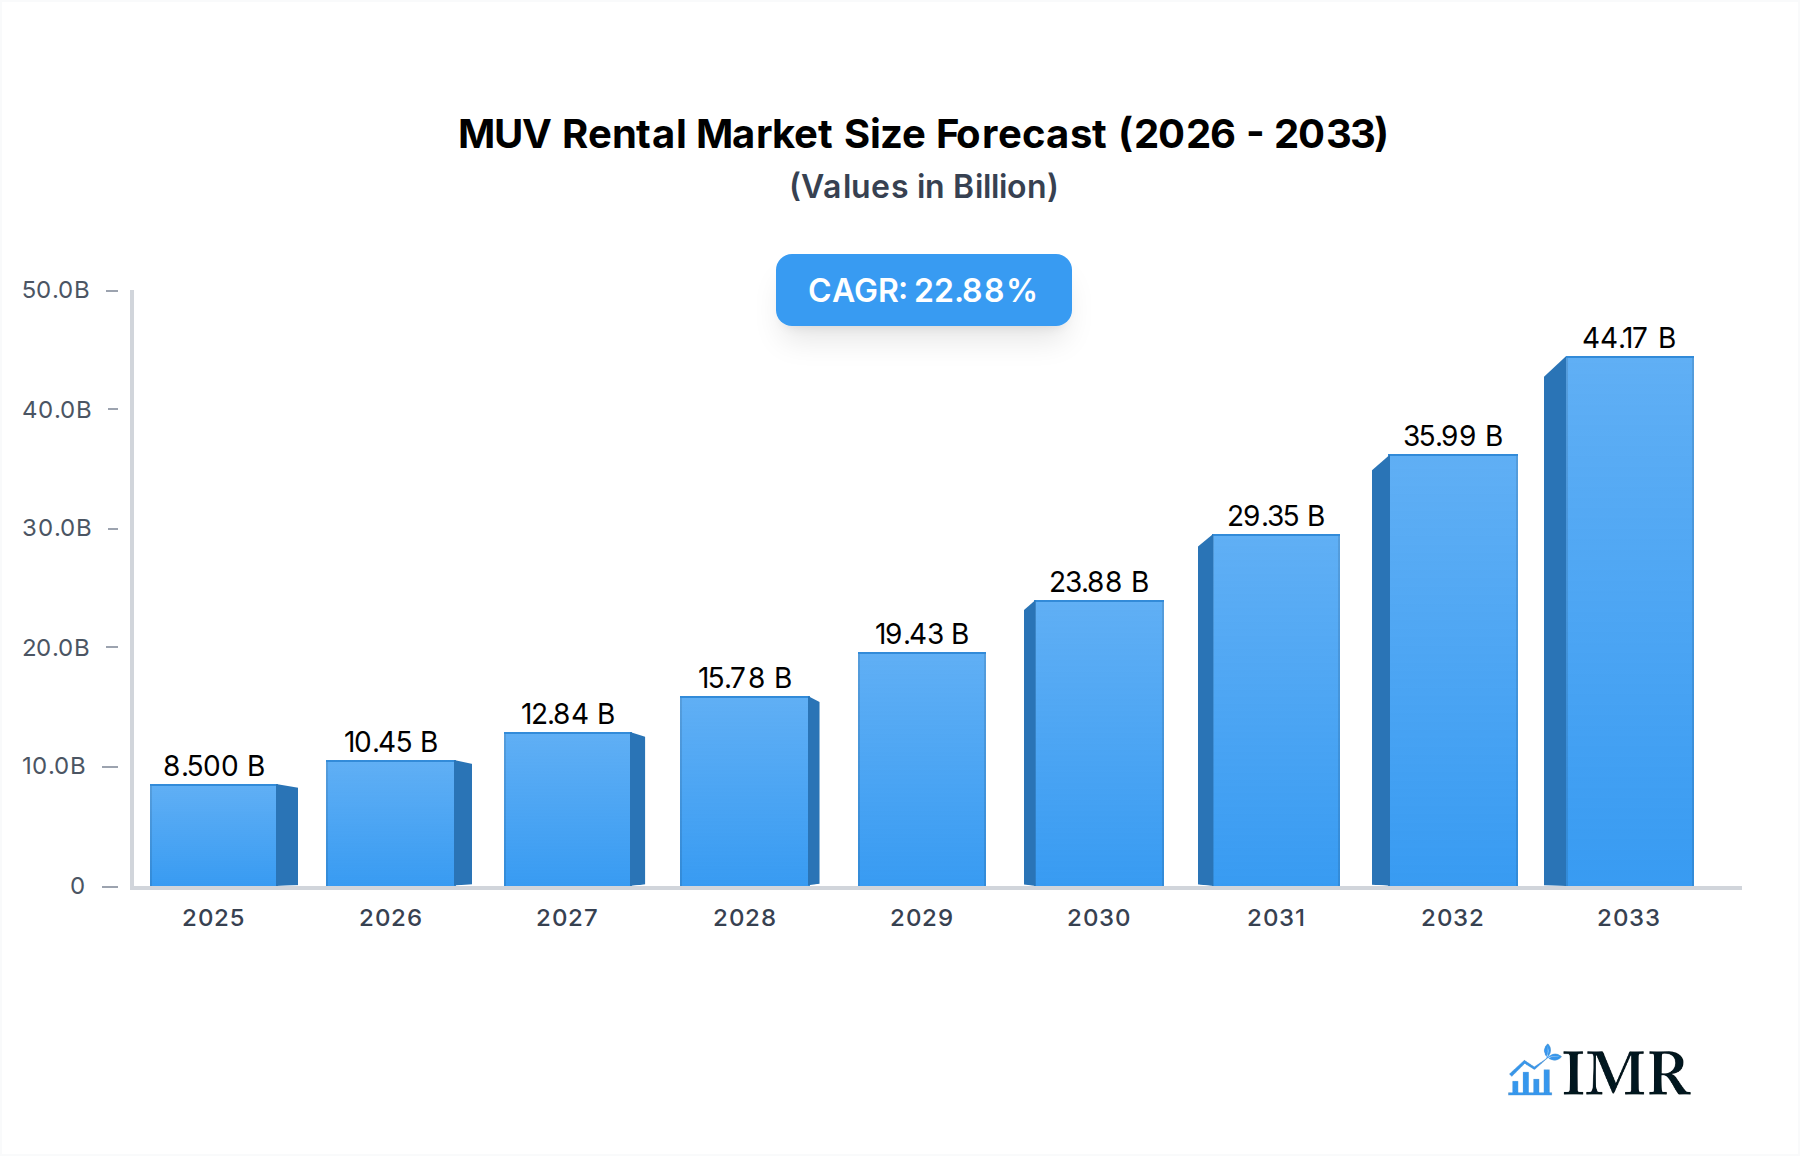
The Multi-Utility Vehicle (MUV) rental market is poised for significant expansion, projected to reach a market size of $8.5 billion in 2025. This robust growth trajectory is fueled by an impressive CAGR of 23.59% over the forecast period, indicating a dynamic and rapidly evolving industry. The surge in demand is largely attributed to evolving consumer preferences for versatile and spacious vehicles, accommodating both families and group travel needs. Furthermore, the increasing adoption of car rental services for business trips and leisure excursions, coupled with the convenience offered by on-airport and off-airport rental facilities, are key drivers. The market encompasses a wide range of vehicles, from passenger MUVs to larger cargo variants, catering to diverse customer requirements. The competitive landscape is characterized by the presence of established global players and emerging local providers, fostering innovation and service enhancements.

MUV Rental Market Size (In Billion)
The MUV rental market's impressive growth is further propelled by several underlying trends. The rise of shared mobility solutions and the increasing preference for flexible transportation options over outright ownership are significantly benefiting the rental sector. Moreover, technological advancements, including the integration of mobile booking platforms and enhanced fleet management systems, are streamlining the rental experience and attracting a wider customer base. While the market exhibits strong growth potential, certain restraints, such as fluctuating fuel prices and the ongoing impact of economic uncertainties, could present challenges. However, the inherent adaptability of the MUV rental segment, coupled with its strategic positioning to meet the burgeoning demand for multi-purpose vehicle rentals, suggests a sustained period of substantial growth across all major geographical regions.
MUV Rental Company Market Share
MUV Rental Market: Comprehensive Analysis and Future Outlook (2019-2033)
This report provides an in-depth analysis of the global MUV rental market, encompassing a comprehensive study from 2019 to 2033. With 2025 as the base and estimated year, the forecast period extends from 2025 to 2033, building upon historical data from 2019 to 2024. This report is designed for industry professionals seeking to understand market dynamics, growth trends, competitive landscapes, and emerging opportunities within the passenger and cargo vehicle rental sector. The analysis covers both on-airport and off-airport segments, examining the influence of key players, technological innovations, and evolving consumer behaviors.
MUV Rental Market Dynamics & Structure
The MUV rental market exhibits a moderately concentrated structure, with dominant players holding significant market share, particularly in developed economies. Technological innovation is a key driver, with advancements in fleet management software, digital booking platforms, and the integration of electric and autonomous vehicle technologies shaping the competitive landscape. Regulatory frameworks, varying by region, impact operational costs and service offerings, influencing market entry and expansion. Competitive product substitutes include ride-sharing services and personal vehicle ownership, necessitating continuous innovation and value-added services from MUV rental companies. End-user demographics are diverse, ranging from business travelers requiring efficient transportation to families and individuals needing flexible mobility solutions for leisure and specific tasks. Mergers and acquisitions (M&A) trends are evident, with larger entities consolidating market presence and expanding service portfolios. For instance, the historical period saw an estimated $15.2 billion in M&A deal volumes, indicating strategic consolidation efforts. Innovation barriers include high capital investment for fleet modernization, the need for robust digital infrastructure, and the challenge of adapting to rapidly evolving consumer preferences and technological advancements.
- Market Concentration: Top 5 players are estimated to hold approximately 55% of the global market share.
- Technological Innovation: Focus on AI-powered pricing, predictive maintenance, and seamless customer experiences.
- Regulatory Frameworks: Varying environmental standards and licensing requirements across key markets.
- Competitive Product Substitutes: Rise of ride-sharing and mobility-as-a-service (MaaS) platforms.
- End-User Demographics: Increasing demand from leisure travelers and SMEs for flexible solutions.
- M&A Trends: Strategic acquisitions aimed at expanding geographic reach and service offerings.
MUV Rental Growth Trends & Insights
The global MUV rental market is poised for robust growth, projected to expand at a Compound Annual Growth Rate (CAGR) of 7.8% during the forecast period. This expansion is driven by increasing travel volumes, both leisure and business, and a growing preference for flexible transportation solutions over outright ownership. The estimated market size in 2025 stands at $85.9 billion, with projections indicating it will reach $155.2 billion by 2033. Adoption rates are steadily increasing, particularly in emerging economies where infrastructure development and rising disposable incomes are fueling demand for personal mobility. Technological disruptions are playing a pivotal role, with the integration of smart fleet management systems enhancing operational efficiency and customer service. The adoption of electric vehicles (EVs) within rental fleets is also a significant trend, driven by environmental consciousness and government incentives, contributing to a greener and more sustainable rental experience. Consumer behavior shifts are evident, with a growing emphasis on convenience, personalized services, and digital-first booking and management. The rise of the sharing economy and the increasing acceptance of subscription-based models are also influencing the MUV rental landscape, pushing companies to offer more flexible and customer-centric options. The penetration of digital booking platforms is expected to reach over 85% by 2033, transforming how customers interact with rental services.
Dominant Regions, Countries, or Segments in MUV Rental
The Passenger Vehicles segment, operating predominantly within the On-airport application, is currently the dominant force driving the global MUV rental market. In 2025, this segment is estimated to account for approximately 68% of the total market revenue, projected to reach $58.4 billion. The dominance of on-airport rentals stems from the convenience and immediate accessibility they offer to travelers arriving at major transportation hubs. This segment benefits significantly from the recovery and growth in air travel, a key indicator of business and leisure travel patterns.
Key Drivers for Passenger Vehicles & On-airport Dominance:
- Resurgence of Air Travel: Post-pandemic recovery in international and domestic air travel directly fuels demand for airport-based car rentals.
- Business Travel Needs: Corporate travelers often require immediate and convenient transport upon arrival, making on-airport rentals the preferred choice for efficiency.
- Leisure Travel Convenience: Tourists and vacationers value the ease of picking up a rental car directly upon landing, simplifying their onward journey.
- Global Infrastructure: Extensive network of airports worldwide ensures consistent demand.
- Market Share: Estimated 60% of global rental transactions occur at airports.
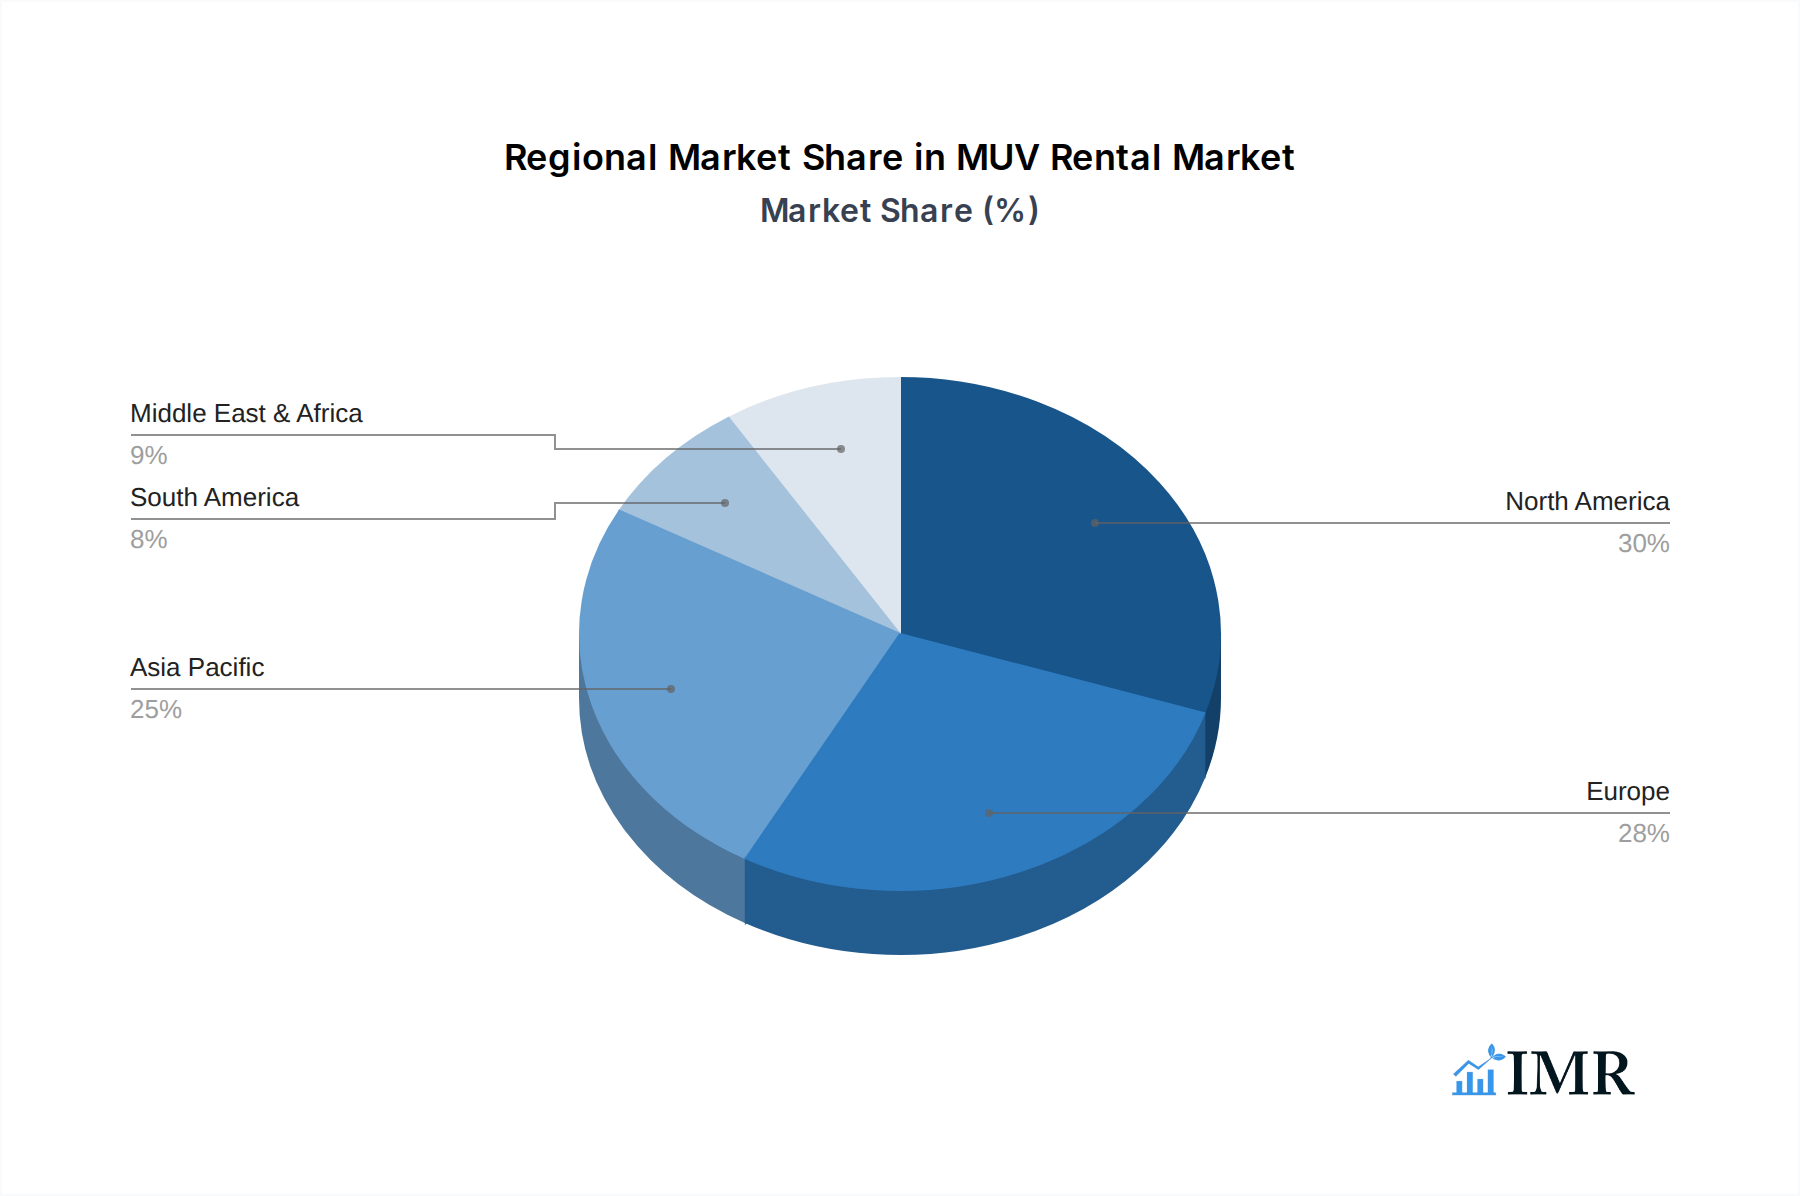
Regional Dominance: North America and Europe are currently the leading regions, collectively holding over 55% of the market share. This is attributed to established travel infrastructure, higher disposable incomes, and a mature rental market. The United States, in particular, represents a significant portion due to its vast domestic travel market and the widespread presence of major rental companies.
Growth Potential in Emerging Markets: While established markets lead, regions like Asia-Pacific are demonstrating higher growth rates. Increased urbanization, a burgeoning middle class, and significant investments in tourism infrastructure are expected to drive substantial growth in these areas over the forecast period. The CAGR in the Asia-Pacific region is projected to be 9.2% from 2025-2033.
MUV Rental Product Landscape
The MUV rental product landscape is characterized by an increasing diversification of offerings to meet varied customer needs. Beyond standard passenger vehicles, there's a growing demand for specialized vehicles such as cargo vans for small businesses and individuals requiring temporary transport for goods, and larger passenger vans for group travel. Innovations focus on enhancing the user experience through seamless digital integration for booking, keyless entry, and in-car connectivity. Fleet modernization includes a push towards electric and hybrid vehicles, appealing to environmentally conscious consumers and aligning with corporate sustainability goals. Performance metrics are increasingly being tracked for fuel efficiency, vehicle maintenance schedules, and customer satisfaction scores, driving continuous improvement in service quality.
Key Drivers, Barriers & Challenges in MUV Rental
Key Drivers:
- Economic Recovery and Travel Resurgence: The rebound in global travel, both business and leisure, is a primary catalyst.
- Growing Demand for Flexible Mobility: Consumers and businesses increasingly prefer flexible rental options over vehicle ownership.
- Technological Advancements: Digitalization of booking, fleet management, and the integration of EVs enhance efficiency and customer experience.
- Tourism Growth: Expansion of the tourism sector globally fuels demand for rental vehicles.
Key Barriers & Challenges:
- Supply Chain Disruptions: Lingering effects of global supply chain issues can impact fleet acquisition and maintenance, potentially leading to vehicle shortages and increased costs.
- Intense Competition: The market faces competition from ride-sharing platforms, car-sharing services, and evolving mobility solutions.
- Regulatory Hurdles: Stringent environmental regulations and licensing requirements in certain regions can increase operational complexity and costs.
- Economic Volatility: Fluctuations in global economic conditions can impact travel budgets and, consequently, rental demand.
- Fleet Management Costs: High costs associated with fleet acquisition, maintenance, insurance, and depreciation.
Emerging Opportunities in MUV Rental
Emerging opportunities lie in catering to niche markets and leveraging technological advancements. The growing demand for electric vehicle rentals presents a significant opportunity, with companies investing in expanding their EV fleets and charging infrastructure. The rise of e-commerce and the gig economy is creating sustained demand for cargo van rentals, particularly in urban areas. Furthermore, offering subscription-based rental models or mobility packages that bundle various services can attract a wider customer base and foster loyalty. Untapped markets in developing economies with growing tourism sectors and increasing disposable incomes also represent significant growth potential.
Growth Accelerators in the MUV Rental Industry
Long-term growth in the MUV rental industry will be significantly accelerated by strategic technological breakthroughs and market expansion initiatives. The widespread adoption of AI and machine learning for dynamic pricing, personalized customer offers, and predictive maintenance will optimize operations and enhance profitability. Strategic partnerships with airlines, hotels, and corporate travel management companies are crucial for expanding reach and securing consistent booking streams. Furthermore, aggressive market expansion into underserved regions, coupled with localized service offerings, will unlock new revenue streams. The development and integration of autonomous vehicle rental services, though long-term, represent a transformative growth accelerator.
Key Players Shaping the MUV Rental Market
- Enterprise Holdings, Inc.
- Dollar Rent A Car, Inc. (Hertz)
- Budget Rent A Car System, Inc. (Avis Budget Group)
- SIXT SE
- Alamo
- Airport Van Rental
- Europcar
- Localiza
- Uber Technologies, Inc.
- Carzonrent India Pvt Ltd.
- Eco Rent a Car
Notable Milestones in MUV Rental Sector
- 2020 May: Launch of enhanced contactless pick-up and drop-off services by major rental companies in response to the pandemic.
- 2021 Q3: Significant investment in electric vehicle fleets by several key players, signaling a commitment to sustainability.
- 2022 Q1: Expansion of subscription-based rental models by leading companies to cater to evolving consumer preferences.
- 2023 Q4: Increased focus on digital innovation, including AI-powered booking assistants and personalized customer journeys.
- 2024 Q2: Strategic M&A activities aimed at consolidating market presence and expanding service portfolios in key growth regions.
In-Depth MUV Rental Market Outlook
The MUV rental market outlook is highly optimistic, driven by the sustained recovery in global travel and the increasing adoption of flexible mobility solutions. Growth accelerators like technological integration, particularly in areas of AI, data analytics, and sustainable fleet management, will be pivotal. The expansion into emerging markets and the development of specialized rental services for sectors like e-commerce and logistics will further fuel growth. Strategic partnerships and a continued focus on enhancing the customer experience through digital platforms are expected to solidify market dominance. The industry is well-positioned for significant expansion, with innovation and adaptability being key to capitalizing on future opportunities.
MUV Rental Segmentation
-
1. Application
- 1.1. On-airport
- 1.2. Off-airport
-
2. Types
- 2.1. Passenger Vehicles
- 2.2. Cargo Vehicles
MUV Rental Segmentation By Geography
-
1. North America
- 1.1. United States
- 1.2. Canada
- 1.3. Mexico
-
2. South America
- 2.1. Brazil
- 2.2. Argentina
- 2.3. Rest of South America
-
3. Europe
- 3.1. United Kingdom
- 3.2. Germany
- 3.3. France
- 3.4. Italy
- 3.5. Spain
- 3.6. Russia
- 3.7. Benelux
- 3.8. Nordics
- 3.9. Rest of Europe
-
4. Middle East & Africa
- 4.1. Turkey
- 4.2. Israel
- 4.3. GCC
- 4.4. North Africa
- 4.5. South Africa
- 4.6. Rest of Middle East & Africa
-
5. Asia Pacific
- 5.1. China
- 5.2. India
- 5.3. Japan
- 5.4. South Korea
- 5.5. ASEAN
- 5.6. Oceania
- 5.7. Rest of Asia Pacific
MUV Rental Regional Market Share
Geographic Coverage of MUV Rental
MUV Rental REPORT HIGHLIGHTS
| Aspects | Details |
|---|---|
| Study Period | 2020-2034 |
| Base Year | 2025 |
| Estimated Year | 2026 |
| Forecast Period | 2026-2034 |
| Historical Period | 2020-2025 |
| Growth Rate | CAGR of 35% from 2020-2034 |
| Segmentation |
|
Table of Contents
- 1. Introduction
- 1.1. Research Scope
- 1.2. Market Segmentation
- 1.3. Research Objective
- 1.4. Definitions and Assumptions
- 2. Executive Summary
- 2.1. Market Snapshot
- 3. Market Dynamics
- 3.1. Market Drivers
- 3.2. Market Restrains
- 3.3. Market Trends
- 3.4. Market Opportunities
- 4. Market Factor Analysis
- 4.1. Porters Five Forces
- 4.1.1. Bargaining Power of Suppliers
- 4.1.2. Bargaining Power of Buyers
- 4.1.3. Threat of New Entrants
- 4.1.4. Threat of Substitutes
- 4.1.5. Competitive Rivalry
- 4.2. PESTEL analysis
- 4.3. BCG Analysis
- 4.3.1. Stars (High Growth, High Market Share)
- 4.3.2. Cash Cows (Low Growth, High Market Share)
- 4.3.3. Question Mark (High Growth, Low Market Share)
- 4.3.4. Dogs (Low Growth, Low Market Share)
- 4.4. Ansoff Matrix Analysis
- 4.5. Supply Chain Analysis
- 4.6. Regulatory Landscape
- 4.7. Current Market Potential and Opportunity Assessment (TAM–SAM–SOM Framework)
- 4.8. IMR Analyst Note
- 4.1. Porters Five Forces
- 5. Market Analysis, Insights and Forecast 2021-2033
- 5.1. Market Analysis, Insights and Forecast - by Application
- 5.1.1. On-airport
- 5.1.2. Off-airport
- 5.2. Market Analysis, Insights and Forecast - by Types
- 5.2.1. Passenger Vehicles
- 5.2.2. Cargo Vehicles
- 5.3. Market Analysis, Insights and Forecast - by Region
- 5.3.1. North America
- 5.3.2. South America
- 5.3.3. Europe
- 5.3.4. Middle East & Africa
- 5.3.5. Asia Pacific
- 5.1. Market Analysis, Insights and Forecast - by Application
- 6. Global MUV Rental Analysis, Insights and Forecast, 2021-2033
- 6.1. Market Analysis, Insights and Forecast - by Application
- 6.1.1. On-airport
- 6.1.2. Off-airport
- 6.2. Market Analysis, Insights and Forecast - by Types
- 6.2.1. Passenger Vehicles
- 6.2.2. Cargo Vehicles
- 6.1. Market Analysis, Insights and Forecast - by Application
- 7. North America MUV Rental Analysis, Insights and Forecast, 2020-2032
- 7.1. Market Analysis, Insights and Forecast - by Application
- 7.1.1. On-airport
- 7.1.2. Off-airport
- 7.2. Market Analysis, Insights and Forecast - by Types
- 7.2.1. Passenger Vehicles
- 7.2.2. Cargo Vehicles
- 7.1. Market Analysis, Insights and Forecast - by Application
- 8. South America MUV Rental Analysis, Insights and Forecast, 2020-2032
- 8.1. Market Analysis, Insights and Forecast - by Application
- 8.1.1. On-airport
- 8.1.2. Off-airport
- 8.2. Market Analysis, Insights and Forecast - by Types
- 8.2.1. Passenger Vehicles
- 8.2.2. Cargo Vehicles
- 8.1. Market Analysis, Insights and Forecast - by Application
- 9. Europe MUV Rental Analysis, Insights and Forecast, 2020-2032
- 9.1. Market Analysis, Insights and Forecast - by Application
- 9.1.1. On-airport
- 9.1.2. Off-airport
- 9.2. Market Analysis, Insights and Forecast - by Types
- 9.2.1. Passenger Vehicles
- 9.2.2. Cargo Vehicles
- 9.1. Market Analysis, Insights and Forecast - by Application
- 10. Middle East & Africa MUV Rental Analysis, Insights and Forecast, 2020-2032
- 10.1. Market Analysis, Insights and Forecast - by Application
- 10.1.1. On-airport
- 10.1.2. Off-airport
- 10.2. Market Analysis, Insights and Forecast - by Types
- 10.2.1. Passenger Vehicles
- 10.2.2. Cargo Vehicles
- 10.1. Market Analysis, Insights and Forecast - by Application
- 11. Asia Pacific MUV Rental Analysis, Insights and Forecast, 2020-2032
- 11.1. Market Analysis, Insights and Forecast - by Application
- 11.1.1. On-airport
- 11.1.2. Off-airport
- 11.2. Market Analysis, Insights and Forecast - by Types
- 11.2.1. Passenger Vehicles
- 11.2.2. Cargo Vehicles
- 11.1. Market Analysis, Insights and Forecast - by Application
- 12. Competitive Analysis
- 12.1. Company Profiles
- 12.1.1 Enterprise Holdings
- 12.1.1.1. Company Overview
- 12.1.1.2. Products
- 12.1.1.3. Company Financials
- 12.1.1.4. SWOT Analysis
- 12.1.2 Inc.
- 12.1.2.1. Company Overview
- 12.1.2.2. Products
- 12.1.2.3. Company Financials
- 12.1.2.4. SWOT Analysis
- 12.1.3 Dollar Rent A Car
- 12.1.3.1. Company Overview
- 12.1.3.2. Products
- 12.1.3.3. Company Financials
- 12.1.3.4. SWOT Analysis
- 12.1.4 Inc.(Hertz)
- 12.1.4.1. Company Overview
- 12.1.4.2. Products
- 12.1.4.3. Company Financials
- 12.1.4.4. SWOT Analysis
- 12.1.5 Budget Rent A Car System
- 12.1.5.1. Company Overview
- 12.1.5.2. Products
- 12.1.5.3. Company Financials
- 12.1.5.4. SWOT Analysis
- 12.1.6 Inc.(Avis Budget Group)
- 12.1.6.1. Company Overview
- 12.1.6.2. Products
- 12.1.6.3. Company Financials
- 12.1.6.4. SWOT Analysis
- 12.1.7 SIXT SE
- 12.1.7.1. Company Overview
- 12.1.7.2. Products
- 12.1.7.3. Company Financials
- 12.1.7.4. SWOT Analysis
- 12.1.8 Alamo
- 12.1.8.1. Company Overview
- 12.1.8.2. Products
- 12.1.8.3. Company Financials
- 12.1.8.4. SWOT Analysis
- 12.1.9 Airport Van Rental
- 12.1.9.1. Company Overview
- 12.1.9.2. Products
- 12.1.9.3. Company Financials
- 12.1.9.4. SWOT Analysis
- 12.1.10 Europcar
- 12.1.10.1. Company Overview
- 12.1.10.2. Products
- 12.1.10.3. Company Financials
- 12.1.10.4. SWOT Analysis
- 12.1.11 Localiza
- 12.1.11.1. Company Overview
- 12.1.11.2. Products
- 12.1.11.3. Company Financials
- 12.1.11.4. SWOT Analysis
- 12.1.12 Uber Technologies
- 12.1.12.1. Company Overview
- 12.1.12.2. Products
- 12.1.12.3. Company Financials
- 12.1.12.4. SWOT Analysis
- 12.1.13 Inc.
- 12.1.13.1. Company Overview
- 12.1.13.2. Products
- 12.1.13.3. Company Financials
- 12.1.13.4. SWOT Analysis
- 12.1.14 Carzonrent India Pvt Ltd.
- 12.1.14.1. Company Overview
- 12.1.14.2. Products
- 12.1.14.3. Company Financials
- 12.1.14.4. SWOT Analysis
- 12.1.15 Eco Rent a Car
- 12.1.15.1. Company Overview
- 12.1.15.2. Products
- 12.1.15.3. Company Financials
- 12.1.15.4. SWOT Analysis
- 12.1.1 Enterprise Holdings
- 12.2. Market Entropy
- 12.2.1 Company's Key Areas Served
- 12.2.2 Recent Developments
- 12.3. Company Market Share Analysis 2025
- 12.3.1 Top 5 Companies Market Share Analysis
- 12.3.2 Top 3 Companies Market Share Analysis
- 12.4. List of Potential Customers
- 13. Research Methodology
List of Figures
- Figure 1: Global MUV Rental Revenue Breakdown (undefined, %) by Region 2025 & 2033
- Figure 2: North America MUV Rental Revenue (undefined), by Application 2025 & 2033
- Figure 3: North America MUV Rental Revenue Share (%), by Application 2025 & 2033
- Figure 4: North America MUV Rental Revenue (undefined), by Types 2025 & 2033
- Figure 5: North America MUV Rental Revenue Share (%), by Types 2025 & 2033
- Figure 6: North America MUV Rental Revenue (undefined), by Country 2025 & 2033
- Figure 7: North America MUV Rental Revenue Share (%), by Country 2025 & 2033
- Figure 8: South America MUV Rental Revenue (undefined), by Application 2025 & 2033
- Figure 9: South America MUV Rental Revenue Share (%), by Application 2025 & 2033
- Figure 10: South America MUV Rental Revenue (undefined), by Types 2025 & 2033
- Figure 11: South America MUV Rental Revenue Share (%), by Types 2025 & 2033
- Figure 12: South America MUV Rental Revenue (undefined), by Country 2025 & 2033
- Figure 13: South America MUV Rental Revenue Share (%), by Country 2025 & 2033
- Figure 14: Europe MUV Rental Revenue (undefined), by Application 2025 & 2033
- Figure 15: Europe MUV Rental Revenue Share (%), by Application 2025 & 2033
- Figure 16: Europe MUV Rental Revenue (undefined), by Types 2025 & 2033
- Figure 17: Europe MUV Rental Revenue Share (%), by Types 2025 & 2033
- Figure 18: Europe MUV Rental Revenue (undefined), by Country 2025 & 2033
- Figure 19: Europe MUV Rental Revenue Share (%), by Country 2025 & 2033
- Figure 20: Middle East & Africa MUV Rental Revenue (undefined), by Application 2025 & 2033
- Figure 21: Middle East & Africa MUV Rental Revenue Share (%), by Application 2025 & 2033
- Figure 22: Middle East & Africa MUV Rental Revenue (undefined), by Types 2025 & 2033
- Figure 23: Middle East & Africa MUV Rental Revenue Share (%), by Types 2025 & 2033
- Figure 24: Middle East & Africa MUV Rental Revenue (undefined), by Country 2025 & 2033
- Figure 25: Middle East & Africa MUV Rental Revenue Share (%), by Country 2025 & 2033
- Figure 26: Asia Pacific MUV Rental Revenue (undefined), by Application 2025 & 2033
- Figure 27: Asia Pacific MUV Rental Revenue Share (%), by Application 2025 & 2033
- Figure 28: Asia Pacific MUV Rental Revenue (undefined), by Types 2025 & 2033
- Figure 29: Asia Pacific MUV Rental Revenue Share (%), by Types 2025 & 2033
- Figure 30: Asia Pacific MUV Rental Revenue (undefined), by Country 2025 & 2033
- Figure 31: Asia Pacific MUV Rental Revenue Share (%), by Country 2025 & 2033
List of Tables
- Table 1: Global MUV Rental Revenue undefined Forecast, by Application 2020 & 2033
- Table 2: Global MUV Rental Revenue undefined Forecast, by Types 2020 & 2033
- Table 3: Global MUV Rental Revenue undefined Forecast, by Region 2020 & 2033
- Table 4: Global MUV Rental Revenue undefined Forecast, by Application 2020 & 2033
- Table 5: Global MUV Rental Revenue undefined Forecast, by Types 2020 & 2033
- Table 6: Global MUV Rental Revenue undefined Forecast, by Country 2020 & 2033
- Table 7: United States MUV Rental Revenue (undefined) Forecast, by Application 2020 & 2033
- Table 8: Canada MUV Rental Revenue (undefined) Forecast, by Application 2020 & 2033
- Table 9: Mexico MUV Rental Revenue (undefined) Forecast, by Application 2020 & 2033
- Table 10: Global MUV Rental Revenue undefined Forecast, by Application 2020 & 2033
- Table 11: Global MUV Rental Revenue undefined Forecast, by Types 2020 & 2033
- Table 12: Global MUV Rental Revenue undefined Forecast, by Country 2020 & 2033
- Table 13: Brazil MUV Rental Revenue (undefined) Forecast, by Application 2020 & 2033
- Table 14: Argentina MUV Rental Revenue (undefined) Forecast, by Application 2020 & 2033
- Table 15: Rest of South America MUV Rental Revenue (undefined) Forecast, by Application 2020 & 2033
- Table 16: Global MUV Rental Revenue undefined Forecast, by Application 2020 & 2033
- Table 17: Global MUV Rental Revenue undefined Forecast, by Types 2020 & 2033
- Table 18: Global MUV Rental Revenue undefined Forecast, by Country 2020 & 2033
- Table 19: United Kingdom MUV Rental Revenue (undefined) Forecast, by Application 2020 & 2033
- Table 20: Germany MUV Rental Revenue (undefined) Forecast, by Application 2020 & 2033
- Table 21: France MUV Rental Revenue (undefined) Forecast, by Application 2020 & 2033
- Table 22: Italy MUV Rental Revenue (undefined) Forecast, by Application 2020 & 2033
- Table 23: Spain MUV Rental Revenue (undefined) Forecast, by Application 2020 & 2033
- Table 24: Russia MUV Rental Revenue (undefined) Forecast, by Application 2020 & 2033
- Table 25: Benelux MUV Rental Revenue (undefined) Forecast, by Application 2020 & 2033
- Table 26: Nordics MUV Rental Revenue (undefined) Forecast, by Application 2020 & 2033
- Table 27: Rest of Europe MUV Rental Revenue (undefined) Forecast, by Application 2020 & 2033
- Table 28: Global MUV Rental Revenue undefined Forecast, by Application 2020 & 2033
- Table 29: Global MUV Rental Revenue undefined Forecast, by Types 2020 & 2033
- Table 30: Global MUV Rental Revenue undefined Forecast, by Country 2020 & 2033
- Table 31: Turkey MUV Rental Revenue (undefined) Forecast, by Application 2020 & 2033
- Table 32: Israel MUV Rental Revenue (undefined) Forecast, by Application 2020 & 2033
- Table 33: GCC MUV Rental Revenue (undefined) Forecast, by Application 2020 & 2033
- Table 34: North Africa MUV Rental Revenue (undefined) Forecast, by Application 2020 & 2033
- Table 35: South Africa MUV Rental Revenue (undefined) Forecast, by Application 2020 & 2033
- Table 36: Rest of Middle East & Africa MUV Rental Revenue (undefined) Forecast, by Application 2020 & 2033
- Table 37: Global MUV Rental Revenue undefined Forecast, by Application 2020 & 2033
- Table 38: Global MUV Rental Revenue undefined Forecast, by Types 2020 & 2033
- Table 39: Global MUV Rental Revenue undefined Forecast, by Country 2020 & 2033
- Table 40: China MUV Rental Revenue (undefined) Forecast, by Application 2020 & 2033
- Table 41: India MUV Rental Revenue (undefined) Forecast, by Application 2020 & 2033
- Table 42: Japan MUV Rental Revenue (undefined) Forecast, by Application 2020 & 2033
- Table 43: South Korea MUV Rental Revenue (undefined) Forecast, by Application 2020 & 2033
- Table 44: ASEAN MUV Rental Revenue (undefined) Forecast, by Application 2020 & 2033
- Table 45: Oceania MUV Rental Revenue (undefined) Forecast, by Application 2020 & 2033
- Table 46: Rest of Asia Pacific MUV Rental Revenue (undefined) Forecast, by Application 2020 & 2033
Frequently Asked Questions
1. What is the projected Compound Annual Growth Rate (CAGR) of the MUV Rental?
The projected CAGR is approximately 35%.
2. Which companies are prominent players in the MUV Rental?
Key companies in the market include Enterprise Holdings, Inc., Dollar Rent A Car, Inc.(Hertz), Budget Rent A Car System, Inc.(Avis Budget Group), SIXT SE, Alamo, Airport Van Rental, Europcar, Localiza, Uber Technologies, Inc., Carzonrent India Pvt Ltd., Eco Rent a Car.
3. What are the main segments of the MUV Rental?
The market segments include Application, Types.
4. Can you provide details about the market size?
The market size is estimated to be USD XXX N/A as of 2022.
5. What are some drivers contributing to market growth?
N/A
6. What are the notable trends driving market growth?
N/A
7. Are there any restraints impacting market growth?
N/A
8. Can you provide examples of recent developments in the market?
N/A
9. What pricing options are available for accessing the report?
Pricing options include single-user, multi-user, and enterprise licenses priced at USD 3350.00, USD 5025.00, and USD 6700.00 respectively.
10. Is the market size provided in terms of value or volume?
The market size is provided in terms of value, measured in N/A.
11. Are there any specific market keywords associated with the report?
Yes, the market keyword associated with the report is "MUV Rental," which aids in identifying and referencing the specific market segment covered.
12. How do I determine which pricing option suits my needs best?
The pricing options vary based on user requirements and access needs. Individual users may opt for single-user licenses, while businesses requiring broader access may choose multi-user or enterprise licenses for cost-effective access to the report.
13. Are there any additional resources or data provided in the MUV Rental report?
While the report offers comprehensive insights, it's advisable to review the specific contents or supplementary materials provided to ascertain if additional resources or data are available.
14. How can I stay updated on further developments or reports in the MUV Rental?
To stay informed about further developments, trends, and reports in the MUV Rental, consider subscribing to industry newsletters, following relevant companies and organizations, or regularly checking reputable industry news sources and publications.
Methodology
Step 1 - Identification of Relevant Samples Size from Population Database


Step 2 - Approaches for Defining Global Market Size (Value, Volume* & Price*)

Note*: In applicable scenarios
Step 3 - Data Sources
Primary Research
- Web Analytics
- Survey Reports
- Research Institute
- Latest Research Reports
- Opinion Leaders
Secondary Research
- Annual Reports
- White Paper
- Latest Press Release
- Industry Association
- Paid Database
- Investor Presentations

Step 4 - Data Triangulation
Involves using different sources of information in order to increase the validity of a study
These sources are likely to be stakeholders in a program - participants, other researchers, program staff, other community members, and so on.
Then we put all data in single framework & apply various statistical tools to find out the dynamic on the market.
During the analysis stage, feedback from the stakeholder groups would be compared to determine areas of agreement as well as areas of divergence