

Key Insights
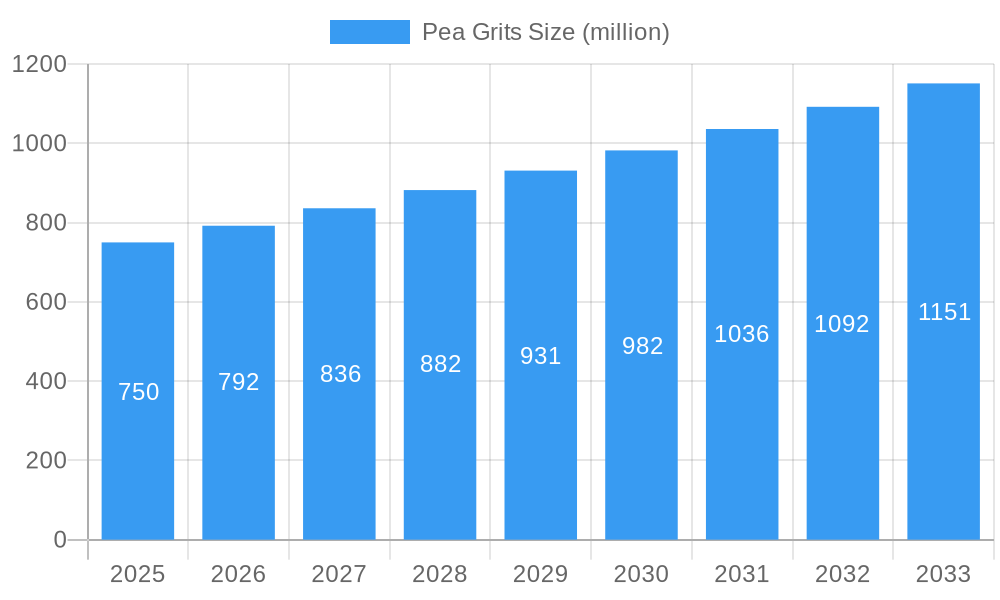
The global Pea Grits market is poised for significant expansion, projected to reach approximately USD 750 million by 2025, with a Compound Annual Growth Rate (CAGR) of around 5.5% anticipated between 2025 and 2033. This robust growth is primarily fueled by the escalating demand for plant-based protein sources across various industries. The food processing sector stands out as a dominant application, driven by the increasing popularity of vegetarian and vegan diets, as well as the functional properties of pea grits as an ingredient in a wide range of food products. Furthermore, the poultry feed industry is a substantial contributor, leveraging pea grits for their nutritional value and cost-effectiveness as an alternative to traditional feed ingredients. The versatility of pea grits, catering to evolving consumer preferences for healthier and sustainable food options, underpins this upward trajectory.
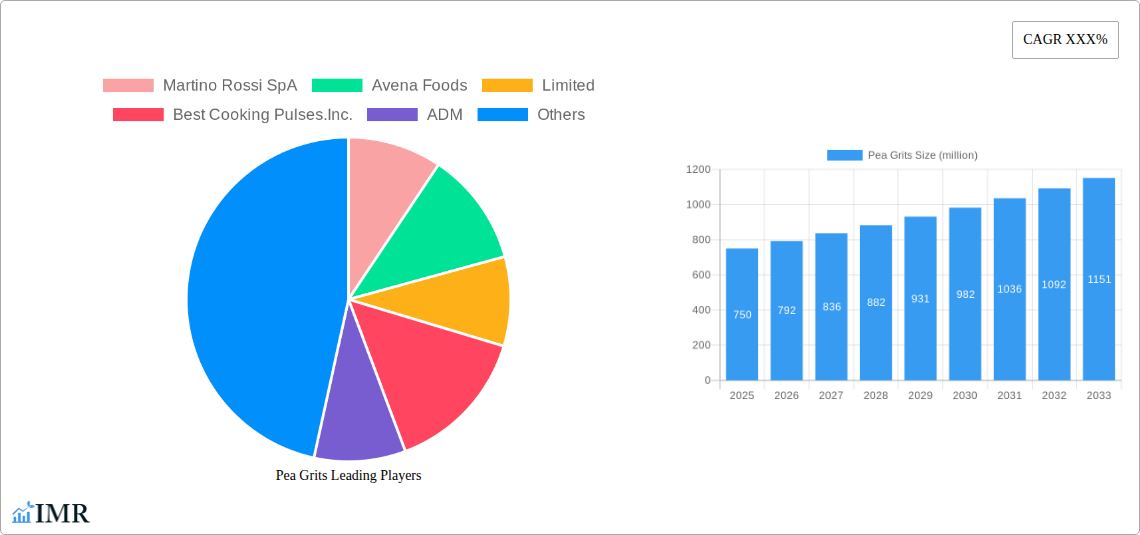
Pea Grits Market Size (In Million)
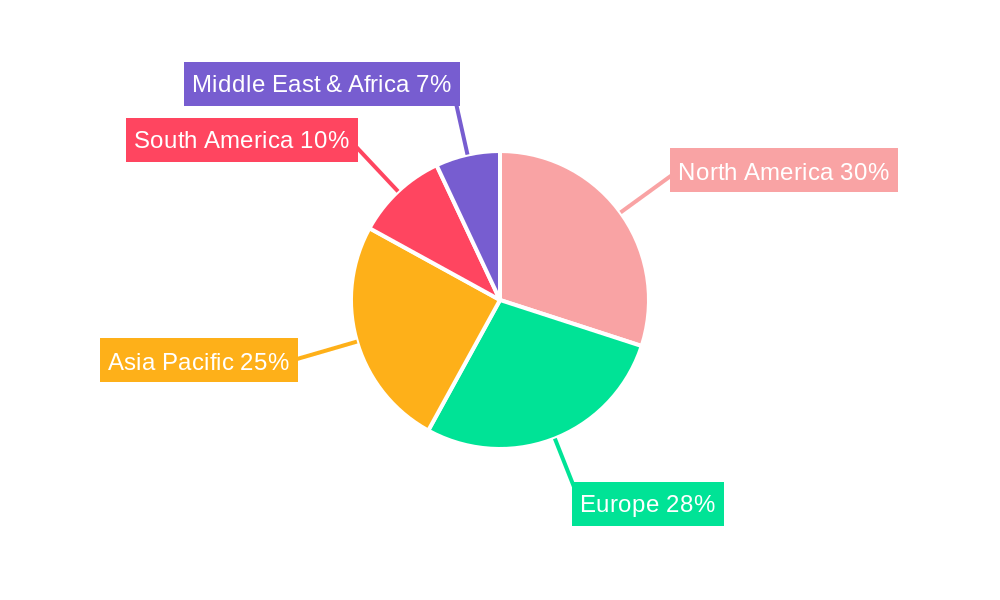
The market dynamics are further shaped by emerging trends such as innovation in pea-based product development, including alternative meat products and specialized nutritional supplements. Advancements in processing technologies are also contributing to enhanced quality and broader applications. While the market exhibits strong growth potential, certain restraints, such as fluctuating raw material prices and the need for greater consumer awareness regarding the benefits of pea grits, warrant attention. North America and Europe currently represent the leading regional markets, owing to established dietary habits favoring plant-based proteins and a well-developed food and feed industry. However, the Asia Pacific region is expected to witness the most rapid growth, propelled by a burgeoning population, increasing disposable incomes, and a growing awareness of health and environmental concerns. Key players like ADM, Ingredion, and AGT Food and Ingredients are actively investing in R&D and expanding their production capacities to capitalize on these market opportunities.
Pea Grits Company Market Share
This comprehensive report delves into the dynamic global Pea Grits market, providing an in-depth analysis of its structure, growth trends, regional dominance, product landscape, and future outlook. Covering a study period from 2019 to 2033, with 2025 as the base and estimated year, and a forecast period spanning 2025–2033, this report offers critical insights for industry stakeholders. We analyze market concentration, technological innovation drivers, regulatory frameworks, competitive product substitutes, end-user demographics, and M&A trends, alongside market size evolution, adoption rates, technological disruptions, and consumer behavior shifts. The report identifies leading regions, countries, and segments within Food Processing, Poultry Feeds, Food Services, Households, and Others, by Type: Green Pea Grits and Yellow Pea Grits. It details product innovations, applications, and performance metrics, while outlining key drivers, barriers, challenges, and emerging opportunities. Furthermore, it highlights growth accelerators and profiles key players shaping the market, along with notable milestones. This report is optimized for search engines with high-traffic keywords such as "pea grits market," "green pea grits," "yellow pea grits," "food processing ingredients," "poultry feed additives," "pulse ingredients," "plant-based protein," "specialty grains," and "agricultural commodities." We present all values in million units for clarity and ease of understanding, making this report indispensable for strategic decision-making within the parent and child markets.
Pea Grits Market Dynamics & Structure
The global Pea Grits market exhibits a moderately concentrated structure, with a few key players holding significant market share, interspersed with a considerable number of regional and niche manufacturers. Technological innovation is a primary driver, particularly in improving processing efficiency, enhancing nutritional profiles, and developing novel applications. Regulatory frameworks surrounding food safety and labeling of pulse-derived ingredients play a crucial role in market access and consumer trust. Competitive product substitutes, primarily from other legumes, grains, and refined starches, exert pressure on pricing and market penetration. End-user demographics are shifting towards health-conscious consumers seeking plant-based protein sources and functional food ingredients. Mergers and acquisitions (M&A) trends are observed as larger entities seek to expand their ingredient portfolios and geographical reach, consolidating market power.
- Market Concentration: Moderate, with key players like ADM and Ingredion. holding substantial portions.
- Technological Innovation: Focus on sustainable processing, protein isolation, and novel food applications.
- Regulatory Frameworks: Emphasis on food safety standards (e.g., GFSI, HACCP) and clear ingredient labeling.
- Competitive Substitutes: Other pulses (lentils, chickpeas), grains (oats, barley), and refined starches.
- End-User Demographics: Growing demand from health-conscious consumers, vegan/vegetarian populations, and the animal feed industry.
- M&A Trends: Strategic acquisitions by larger food ingredient companies to broaden their plant-based offerings and market presence.
Pea Grits Growth Trends & Insights
The Pea Grits market is poised for robust expansion, driven by an escalating global demand for sustainable and plant-based protein sources. Market size evolution indicates a steady upward trajectory, with significant growth projected over the forecast period. Adoption rates for pea grits are accelerating across diverse applications, fueled by increasing consumer awareness regarding the health benefits and environmental advantages of pulses. Technological disruptions, such as advancements in de-hulling, milling, and extrusion technologies, are enhancing the functionality and appeal of pea grits, enabling their integration into a wider array of food products. Consumer behavior shifts are prominently featuring a preference for clean-label ingredients, non-GMO products, and foods that align with ethical and environmental values. This shift is directly benefiting pea grits, a versatile ingredient derived from a low-impact crop. The market penetration of pea grits is steadily increasing, particularly within the food processing sector for applications like baked goods, snacks, and meat alternatives, as well as in the burgeoning animal feed industry for its protein and fiber content. The CAGR for pea grits is projected to remain strong, reflecting these sustained growth drivers. The increasing focus on circular economy principles and sustainable agriculture further bolsters the appeal of pea grits, aligning with global efforts to reduce food waste and enhance resource efficiency.
Dominant Regions, Countries, or Segments in Pea Grits
The Food Processing segment, particularly within North America and Europe, is currently the dominant force driving growth in the global Pea Grits market. This dominance is attributed to several key factors, including robust consumer demand for plant-based alternatives, a well-established food manufacturing infrastructure, and supportive governmental policies promoting healthy eating and sustainable agriculture. North America, led by the United States and Canada, exhibits high adoption rates due to a significant vegan and vegetarian population and a thriving functional food industry. European nations, such as Germany, France, and the United Kingdom, are also major contributors, driven by stringent regulations on processed foods and a growing consumer preference for natural and minimally processed ingredients.
- Dominant Segment: Food Processing stands out due to its widespread application in various food products, including:
- Baked Goods: Pea grits add texture, protein, and fiber to bread, crackers, and cereals.
- Snacks: Increasingly used in extruded snacks for enhanced nutritional value.
- Meat Alternatives: A crucial ingredient in plant-based burgers, sausages, and other protein substitutes.
- Dairy Alternatives: Incorporated into plant-based yogurts and milk alternatives.
- Dominant Regions: North America and Europe lead due to:
- Consumer Demand: High prevalence of plant-based diets and health-conscious consumers.
- Industry Infrastructure: Advanced food processing capabilities and a well-developed supply chain.
- Regulatory Support: Government initiatives promoting healthy lifestyles and sustainable food choices.
- Market Share: These regions collectively account for over 60% of the global pea grits market.
- Growth Potential: Continued innovation in food technology and an expanding range of plant-based products ensure sustained growth.
While Poultry Feeds represent a significant and growing application, and Yellow Pea Grits often hold a larger market share due to processing efficiencies, the innovation and consumer-driven demand within Food Processing currently positions it as the primary growth engine. The Household segment is also showing promising growth as consumers explore pulse-based ingredients for home cooking, further solidifying the importance of pea grits in the broader food landscape.
Pea Grits Product Landscape
The pea grits product landscape is characterized by ongoing innovation focused on enhancing functionality and expanding application versatility. Innovations include advanced milling techniques to achieve finer textures for smoother food formulations and specialized processing to improve protein digestibility and reduce anti-nutritional factors. Unique selling propositions often revolve around the high protein and fiber content, gluten-free nature, and neutral flavor profile of pea grits, making them ideal for a wide range of food products. Technological advancements are enabling pea grits to replace or supplement traditional ingredients like wheat flour and starches in applications such as baked goods, pasta, and extruded snacks, offering a healthier and more sustainable alternative.
Key Drivers, Barriers & Challenges in Pea Grits
Key Drivers:
- Growing Demand for Plant-Based Proteins: Consumers are increasingly seeking non-animal protein sources due to health and environmental concerns.
- Nutritional Benefits: Pea grits are rich in protein, fiber, and essential nutrients, appealing to health-conscious consumers and animal feed formulators.
- Sustainability: Pea cultivation is generally more environmentally friendly than many other protein crops, with lower water and land requirements.
- Versatility: Pea grits can be used in a wide array of food products and animal feed applications.
Barriers & Challenges:
- Supply Chain Volatility: Crop yields can be affected by weather patterns, pests, and diseases, leading to price fluctuations.
- Processing Costs: Efficient and high-quality processing of pea grits can be complex and require specialized equipment.
- Consumer Perception: Some consumers may still associate pulses with traditional diets, requiring education on modern applications.
- Competition: Intense competition from other plant-based protein sources and conventional ingredients.
- Regulatory Hurdles: Navigating varying food safety and labeling regulations across different regions can be challenging. (Estimated Impact: 5-10% of market growth potential constrained).
Emerging Opportunities in Pea Grits
Emerging opportunities in the pea grits sector lie in untapped markets, particularly in developing economies where plant-based diets are gaining traction. Innovative applications are surfacing in the functional food space, such as fortified snacks and beverages, and in the pet food industry, offering premium, protein-rich alternatives. Evolving consumer preferences for clean-label, allergen-free, and sustainably sourced ingredients present a significant avenue for growth. The development of pea protein isolates and concentrates derived from pea grits offers further potential in high-value applications.
Growth Accelerators in the Pea Grits Industry
Several catalysts are accelerating the long-term growth of the pea grits industry. Technological breakthroughs in pulse processing, leading to improved functionality and cost-effectiveness, are a major driver. Strategic partnerships between pulse processors and food manufacturers are facilitating product development and market penetration. Furthermore, market expansion strategies targeting emerging economies and catering to specific dietary needs, such as gluten-free or high-protein diets, are critical growth accelerators. The increasing investment in R&D for novel pulse-based ingredients also fuels sustained expansion.
Key Players Shaping the Pea Pea Grits Market
- Martino Rossi SpA
- Avena Foods, Limited
- Best Cooking Pulses.Inc.
- ADM
- Ingredion.
- AGT Food and Ingredients
- ANCHOR INGREDIENTS
- Agspring, LLC
- The Scoular Company
- SunOpta.
- EHL Limited
- Batory Foods.
- Diefenbaker Spice & Pulse.
Notable Milestones in Pea Grits Sector
- 2021: Significant investment in pea protein processing technology by ADM to enhance production capacity.
- 2022: Launch of innovative pea grit-based snacks by a major food manufacturer, targeting health-conscious millennials.
- 2023: Ingredion. expands its plant-based ingredient portfolio, including pea grits, through strategic partnerships.
- 2024: Increased adoption of pea grits in poultry feed formulations for improved animal health and reduced reliance on soy.
- 2025 (Estimated): Introduction of novel pea grit derivatives with enhanced functionalities for specialized food applications.
In-Depth Pea Grits Market Outlook
The future outlook for the pea grits market is exceptionally promising, driven by a confluence of strong growth accelerators. The ongoing shift towards sustainable and plant-based diets, coupled with increasing awareness of the nutritional benefits of pulses, will continue to fuel demand across food processing and animal feed sectors. Innovations in processing technology and product development are expected to unlock new applications and enhance market penetration. Strategic collaborations and expanding market reach into underserved regions will further solidify its position as a key ingredient in the global food system. The market is projected to witness continued robust growth, offering significant opportunities for stakeholders who can leverage these trends.
Pea Grits Segmentation
-
1. Application
- 1.1. Food Processing
- 1.2. Poultry Feeds
- 1.3. Food Services
- 1.4. Households
- 1.5. Others
-
2. Type
- 2.1. Green Pea Grits
- 2.2. Yellow Pea Grits
Pea Grits Segmentation By Geography
-
1. North America
- 1.1. United States
- 1.2. Canada
- 1.3. Mexico
-
2. South America
- 2.1. Brazil
- 2.2. Argentina
- 2.3. Rest of South America
-
3. Europe
- 3.1. United Kingdom
- 3.2. Germany
- 3.3. France
- 3.4. Italy
- 3.5. Spain
- 3.6. Russia
- 3.7. Benelux
- 3.8. Nordics
- 3.9. Rest of Europe
-
4. Middle East & Africa
- 4.1. Turkey
- 4.2. Israel
- 4.3. GCC
- 4.4. North Africa
- 4.5. South Africa
- 4.6. Rest of Middle East & Africa
-
5. Asia Pacific
- 5.1. China
- 5.2. India
- 5.3. Japan
- 5.4. South Korea
- 5.5. ASEAN
- 5.6. Oceania
- 5.7. Rest of Asia Pacific
Pea Grits Regional Market Share
Geographic Coverage of Pea Grits
Pea Grits REPORT HIGHLIGHTS
| Aspects | Details |
|---|---|
| Study Period | 2020-2034 |
| Base Year | 2025 |
| Estimated Year | 2026 |
| Forecast Period | 2026-2034 |
| Historical Period | 2020-2025 |
| Growth Rate | CAGR of 5.8% from 2020-2034 |
| Segmentation |
|
Table of Contents
- 1. Introduction
- 1.1. Research Scope
- 1.2. Market Segmentation
- 1.3. Research Methodology
- 1.4. Definitions and Assumptions
- 2. Executive Summary
- 2.1. Introduction
- 3. Market Dynamics
- 3.1. Introduction
- 3.2. Market Drivers
- 3.3. Market Restrains
- 3.4. Market Trends
- 4. Market Factor Analysis
- 4.1. Porters Five Forces
- 4.2. Supply/Value Chain
- 4.3. PESTEL analysis
- 4.4. Market Entropy
- 4.5. Patent/Trademark Analysis
- 5. Global Pea Grits Analysis, Insights and Forecast, 2020-2032
- 5.1. Market Analysis, Insights and Forecast - by Application
- 5.1.1. Food Processing
- 5.1.2. Poultry Feeds
- 5.1.3. Food Services
- 5.1.4. Households
- 5.1.5. Others
- 5.2. Market Analysis, Insights and Forecast - by Type
- 5.2.1. Green Pea Grits
- 5.2.2. Yellow Pea Grits
- 5.3. Market Analysis, Insights and Forecast - by Region
- 5.3.1. North America
- 5.3.2. South America
- 5.3.3. Europe
- 5.3.4. Middle East & Africa
- 5.3.5. Asia Pacific
- 5.1. Market Analysis, Insights and Forecast - by Application
- 6. North America Pea Grits Analysis, Insights and Forecast, 2020-2032
- 6.1. Market Analysis, Insights and Forecast - by Application
- 6.1.1. Food Processing
- 6.1.2. Poultry Feeds
- 6.1.3. Food Services
- 6.1.4. Households
- 6.1.5. Others
- 6.2. Market Analysis, Insights and Forecast - by Type
- 6.2.1. Green Pea Grits
- 6.2.2. Yellow Pea Grits
- 6.1. Market Analysis, Insights and Forecast - by Application
- 7. South America Pea Grits Analysis, Insights and Forecast, 2020-2032
- 7.1. Market Analysis, Insights and Forecast - by Application
- 7.1.1. Food Processing
- 7.1.2. Poultry Feeds
- 7.1.3. Food Services
- 7.1.4. Households
- 7.1.5. Others
- 7.2. Market Analysis, Insights and Forecast - by Type
- 7.2.1. Green Pea Grits
- 7.2.2. Yellow Pea Grits
- 7.1. Market Analysis, Insights and Forecast - by Application
- 8. Europe Pea Grits Analysis, Insights and Forecast, 2020-2032
- 8.1. Market Analysis, Insights and Forecast - by Application
- 8.1.1. Food Processing
- 8.1.2. Poultry Feeds
- 8.1.3. Food Services
- 8.1.4. Households
- 8.1.5. Others
- 8.2. Market Analysis, Insights and Forecast - by Type
- 8.2.1. Green Pea Grits
- 8.2.2. Yellow Pea Grits
- 8.1. Market Analysis, Insights and Forecast - by Application
- 9. Middle East & Africa Pea Grits Analysis, Insights and Forecast, 2020-2032
- 9.1. Market Analysis, Insights and Forecast - by Application
- 9.1.1. Food Processing
- 9.1.2. Poultry Feeds
- 9.1.3. Food Services
- 9.1.4. Households
- 9.1.5. Others
- 9.2. Market Analysis, Insights and Forecast - by Type
- 9.2.1. Green Pea Grits
- 9.2.2. Yellow Pea Grits
- 9.1. Market Analysis, Insights and Forecast - by Application
- 10. Asia Pacific Pea Grits Analysis, Insights and Forecast, 2020-2032
- 10.1. Market Analysis, Insights and Forecast - by Application
- 10.1.1. Food Processing
- 10.1.2. Poultry Feeds
- 10.1.3. Food Services
- 10.1.4. Households
- 10.1.5. Others
- 10.2. Market Analysis, Insights and Forecast - by Type
- 10.2.1. Green Pea Grits
- 10.2.2. Yellow Pea Grits
- 10.1. Market Analysis, Insights and Forecast - by Application
- 11. Competitive Analysis
- 11.1. Global Market Share Analysis 2025
- 11.2. Company Profiles
- 11.2.1 Martino Rossi SpA
- 11.2.1.1. Overview
- 11.2.1.2. Products
- 11.2.1.3. SWOT Analysis
- 11.2.1.4. Recent Developments
- 11.2.1.5. Financials (Based on Availability)
- 11.2.2 Avena Foods
- 11.2.2.1. Overview
- 11.2.2.2. Products
- 11.2.2.3. SWOT Analysis
- 11.2.2.4. Recent Developments
- 11.2.2.5. Financials (Based on Availability)
- 11.2.3 Limited
- 11.2.3.1. Overview
- 11.2.3.2. Products
- 11.2.3.3. SWOT Analysis
- 11.2.3.4. Recent Developments
- 11.2.3.5. Financials (Based on Availability)
- 11.2.4 Best Cooking Pulses.Inc.
- 11.2.4.1. Overview
- 11.2.4.2. Products
- 11.2.4.3. SWOT Analysis
- 11.2.4.4. Recent Developments
- 11.2.4.5. Financials (Based on Availability)
- 11.2.5 ADM
- 11.2.5.1. Overview
- 11.2.5.2. Products
- 11.2.5.3. SWOT Analysis
- 11.2.5.4. Recent Developments
- 11.2.5.5. Financials (Based on Availability)
- 11.2.6 Ingredion.
- 11.2.6.1. Overview
- 11.2.6.2. Products
- 11.2.6.3. SWOT Analysis
- 11.2.6.4. Recent Developments
- 11.2.6.5. Financials (Based on Availability)
- 11.2.7 AGT Food and Ingredients
- 11.2.7.1. Overview
- 11.2.7.2. Products
- 11.2.7.3. SWOT Analysis
- 11.2.7.4. Recent Developments
- 11.2.7.5. Financials (Based on Availability)
- 11.2.8 ANCHOR INGREDIENTS.Agspring
- 11.2.8.1. Overview
- 11.2.8.2. Products
- 11.2.8.3. SWOT Analysis
- 11.2.8.4. Recent Developments
- 11.2.8.5. Financials (Based on Availability)
- 11.2.9 LLC
- 11.2.9.1. Overview
- 11.2.9.2. Products
- 11.2.9.3. SWOT Analysis
- 11.2.9.4. Recent Developments
- 11.2.9.5. Financials (Based on Availability)
- 11.2.10 The Scoular Company
- 11.2.10.1. Overview
- 11.2.10.2. Products
- 11.2.10.3. SWOT Analysis
- 11.2.10.4. Recent Developments
- 11.2.10.5. Financials (Based on Availability)
- 11.2.11 SunOpta.
- 11.2.11.1. Overview
- 11.2.11.2. Products
- 11.2.11.3. SWOT Analysis
- 11.2.11.4. Recent Developments
- 11.2.11.5. Financials (Based on Availability)
- 11.2.12 EHL Limited
- 11.2.12.1. Overview
- 11.2.12.2. Products
- 11.2.12.3. SWOT Analysis
- 11.2.12.4. Recent Developments
- 11.2.12.5. Financials (Based on Availability)
- 11.2.13 Batory Foods.
- 11.2.13.1. Overview
- 11.2.13.2. Products
- 11.2.13.3. SWOT Analysis
- 11.2.13.4. Recent Developments
- 11.2.13.5. Financials (Based on Availability)
- 11.2.14 Diefenbaker Spice & Pulse.
- 11.2.14.1. Overview
- 11.2.14.2. Products
- 11.2.14.3. SWOT Analysis
- 11.2.14.4. Recent Developments
- 11.2.14.5. Financials (Based on Availability)
- 11.2.1 Martino Rossi SpA
List of Figures
- Figure 1: Global Pea Grits Revenue Breakdown (undefined, %) by Region 2025 & 2033
- Figure 2: Global Pea Grits Volume Breakdown (K, %) by Region 2025 & 2033
- Figure 3: North America Pea Grits Revenue (undefined), by Application 2025 & 2033
- Figure 4: North America Pea Grits Volume (K), by Application 2025 & 2033
- Figure 5: North America Pea Grits Revenue Share (%), by Application 2025 & 2033
- Figure 6: North America Pea Grits Volume Share (%), by Application 2025 & 2033
- Figure 7: North America Pea Grits Revenue (undefined), by Type 2025 & 2033
- Figure 8: North America Pea Grits Volume (K), by Type 2025 & 2033
- Figure 9: North America Pea Grits Revenue Share (%), by Type 2025 & 2033
- Figure 10: North America Pea Grits Volume Share (%), by Type 2025 & 2033
- Figure 11: North America Pea Grits Revenue (undefined), by Country 2025 & 2033
- Figure 12: North America Pea Grits Volume (K), by Country 2025 & 2033
- Figure 13: North America Pea Grits Revenue Share (%), by Country 2025 & 2033
- Figure 14: North America Pea Grits Volume Share (%), by Country 2025 & 2033
- Figure 15: South America Pea Grits Revenue (undefined), by Application 2025 & 2033
- Figure 16: South America Pea Grits Volume (K), by Application 2025 & 2033
- Figure 17: South America Pea Grits Revenue Share (%), by Application 2025 & 2033
- Figure 18: South America Pea Grits Volume Share (%), by Application 2025 & 2033
- Figure 19: South America Pea Grits Revenue (undefined), by Type 2025 & 2033
- Figure 20: South America Pea Grits Volume (K), by Type 2025 & 2033
- Figure 21: South America Pea Grits Revenue Share (%), by Type 2025 & 2033
- Figure 22: South America Pea Grits Volume Share (%), by Type 2025 & 2033
- Figure 23: South America Pea Grits Revenue (undefined), by Country 2025 & 2033
- Figure 24: South America Pea Grits Volume (K), by Country 2025 & 2033
- Figure 25: South America Pea Grits Revenue Share (%), by Country 2025 & 2033
- Figure 26: South America Pea Grits Volume Share (%), by Country 2025 & 2033
- Figure 27: Europe Pea Grits Revenue (undefined), by Application 2025 & 2033
- Figure 28: Europe Pea Grits Volume (K), by Application 2025 & 2033
- Figure 29: Europe Pea Grits Revenue Share (%), by Application 2025 & 2033
- Figure 30: Europe Pea Grits Volume Share (%), by Application 2025 & 2033
- Figure 31: Europe Pea Grits Revenue (undefined), by Type 2025 & 2033
- Figure 32: Europe Pea Grits Volume (K), by Type 2025 & 2033
- Figure 33: Europe Pea Grits Revenue Share (%), by Type 2025 & 2033
- Figure 34: Europe Pea Grits Volume Share (%), by Type 2025 & 2033
- Figure 35: Europe Pea Grits Revenue (undefined), by Country 2025 & 2033
- Figure 36: Europe Pea Grits Volume (K), by Country 2025 & 2033
- Figure 37: Europe Pea Grits Revenue Share (%), by Country 2025 & 2033
- Figure 38: Europe Pea Grits Volume Share (%), by Country 2025 & 2033
- Figure 39: Middle East & Africa Pea Grits Revenue (undefined), by Application 2025 & 2033
- Figure 40: Middle East & Africa Pea Grits Volume (K), by Application 2025 & 2033
- Figure 41: Middle East & Africa Pea Grits Revenue Share (%), by Application 2025 & 2033
- Figure 42: Middle East & Africa Pea Grits Volume Share (%), by Application 2025 & 2033
- Figure 43: Middle East & Africa Pea Grits Revenue (undefined), by Type 2025 & 2033
- Figure 44: Middle East & Africa Pea Grits Volume (K), by Type 2025 & 2033
- Figure 45: Middle East & Africa Pea Grits Revenue Share (%), by Type 2025 & 2033
- Figure 46: Middle East & Africa Pea Grits Volume Share (%), by Type 2025 & 2033
- Figure 47: Middle East & Africa Pea Grits Revenue (undefined), by Country 2025 & 2033
- Figure 48: Middle East & Africa Pea Grits Volume (K), by Country 2025 & 2033
- Figure 49: Middle East & Africa Pea Grits Revenue Share (%), by Country 2025 & 2033
- Figure 50: Middle East & Africa Pea Grits Volume Share (%), by Country 2025 & 2033
- Figure 51: Asia Pacific Pea Grits Revenue (undefined), by Application 2025 & 2033
- Figure 52: Asia Pacific Pea Grits Volume (K), by Application 2025 & 2033
- Figure 53: Asia Pacific Pea Grits Revenue Share (%), by Application 2025 & 2033
- Figure 54: Asia Pacific Pea Grits Volume Share (%), by Application 2025 & 2033
- Figure 55: Asia Pacific Pea Grits Revenue (undefined), by Type 2025 & 2033
- Figure 56: Asia Pacific Pea Grits Volume (K), by Type 2025 & 2033
- Figure 57: Asia Pacific Pea Grits Revenue Share (%), by Type 2025 & 2033
- Figure 58: Asia Pacific Pea Grits Volume Share (%), by Type 2025 & 2033
- Figure 59: Asia Pacific Pea Grits Revenue (undefined), by Country 2025 & 2033
- Figure 60: Asia Pacific Pea Grits Volume (K), by Country 2025 & 2033
- Figure 61: Asia Pacific Pea Grits Revenue Share (%), by Country 2025 & 2033
- Figure 62: Asia Pacific Pea Grits Volume Share (%), by Country 2025 & 2033
List of Tables
- Table 1: Global Pea Grits Revenue undefined Forecast, by Application 2020 & 2033
- Table 2: Global Pea Grits Volume K Forecast, by Application 2020 & 2033
- Table 3: Global Pea Grits Revenue undefined Forecast, by Type 2020 & 2033
- Table 4: Global Pea Grits Volume K Forecast, by Type 2020 & 2033
- Table 5: Global Pea Grits Revenue undefined Forecast, by Region 2020 & 2033
- Table 6: Global Pea Grits Volume K Forecast, by Region 2020 & 2033
- Table 7: Global Pea Grits Revenue undefined Forecast, by Application 2020 & 2033
- Table 8: Global Pea Grits Volume K Forecast, by Application 2020 & 2033
- Table 9: Global Pea Grits Revenue undefined Forecast, by Type 2020 & 2033
- Table 10: Global Pea Grits Volume K Forecast, by Type 2020 & 2033
- Table 11: Global Pea Grits Revenue undefined Forecast, by Country 2020 & 2033
- Table 12: Global Pea Grits Volume K Forecast, by Country 2020 & 2033
- Table 13: United States Pea Grits Revenue (undefined) Forecast, by Application 2020 & 2033
- Table 14: United States Pea Grits Volume (K) Forecast, by Application 2020 & 2033
- Table 15: Canada Pea Grits Revenue (undefined) Forecast, by Application 2020 & 2033
- Table 16: Canada Pea Grits Volume (K) Forecast, by Application 2020 & 2033
- Table 17: Mexico Pea Grits Revenue (undefined) Forecast, by Application 2020 & 2033
- Table 18: Mexico Pea Grits Volume (K) Forecast, by Application 2020 & 2033
- Table 19: Global Pea Grits Revenue undefined Forecast, by Application 2020 & 2033
- Table 20: Global Pea Grits Volume K Forecast, by Application 2020 & 2033
- Table 21: Global Pea Grits Revenue undefined Forecast, by Type 2020 & 2033
- Table 22: Global Pea Grits Volume K Forecast, by Type 2020 & 2033
- Table 23: Global Pea Grits Revenue undefined Forecast, by Country 2020 & 2033
- Table 24: Global Pea Grits Volume K Forecast, by Country 2020 & 2033
- Table 25: Brazil Pea Grits Revenue (undefined) Forecast, by Application 2020 & 2033
- Table 26: Brazil Pea Grits Volume (K) Forecast, by Application 2020 & 2033
- Table 27: Argentina Pea Grits Revenue (undefined) Forecast, by Application 2020 & 2033
- Table 28: Argentina Pea Grits Volume (K) Forecast, by Application 2020 & 2033
- Table 29: Rest of South America Pea Grits Revenue (undefined) Forecast, by Application 2020 & 2033
- Table 30: Rest of South America Pea Grits Volume (K) Forecast, by Application 2020 & 2033
- Table 31: Global Pea Grits Revenue undefined Forecast, by Application 2020 & 2033
- Table 32: Global Pea Grits Volume K Forecast, by Application 2020 & 2033
- Table 33: Global Pea Grits Revenue undefined Forecast, by Type 2020 & 2033
- Table 34: Global Pea Grits Volume K Forecast, by Type 2020 & 2033
- Table 35: Global Pea Grits Revenue undefined Forecast, by Country 2020 & 2033
- Table 36: Global Pea Grits Volume K Forecast, by Country 2020 & 2033
- Table 37: United Kingdom Pea Grits Revenue (undefined) Forecast, by Application 2020 & 2033
- Table 38: United Kingdom Pea Grits Volume (K) Forecast, by Application 2020 & 2033
- Table 39: Germany Pea Grits Revenue (undefined) Forecast, by Application 2020 & 2033
- Table 40: Germany Pea Grits Volume (K) Forecast, by Application 2020 & 2033
- Table 41: France Pea Grits Revenue (undefined) Forecast, by Application 2020 & 2033
- Table 42: France Pea Grits Volume (K) Forecast, by Application 2020 & 2033
- Table 43: Italy Pea Grits Revenue (undefined) Forecast, by Application 2020 & 2033
- Table 44: Italy Pea Grits Volume (K) Forecast, by Application 2020 & 2033
- Table 45: Spain Pea Grits Revenue (undefined) Forecast, by Application 2020 & 2033
- Table 46: Spain Pea Grits Volume (K) Forecast, by Application 2020 & 2033
- Table 47: Russia Pea Grits Revenue (undefined) Forecast, by Application 2020 & 2033
- Table 48: Russia Pea Grits Volume (K) Forecast, by Application 2020 & 2033
- Table 49: Benelux Pea Grits Revenue (undefined) Forecast, by Application 2020 & 2033
- Table 50: Benelux Pea Grits Volume (K) Forecast, by Application 2020 & 2033
- Table 51: Nordics Pea Grits Revenue (undefined) Forecast, by Application 2020 & 2033
- Table 52: Nordics Pea Grits Volume (K) Forecast, by Application 2020 & 2033
- Table 53: Rest of Europe Pea Grits Revenue (undefined) Forecast, by Application 2020 & 2033
- Table 54: Rest of Europe Pea Grits Volume (K) Forecast, by Application 2020 & 2033
- Table 55: Global Pea Grits Revenue undefined Forecast, by Application 2020 & 2033
- Table 56: Global Pea Grits Volume K Forecast, by Application 2020 & 2033
- Table 57: Global Pea Grits Revenue undefined Forecast, by Type 2020 & 2033
- Table 58: Global Pea Grits Volume K Forecast, by Type 2020 & 2033
- Table 59: Global Pea Grits Revenue undefined Forecast, by Country 2020 & 2033
- Table 60: Global Pea Grits Volume K Forecast, by Country 2020 & 2033
- Table 61: Turkey Pea Grits Revenue (undefined) Forecast, by Application 2020 & 2033
- Table 62: Turkey Pea Grits Volume (K) Forecast, by Application 2020 & 2033
- Table 63: Israel Pea Grits Revenue (undefined) Forecast, by Application 2020 & 2033
- Table 64: Israel Pea Grits Volume (K) Forecast, by Application 2020 & 2033
- Table 65: GCC Pea Grits Revenue (undefined) Forecast, by Application 2020 & 2033
- Table 66: GCC Pea Grits Volume (K) Forecast, by Application 2020 & 2033
- Table 67: North Africa Pea Grits Revenue (undefined) Forecast, by Application 2020 & 2033
- Table 68: North Africa Pea Grits Volume (K) Forecast, by Application 2020 & 2033
- Table 69: South Africa Pea Grits Revenue (undefined) Forecast, by Application 2020 & 2033
- Table 70: South Africa Pea Grits Volume (K) Forecast, by Application 2020 & 2033
- Table 71: Rest of Middle East & Africa Pea Grits Revenue (undefined) Forecast, by Application 2020 & 2033
- Table 72: Rest of Middle East & Africa Pea Grits Volume (K) Forecast, by Application 2020 & 2033
- Table 73: Global Pea Grits Revenue undefined Forecast, by Application 2020 & 2033
- Table 74: Global Pea Grits Volume K Forecast, by Application 2020 & 2033
- Table 75: Global Pea Grits Revenue undefined Forecast, by Type 2020 & 2033
- Table 76: Global Pea Grits Volume K Forecast, by Type 2020 & 2033
- Table 77: Global Pea Grits Revenue undefined Forecast, by Country 2020 & 2033
- Table 78: Global Pea Grits Volume K Forecast, by Country 2020 & 2033
- Table 79: China Pea Grits Revenue (undefined) Forecast, by Application 2020 & 2033
- Table 80: China Pea Grits Volume (K) Forecast, by Application 2020 & 2033
- Table 81: India Pea Grits Revenue (undefined) Forecast, by Application 2020 & 2033
- Table 82: India Pea Grits Volume (K) Forecast, by Application 2020 & 2033
- Table 83: Japan Pea Grits Revenue (undefined) Forecast, by Application 2020 & 2033
- Table 84: Japan Pea Grits Volume (K) Forecast, by Application 2020 & 2033
- Table 85: South Korea Pea Grits Revenue (undefined) Forecast, by Application 2020 & 2033
- Table 86: South Korea Pea Grits Volume (K) Forecast, by Application 2020 & 2033
- Table 87: ASEAN Pea Grits Revenue (undefined) Forecast, by Application 2020 & 2033
- Table 88: ASEAN Pea Grits Volume (K) Forecast, by Application 2020 & 2033
- Table 89: Oceania Pea Grits Revenue (undefined) Forecast, by Application 2020 & 2033
- Table 90: Oceania Pea Grits Volume (K) Forecast, by Application 2020 & 2033
- Table 91: Rest of Asia Pacific Pea Grits Revenue (undefined) Forecast, by Application 2020 & 2033
- Table 92: Rest of Asia Pacific Pea Grits Volume (K) Forecast, by Application 2020 & 2033
Frequently Asked Questions
1. What is the projected Compound Annual Growth Rate (CAGR) of the Pea Grits?
The projected CAGR is approximately 5.8%.
2. Which companies are prominent players in the Pea Grits?
Key companies in the market include Martino Rossi SpA, Avena Foods, Limited, Best Cooking Pulses.Inc., ADM, Ingredion., AGT Food and Ingredients, ANCHOR INGREDIENTS.Agspring, LLC, The Scoular Company, SunOpta., EHL Limited, Batory Foods., Diefenbaker Spice & Pulse..
3. What are the main segments of the Pea Grits?
The market segments include Application, Type.
4. Can you provide details about the market size?
The market size is estimated to be USD XXX N/A as of 2022.
5. What are some drivers contributing to market growth?
N/A
6. What are the notable trends driving market growth?
N/A
7. Are there any restraints impacting market growth?
N/A
8. Can you provide examples of recent developments in the market?
N/A
9. What pricing options are available for accessing the report?
Pricing options include single-user, multi-user, and enterprise licenses priced at USD 3950.00, USD 5925.00, and USD 7900.00 respectively.
10. Is the market size provided in terms of value or volume?
The market size is provided in terms of value, measured in N/A and volume, measured in K.
11. Are there any specific market keywords associated with the report?
Yes, the market keyword associated with the report is "Pea Grits," which aids in identifying and referencing the specific market segment covered.
12. How do I determine which pricing option suits my needs best?
The pricing options vary based on user requirements and access needs. Individual users may opt for single-user licenses, while businesses requiring broader access may choose multi-user or enterprise licenses for cost-effective access to the report.
13. Are there any additional resources or data provided in the Pea Grits report?
While the report offers comprehensive insights, it's advisable to review the specific contents or supplementary materials provided to ascertain if additional resources or data are available.
14. How can I stay updated on further developments or reports in the Pea Grits?
To stay informed about further developments, trends, and reports in the Pea Grits, consider subscribing to industry newsletters, following relevant companies and organizations, or regularly checking reputable industry news sources and publications.
Methodology
Step 1 - Identification of Relevant Samples Size from Population Database


Step 2 - Approaches for Defining Global Market Size (Value, Volume* & Price*)

Note*: In applicable scenarios
Step 3 - Data Sources
Primary Research
- Web Analytics
- Survey Reports
- Research Institute
- Latest Research Reports
- Opinion Leaders
Secondary Research
- Annual Reports
- White Paper
- Latest Press Release
- Industry Association
- Paid Database
- Investor Presentations

Step 4 - Data Triangulation
Involves using different sources of information in order to increase the validity of a study
These sources are likely to be stakeholders in a program - participants, other researchers, program staff, other community members, and so on.
Then we put all data in single framework & apply various statistical tools to find out the dynamic on the market.
During the analysis stage, feedback from the stakeholder groups would be compared to determine areas of agreement as well as areas of divergence