

Key Insights
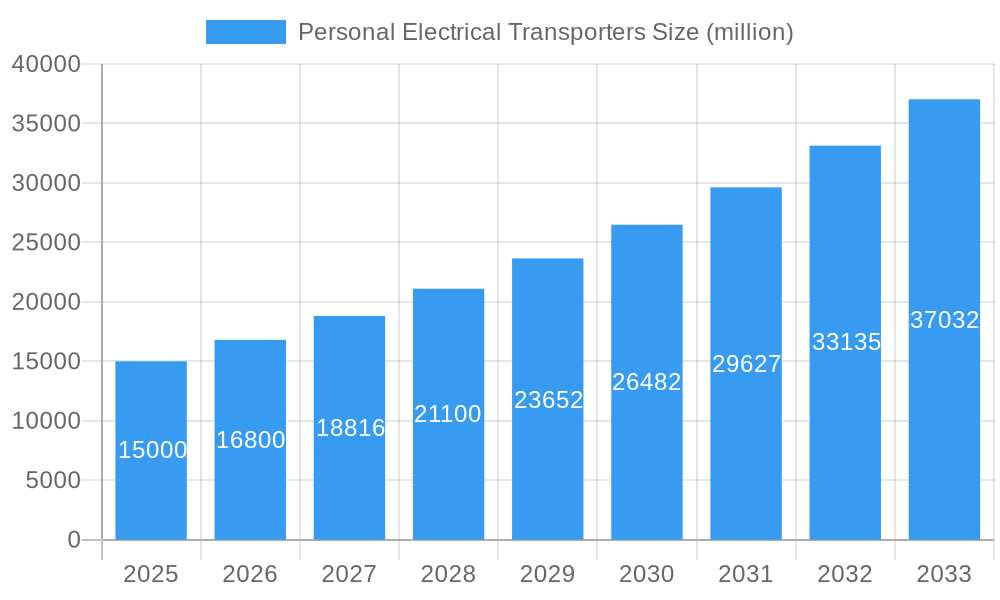
The global market for personal electric transporters (PETs), encompassing e-scooters, e-bikes, e-skateboards, and other similar vehicles, is experiencing robust growth, driven by increasing environmental concerns, rising fuel prices, and the growing popularity of micromobility solutions in urban areas. The market, estimated at $15 billion in 2025, is projected to exhibit a Compound Annual Growth Rate (CAGR) of 12% from 2025 to 2033, reaching approximately $45 billion by 2033. This growth is fueled by several key trends, including advancements in battery technology leading to longer ranges and faster charging times, the increasing adoption of shared mobility services utilizing PETs, and supportive government policies promoting sustainable transportation. However, challenges remain, such as safety concerns related to accidents and regulations surrounding the operation of PETs in public spaces. Further market segmentation reveals a strong demand for higher-performance models with advanced features, creating opportunities for manufacturers to innovate and cater to diverse customer preferences. The competitive landscape is characterized by a mix of established automotive manufacturers and specialized PET companies, all vying for market share in this rapidly expanding sector.
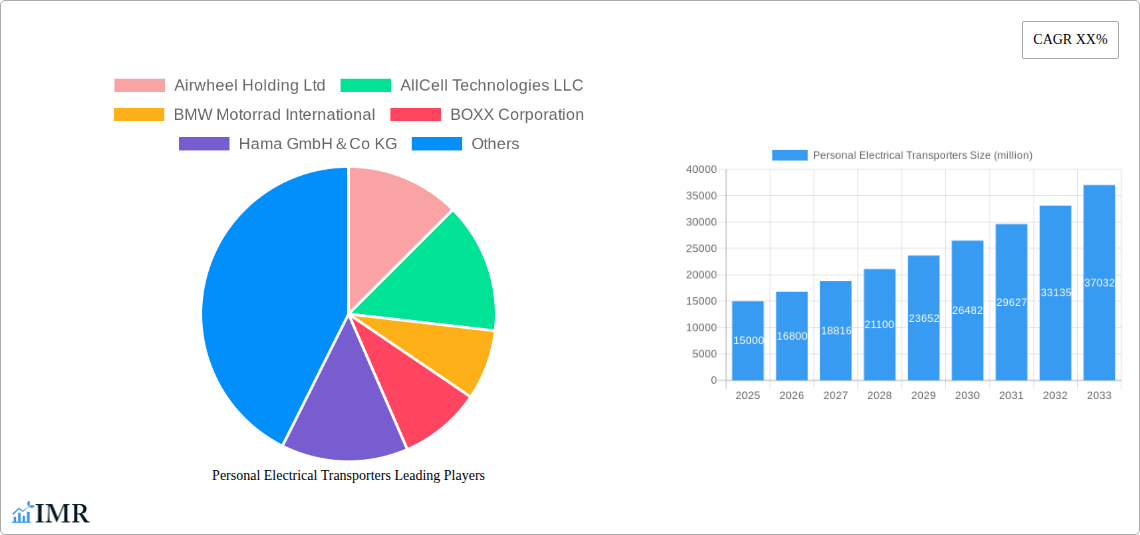
Personal Electrical Transporters Market Size (In Billion)
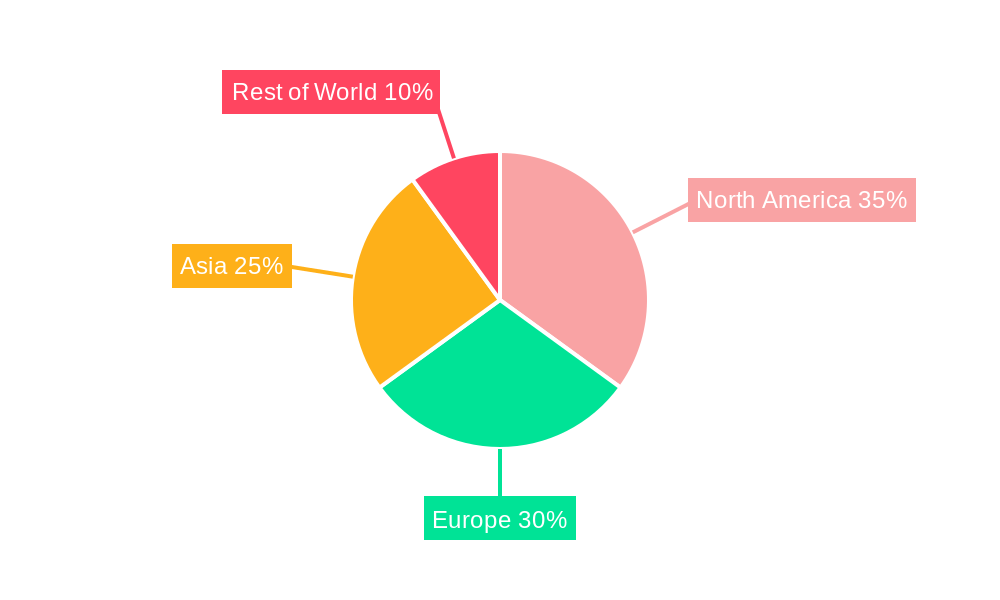
The key players in this market, including Airwheel, AllCell, BMW, BOXX, Honda, Ninebot, Razor, and others, are strategically investing in research and development to improve product design, enhance battery technology, and expand their distribution networks. Geographic variations in market penetration are significant, with developed economies in North America and Europe leading the adoption of PETs, while emerging markets in Asia and Latin America show significant growth potential. This diverse market presents both opportunities and challenges, demanding a sophisticated understanding of consumer preferences, technological advancements, and regulatory frameworks to achieve long-term success. Strategic partnerships and acquisitions are also expected to play an increasingly important role in shaping the market landscape in the coming years.
Personal Electrical Transporters Company Market Share
Personal Electrical Transporters Market Report: 2019-2033
This comprehensive report provides a detailed analysis of the Personal Electrical Transporters (PET) market, encompassing its dynamics, growth trends, regional segmentation, product landscape, key players, and future outlook. The study period covers 2019-2033, with 2025 as the base and estimated year. The forecast period is 2025-2033, and the historical period is 2019-2024. This report is crucial for industry professionals, investors, and stakeholders seeking to understand and capitalize on opportunities within this rapidly evolving market. The parent market is considered to be the broader micro-mobility sector, while the child market is specifically focused on personal electric vehicles for individual transportation. The market size is projected to reach xx million units by 2033.
Personal Electrical Transporters Market Dynamics & Structure
The PET market exhibits a moderately concentrated structure, with several key players vying for market share. Technological innovation, particularly in battery technology and smart features, is a primary driver, alongside evolving regulatory frameworks impacting adoption rates and safety standards. Competitive substitutes include bicycles, scooters, and public transportation. End-user demographics are expanding to encompass a wider range of ages and socioeconomic groups. M&A activity remains moderate, with xx major deals recorded between 2019 and 2024.
- Market Concentration: Moderately concentrated, with top 5 players holding approximately xx% market share in 2024.
- Technological Innovation: Focus on improved battery life, enhanced safety features, and integration of smart technologies.
- Regulatory Frameworks: Varying regulations across regions impact adoption and standardization.
- Competitive Substitutes: Bicycles, e-scooters, public transportation present competition.
- End-User Demographics: Expanding to include a broader age range and socioeconomic groups.
- M&A Trends: xx major M&A deals between 2019 and 2024, indicating consolidation.
Personal Electrical Transporters Growth Trends & Insights
The PET market experienced significant growth during the historical period (2019-2024), driven by increasing urbanization, environmental concerns, and the convenience offered by these vehicles. The market size expanded from xx million units in 2019 to xx million units in 2024, demonstrating a CAGR of xx%. This growth trajectory is projected to continue throughout the forecast period (2025-2033), with a forecasted CAGR of xx%, reaching xx million units by 2033. Technological disruptions, such as advancements in battery technology and the integration of AI, are further accelerating market expansion. Consumer behavior is shifting towards sustainable and convenient transportation options, fueling demand. Market penetration rates are expected to increase significantly in developing economies.
Dominant Regions, Countries, or Segments in Personal Electrical Transporters
The [Region Name, e.g., Asia-Pacific] region currently dominates the PET market, accounting for approximately xx% of global sales in 2024. This dominance is attributable to several factors:
- Strong Economic Growth: High disposable incomes and rising urbanization in key markets like China and India.
- Favorable Government Policies: Incentives and subsidies promoting the adoption of electric vehicles.
- Extensive Infrastructure Development: Improved cycling infrastructure and dedicated lanes for PETs.
Other regions, such as [Region Name, e.g., North America] and [Region Name, e.g., Europe], are also exhibiting significant growth potential, driven by increasing environmental awareness and government regulations. [Specific country within a region, e.g., China] holds the largest market share within the dominant region.
Personal Electrical Transporters Product Landscape
The PET market offers a diverse range of products, encompassing e-bikes, e-scooters, e-skateboards, and other similar devices. Innovation focuses on improved battery technology, enhanced safety features (like integrated lights and braking systems), and smart functionalities (like GPS tracking and app integration). Unique selling propositions include portability, convenience, and environmental friendliness. Advancements in lightweight materials and foldable designs enhance portability and user experience.
Key Drivers, Barriers & Challenges in Personal Electrical Transporters
Key Drivers:
- Growing environmental concerns and government regulations promoting sustainable transportation.
- Increasing urbanization and traffic congestion in major cities.
- Technological advancements leading to improved battery life, performance, and safety features.
- Rising disposable incomes and changing consumer preferences towards convenient mobility solutions.
Key Challenges & Restraints:
- Safety concerns related to accidents and lack of proper infrastructure.
- High initial cost of purchasing PETs compared to traditional transportation modes.
- Battery range limitations and charging infrastructure challenges.
- Varying regulatory environments across different regions, impacting market standardization. Supply chain disruptions resulting in increased costs and potential shortages.
Emerging Opportunities in Personal Electrical Transporters
- Untapped markets in developing countries with burgeoning middle classes.
- Integration of PETs with smart city initiatives and last-mile delivery services.
- Development of innovative designs and functionalities catering to specific user needs (e.g., cargo e-bikes).
- Growing interest in shared mobility services incorporating PETs.
Growth Accelerators in the Personal Electrical Transporters Industry
Technological advancements, particularly in battery technology and lightweight materials, will significantly accelerate market growth. Strategic partnerships between PET manufacturers and technology companies will further enhance product development and market penetration. Expanding into new markets, especially in developing economies, presents substantial growth opportunities.
Key Players Shaping the Personal Electrical Transporters Market
- Airwheel Holding Ltd
- AllCell Technologies LLC
- BMW Motorrad International
- BOXX Corporation
- Hama GmbH&Co KG
- Honda Motor Co.Ltd
- Xinhui Xin-E-Vehicle
- Kiwano
- Ninebot Inc
- Razor USA LLC
- Jiangsu Xinri Electric Vehicle Co. Ltd
- Terra Motors Corporation
- Gogoro Inc
- Mahindra GenZe
- Vmoto Limited
Notable Milestones in Personal Electrical Transporters Sector
- 2020: Introduction of several models with improved battery life and safety features by leading manufacturers.
- 2021: Significant investment in R&D for next-generation battery technologies by several key players.
- 2022: Launch of several shared mobility programs incorporating PETs in major cities.
- 2023: Increased regulatory focus on safety standards and infrastructure development for PETs.
- 2024: Several strategic partnerships formed between PET manufacturers and technology companies.
In-Depth Personal Electrical Transporters Market Outlook
The PET market is poised for continued robust growth throughout the forecast period, driven by technological advancements, favorable government policies, and increasing consumer demand for sustainable transportation options. Strategic partnerships, market expansion into developing economies, and the development of innovative product features will be crucial for success in this dynamic market. The market's future potential is substantial, with ample opportunities for both established players and new entrants.
Personal Electrical Transporters Segmentation
-
1. Application
- 1.1. Transportation
- 1.2. Road Rescue
- 1.3. Other
-
2. Types
- 2.1. Electric Scooter
- 2.2. Electric Bike
- 2.3. Electric Skateboards
Personal Electrical Transporters Segmentation By Geography
-
1. North America
- 1.1. United States
- 1.2. Canada
- 1.3. Mexico
-
2. South America
- 2.1. Brazil
- 2.2. Argentina
- 2.3. Rest of South America
-
3. Europe
- 3.1. United Kingdom
- 3.2. Germany
- 3.3. France
- 3.4. Italy
- 3.5. Spain
- 3.6. Russia
- 3.7. Benelux
- 3.8. Nordics
- 3.9. Rest of Europe
-
4. Middle East & Africa
- 4.1. Turkey
- 4.2. Israel
- 4.3. GCC
- 4.4. North Africa
- 4.5. South Africa
- 4.6. Rest of Middle East & Africa
-
5. Asia Pacific
- 5.1. China
- 5.2. India
- 5.3. Japan
- 5.4. South Korea
- 5.5. ASEAN
- 5.6. Oceania
- 5.7. Rest of Asia Pacific
Personal Electrical Transporters Regional Market Share
Geographic Coverage of Personal Electrical Transporters
Personal Electrical Transporters REPORT HIGHLIGHTS
| Aspects | Details |
|---|---|
| Study Period | 2020-2034 |
| Base Year | 2025 |
| Estimated Year | 2026 |
| Forecast Period | 2026-2034 |
| Historical Period | 2020-2025 |
| Growth Rate | CAGR of XX% from 2020-2034 |
| Segmentation |
|
Table of Contents
- 1. Introduction
- 1.1. Research Scope
- 1.2. Market Segmentation
- 1.3. Research Objective
- 1.4. Definitions and Assumptions
- 2. Executive Summary
- 2.1. Market Snapshot
- 3. Market Dynamics
- 3.1. Market Drivers
- 3.2. Market Restrains
- 3.3. Market Trends
- 3.4. Market Opportunities
- 4. Market Factor Analysis
- 4.1. Porters Five Forces
- 4.1.1. Bargaining Power of Suppliers
- 4.1.2. Bargaining Power of Buyers
- 4.1.3. Threat of New Entrants
- 4.1.4. Threat of Substitutes
- 4.1.5. Competitive Rivalry
- 4.2. PESTEL analysis
- 4.3. BCG Analysis
- 4.3.1. Stars (High Growth, High Market Share)
- 4.3.2. Cash Cows (Low Growth, High Market Share)
- 4.3.3. Question Mark (High Growth, Low Market Share)
- 4.3.4. Dogs (Low Growth, Low Market Share)
- 4.4. Ansoff Matrix Analysis
- 4.5. Supply Chain Analysis
- 4.6. Regulatory Landscape
- 4.7. Current Market Potential and Opportunity Assessment (TAM–SAM–SOM Framework)
- 4.8. IMR Analyst Note
- 4.1. Porters Five Forces
- 5. Market Analysis, Insights and Forecast 2021-2033
- 5.1. Market Analysis, Insights and Forecast - by Application
- 5.1.1. Transportation
- 5.1.2. Road Rescue
- 5.1.3. Other
- 5.2. Market Analysis, Insights and Forecast - by Types
- 5.2.1. Electric Scooter
- 5.2.2. Electric Bike
- 5.2.3. Electric Skateboards
- 5.3. Market Analysis, Insights and Forecast - by Region
- 5.3.1. North America
- 5.3.2. South America
- 5.3.3. Europe
- 5.3.4. Middle East & Africa
- 5.3.5. Asia Pacific
- 5.1. Market Analysis, Insights and Forecast - by Application
- 6. Global Personal Electrical Transporters Analysis, Insights and Forecast, 2021-2033
- 6.1. Market Analysis, Insights and Forecast - by Application
- 6.1.1. Transportation
- 6.1.2. Road Rescue
- 6.1.3. Other
- 6.2. Market Analysis, Insights and Forecast - by Types
- 6.2.1. Electric Scooter
- 6.2.2. Electric Bike
- 6.2.3. Electric Skateboards
- 6.1. Market Analysis, Insights and Forecast - by Application
- 7. North America Personal Electrical Transporters Analysis, Insights and Forecast, 2020-2032
- 7.1. Market Analysis, Insights and Forecast - by Application
- 7.1.1. Transportation
- 7.1.2. Road Rescue
- 7.1.3. Other
- 7.2. Market Analysis, Insights and Forecast - by Types
- 7.2.1. Electric Scooter
- 7.2.2. Electric Bike
- 7.2.3. Electric Skateboards
- 7.1. Market Analysis, Insights and Forecast - by Application
- 8. South America Personal Electrical Transporters Analysis, Insights and Forecast, 2020-2032
- 8.1. Market Analysis, Insights and Forecast - by Application
- 8.1.1. Transportation
- 8.1.2. Road Rescue
- 8.1.3. Other
- 8.2. Market Analysis, Insights and Forecast - by Types
- 8.2.1. Electric Scooter
- 8.2.2. Electric Bike
- 8.2.3. Electric Skateboards
- 8.1. Market Analysis, Insights and Forecast - by Application
- 9. Europe Personal Electrical Transporters Analysis, Insights and Forecast, 2020-2032
- 9.1. Market Analysis, Insights and Forecast - by Application
- 9.1.1. Transportation
- 9.1.2. Road Rescue
- 9.1.3. Other
- 9.2. Market Analysis, Insights and Forecast - by Types
- 9.2.1. Electric Scooter
- 9.2.2. Electric Bike
- 9.2.3. Electric Skateboards
- 9.1. Market Analysis, Insights and Forecast - by Application
- 10. Middle East & Africa Personal Electrical Transporters Analysis, Insights and Forecast, 2020-2032
- 10.1. Market Analysis, Insights and Forecast - by Application
- 10.1.1. Transportation
- 10.1.2. Road Rescue
- 10.1.3. Other
- 10.2. Market Analysis, Insights and Forecast - by Types
- 10.2.1. Electric Scooter
- 10.2.2. Electric Bike
- 10.2.3. Electric Skateboards
- 10.1. Market Analysis, Insights and Forecast - by Application
- 11. Asia Pacific Personal Electrical Transporters Analysis, Insights and Forecast, 2020-2032
- 11.1. Market Analysis, Insights and Forecast - by Application
- 11.1.1. Transportation
- 11.1.2. Road Rescue
- 11.1.3. Other
- 11.2. Market Analysis, Insights and Forecast - by Types
- 11.2.1. Electric Scooter
- 11.2.2. Electric Bike
- 11.2.3. Electric Skateboards
- 11.1. Market Analysis, Insights and Forecast - by Application
- 12. Competitive Analysis
- 12.1. Company Profiles
- 12.1.1 Airwheel Holding Ltd
- 12.1.1.1. Company Overview
- 12.1.1.2. Products
- 12.1.1.3. Company Financials
- 12.1.1.4. SWOT Analysis
- 12.1.2 AllCell Technologies LLC
- 12.1.2.1. Company Overview
- 12.1.2.2. Products
- 12.1.2.3. Company Financials
- 12.1.2.4. SWOT Analysis
- 12.1.3 BMW Motorrad International
- 12.1.3.1. Company Overview
- 12.1.3.2. Products
- 12.1.3.3. Company Financials
- 12.1.3.4. SWOT Analysis
- 12.1.4 BOXX Corporation
- 12.1.4.1. Company Overview
- 12.1.4.2. Products
- 12.1.4.3. Company Financials
- 12.1.4.4. SWOT Analysis
- 12.1.5 Hama GmbH&Co KG
- 12.1.5.1. Company Overview
- 12.1.5.2. Products
- 12.1.5.3. Company Financials
- 12.1.5.4. SWOT Analysis
- 12.1.6 Honda Motor Co.Ltd
- 12.1.6.1. Company Overview
- 12.1.6.2. Products
- 12.1.6.3. Company Financials
- 12.1.6.4. SWOT Analysis
- 12.1.7 Xinhui Xin-E-Vehicle
- 12.1.7.1. Company Overview
- 12.1.7.2. Products
- 12.1.7.3. Company Financials
- 12.1.7.4. SWOT Analysis
- 12.1.8 Kiwano
- 12.1.8.1. Company Overview
- 12.1.8.2. Products
- 12.1.8.3. Company Financials
- 12.1.8.4. SWOT Analysis
- 12.1.9 Ninebot Inc
- 12.1.9.1. Company Overview
- 12.1.9.2. Products
- 12.1.9.3. Company Financials
- 12.1.9.4. SWOT Analysis
- 12.1.10 Razor USA LLC
- 12.1.10.1. Company Overview
- 12.1.10.2. Products
- 12.1.10.3. Company Financials
- 12.1.10.4. SWOT Analysis
- 12.1.11 Jiangsu Xinri Electric Vehicle Co. Ltd
- 12.1.11.1. Company Overview
- 12.1.11.2. Products
- 12.1.11.3. Company Financials
- 12.1.11.4. SWOT Analysis
- 12.1.12 Terra Motors Corporation
- 12.1.12.1. Company Overview
- 12.1.12.2. Products
- 12.1.12.3. Company Financials
- 12.1.12.4. SWOT Analysis
- 12.1.13 Gogoro Inc
- 12.1.13.1. Company Overview
- 12.1.13.2. Products
- 12.1.13.3. Company Financials
- 12.1.13.4. SWOT Analysis
- 12.1.14 Mahindra GenZe
- 12.1.14.1. Company Overview
- 12.1.14.2. Products
- 12.1.14.3. Company Financials
- 12.1.14.4. SWOT Analysis
- 12.1.15 Vmoto Limited
- 12.1.15.1. Company Overview
- 12.1.15.2. Products
- 12.1.15.3. Company Financials
- 12.1.15.4. SWOT Analysis
- 12.1.1 Airwheel Holding Ltd
- 12.2. Market Entropy
- 12.2.1 Company's Key Areas Served
- 12.2.2 Recent Developments
- 12.3. Company Market Share Analysis 2025
- 12.3.1 Top 5 Companies Market Share Analysis
- 12.3.2 Top 3 Companies Market Share Analysis
- 12.4. List of Potential Customers
- 13. Research Methodology
List of Figures
- Figure 1: Global Personal Electrical Transporters Revenue Breakdown (million, %) by Region 2025 & 2033
- Figure 2: Global Personal Electrical Transporters Volume Breakdown (K, %) by Region 2025 & 2033
- Figure 3: North America Personal Electrical Transporters Revenue (million), by Application 2025 & 2033
- Figure 4: North America Personal Electrical Transporters Volume (K), by Application 2025 & 2033
- Figure 5: North America Personal Electrical Transporters Revenue Share (%), by Application 2025 & 2033
- Figure 6: North America Personal Electrical Transporters Volume Share (%), by Application 2025 & 2033
- Figure 7: North America Personal Electrical Transporters Revenue (million), by Types 2025 & 2033
- Figure 8: North America Personal Electrical Transporters Volume (K), by Types 2025 & 2033
- Figure 9: North America Personal Electrical Transporters Revenue Share (%), by Types 2025 & 2033
- Figure 10: North America Personal Electrical Transporters Volume Share (%), by Types 2025 & 2033
- Figure 11: North America Personal Electrical Transporters Revenue (million), by Country 2025 & 2033
- Figure 12: North America Personal Electrical Transporters Volume (K), by Country 2025 & 2033
- Figure 13: North America Personal Electrical Transporters Revenue Share (%), by Country 2025 & 2033
- Figure 14: North America Personal Electrical Transporters Volume Share (%), by Country 2025 & 2033
- Figure 15: South America Personal Electrical Transporters Revenue (million), by Application 2025 & 2033
- Figure 16: South America Personal Electrical Transporters Volume (K), by Application 2025 & 2033
- Figure 17: South America Personal Electrical Transporters Revenue Share (%), by Application 2025 & 2033
- Figure 18: South America Personal Electrical Transporters Volume Share (%), by Application 2025 & 2033
- Figure 19: South America Personal Electrical Transporters Revenue (million), by Types 2025 & 2033
- Figure 20: South America Personal Electrical Transporters Volume (K), by Types 2025 & 2033
- Figure 21: South America Personal Electrical Transporters Revenue Share (%), by Types 2025 & 2033
- Figure 22: South America Personal Electrical Transporters Volume Share (%), by Types 2025 & 2033
- Figure 23: South America Personal Electrical Transporters Revenue (million), by Country 2025 & 2033
- Figure 24: South America Personal Electrical Transporters Volume (K), by Country 2025 & 2033
- Figure 25: South America Personal Electrical Transporters Revenue Share (%), by Country 2025 & 2033
- Figure 26: South America Personal Electrical Transporters Volume Share (%), by Country 2025 & 2033
- Figure 27: Europe Personal Electrical Transporters Revenue (million), by Application 2025 & 2033
- Figure 28: Europe Personal Electrical Transporters Volume (K), by Application 2025 & 2033
- Figure 29: Europe Personal Electrical Transporters Revenue Share (%), by Application 2025 & 2033
- Figure 30: Europe Personal Electrical Transporters Volume Share (%), by Application 2025 & 2033
- Figure 31: Europe Personal Electrical Transporters Revenue (million), by Types 2025 & 2033
- Figure 32: Europe Personal Electrical Transporters Volume (K), by Types 2025 & 2033
- Figure 33: Europe Personal Electrical Transporters Revenue Share (%), by Types 2025 & 2033
- Figure 34: Europe Personal Electrical Transporters Volume Share (%), by Types 2025 & 2033
- Figure 35: Europe Personal Electrical Transporters Revenue (million), by Country 2025 & 2033
- Figure 36: Europe Personal Electrical Transporters Volume (K), by Country 2025 & 2033
- Figure 37: Europe Personal Electrical Transporters Revenue Share (%), by Country 2025 & 2033
- Figure 38: Europe Personal Electrical Transporters Volume Share (%), by Country 2025 & 2033
- Figure 39: Middle East & Africa Personal Electrical Transporters Revenue (million), by Application 2025 & 2033
- Figure 40: Middle East & Africa Personal Electrical Transporters Volume (K), by Application 2025 & 2033
- Figure 41: Middle East & Africa Personal Electrical Transporters Revenue Share (%), by Application 2025 & 2033
- Figure 42: Middle East & Africa Personal Electrical Transporters Volume Share (%), by Application 2025 & 2033
- Figure 43: Middle East & Africa Personal Electrical Transporters Revenue (million), by Types 2025 & 2033
- Figure 44: Middle East & Africa Personal Electrical Transporters Volume (K), by Types 2025 & 2033
- Figure 45: Middle East & Africa Personal Electrical Transporters Revenue Share (%), by Types 2025 & 2033
- Figure 46: Middle East & Africa Personal Electrical Transporters Volume Share (%), by Types 2025 & 2033
- Figure 47: Middle East & Africa Personal Electrical Transporters Revenue (million), by Country 2025 & 2033
- Figure 48: Middle East & Africa Personal Electrical Transporters Volume (K), by Country 2025 & 2033
- Figure 49: Middle East & Africa Personal Electrical Transporters Revenue Share (%), by Country 2025 & 2033
- Figure 50: Middle East & Africa Personal Electrical Transporters Volume Share (%), by Country 2025 & 2033
- Figure 51: Asia Pacific Personal Electrical Transporters Revenue (million), by Application 2025 & 2033
- Figure 52: Asia Pacific Personal Electrical Transporters Volume (K), by Application 2025 & 2033
- Figure 53: Asia Pacific Personal Electrical Transporters Revenue Share (%), by Application 2025 & 2033
- Figure 54: Asia Pacific Personal Electrical Transporters Volume Share (%), by Application 2025 & 2033
- Figure 55: Asia Pacific Personal Electrical Transporters Revenue (million), by Types 2025 & 2033
- Figure 56: Asia Pacific Personal Electrical Transporters Volume (K), by Types 2025 & 2033
- Figure 57: Asia Pacific Personal Electrical Transporters Revenue Share (%), by Types 2025 & 2033
- Figure 58: Asia Pacific Personal Electrical Transporters Volume Share (%), by Types 2025 & 2033
- Figure 59: Asia Pacific Personal Electrical Transporters Revenue (million), by Country 2025 & 2033
- Figure 60: Asia Pacific Personal Electrical Transporters Volume (K), by Country 2025 & 2033
- Figure 61: Asia Pacific Personal Electrical Transporters Revenue Share (%), by Country 2025 & 2033
- Figure 62: Asia Pacific Personal Electrical Transporters Volume Share (%), by Country 2025 & 2033
List of Tables
- Table 1: Global Personal Electrical Transporters Revenue million Forecast, by Application 2020 & 2033
- Table 2: Global Personal Electrical Transporters Volume K Forecast, by Application 2020 & 2033
- Table 3: Global Personal Electrical Transporters Revenue million Forecast, by Types 2020 & 2033
- Table 4: Global Personal Electrical Transporters Volume K Forecast, by Types 2020 & 2033
- Table 5: Global Personal Electrical Transporters Revenue million Forecast, by Region 2020 & 2033
- Table 6: Global Personal Electrical Transporters Volume K Forecast, by Region 2020 & 2033
- Table 7: Global Personal Electrical Transporters Revenue million Forecast, by Application 2020 & 2033
- Table 8: Global Personal Electrical Transporters Volume K Forecast, by Application 2020 & 2033
- Table 9: Global Personal Electrical Transporters Revenue million Forecast, by Types 2020 & 2033
- Table 10: Global Personal Electrical Transporters Volume K Forecast, by Types 2020 & 2033
- Table 11: Global Personal Electrical Transporters Revenue million Forecast, by Country 2020 & 2033
- Table 12: Global Personal Electrical Transporters Volume K Forecast, by Country 2020 & 2033
- Table 13: United States Personal Electrical Transporters Revenue (million) Forecast, by Application 2020 & 2033
- Table 14: United States Personal Electrical Transporters Volume (K) Forecast, by Application 2020 & 2033
- Table 15: Canada Personal Electrical Transporters Revenue (million) Forecast, by Application 2020 & 2033
- Table 16: Canada Personal Electrical Transporters Volume (K) Forecast, by Application 2020 & 2033
- Table 17: Mexico Personal Electrical Transporters Revenue (million) Forecast, by Application 2020 & 2033
- Table 18: Mexico Personal Electrical Transporters Volume (K) Forecast, by Application 2020 & 2033
- Table 19: Global Personal Electrical Transporters Revenue million Forecast, by Application 2020 & 2033
- Table 20: Global Personal Electrical Transporters Volume K Forecast, by Application 2020 & 2033
- Table 21: Global Personal Electrical Transporters Revenue million Forecast, by Types 2020 & 2033
- Table 22: Global Personal Electrical Transporters Volume K Forecast, by Types 2020 & 2033
- Table 23: Global Personal Electrical Transporters Revenue million Forecast, by Country 2020 & 2033
- Table 24: Global Personal Electrical Transporters Volume K Forecast, by Country 2020 & 2033
- Table 25: Brazil Personal Electrical Transporters Revenue (million) Forecast, by Application 2020 & 2033
- Table 26: Brazil Personal Electrical Transporters Volume (K) Forecast, by Application 2020 & 2033
- Table 27: Argentina Personal Electrical Transporters Revenue (million) Forecast, by Application 2020 & 2033
- Table 28: Argentina Personal Electrical Transporters Volume (K) Forecast, by Application 2020 & 2033
- Table 29: Rest of South America Personal Electrical Transporters Revenue (million) Forecast, by Application 2020 & 2033
- Table 30: Rest of South America Personal Electrical Transporters Volume (K) Forecast, by Application 2020 & 2033
- Table 31: Global Personal Electrical Transporters Revenue million Forecast, by Application 2020 & 2033
- Table 32: Global Personal Electrical Transporters Volume K Forecast, by Application 2020 & 2033
- Table 33: Global Personal Electrical Transporters Revenue million Forecast, by Types 2020 & 2033
- Table 34: Global Personal Electrical Transporters Volume K Forecast, by Types 2020 & 2033
- Table 35: Global Personal Electrical Transporters Revenue million Forecast, by Country 2020 & 2033
- Table 36: Global Personal Electrical Transporters Volume K Forecast, by Country 2020 & 2033
- Table 37: United Kingdom Personal Electrical Transporters Revenue (million) Forecast, by Application 2020 & 2033
- Table 38: United Kingdom Personal Electrical Transporters Volume (K) Forecast, by Application 2020 & 2033
- Table 39: Germany Personal Electrical Transporters Revenue (million) Forecast, by Application 2020 & 2033
- Table 40: Germany Personal Electrical Transporters Volume (K) Forecast, by Application 2020 & 2033
- Table 41: France Personal Electrical Transporters Revenue (million) Forecast, by Application 2020 & 2033
- Table 42: France Personal Electrical Transporters Volume (K) Forecast, by Application 2020 & 2033
- Table 43: Italy Personal Electrical Transporters Revenue (million) Forecast, by Application 2020 & 2033
- Table 44: Italy Personal Electrical Transporters Volume (K) Forecast, by Application 2020 & 2033
- Table 45: Spain Personal Electrical Transporters Revenue (million) Forecast, by Application 2020 & 2033
- Table 46: Spain Personal Electrical Transporters Volume (K) Forecast, by Application 2020 & 2033
- Table 47: Russia Personal Electrical Transporters Revenue (million) Forecast, by Application 2020 & 2033
- Table 48: Russia Personal Electrical Transporters Volume (K) Forecast, by Application 2020 & 2033
- Table 49: Benelux Personal Electrical Transporters Revenue (million) Forecast, by Application 2020 & 2033
- Table 50: Benelux Personal Electrical Transporters Volume (K) Forecast, by Application 2020 & 2033
- Table 51: Nordics Personal Electrical Transporters Revenue (million) Forecast, by Application 2020 & 2033
- Table 52: Nordics Personal Electrical Transporters Volume (K) Forecast, by Application 2020 & 2033
- Table 53: Rest of Europe Personal Electrical Transporters Revenue (million) Forecast, by Application 2020 & 2033
- Table 54: Rest of Europe Personal Electrical Transporters Volume (K) Forecast, by Application 2020 & 2033
- Table 55: Global Personal Electrical Transporters Revenue million Forecast, by Application 2020 & 2033
- Table 56: Global Personal Electrical Transporters Volume K Forecast, by Application 2020 & 2033
- Table 57: Global Personal Electrical Transporters Revenue million Forecast, by Types 2020 & 2033
- Table 58: Global Personal Electrical Transporters Volume K Forecast, by Types 2020 & 2033
- Table 59: Global Personal Electrical Transporters Revenue million Forecast, by Country 2020 & 2033
- Table 60: Global Personal Electrical Transporters Volume K Forecast, by Country 2020 & 2033
- Table 61: Turkey Personal Electrical Transporters Revenue (million) Forecast, by Application 2020 & 2033
- Table 62: Turkey Personal Electrical Transporters Volume (K) Forecast, by Application 2020 & 2033
- Table 63: Israel Personal Electrical Transporters Revenue (million) Forecast, by Application 2020 & 2033
- Table 64: Israel Personal Electrical Transporters Volume (K) Forecast, by Application 2020 & 2033
- Table 65: GCC Personal Electrical Transporters Revenue (million) Forecast, by Application 2020 & 2033
- Table 66: GCC Personal Electrical Transporters Volume (K) Forecast, by Application 2020 & 2033
- Table 67: North Africa Personal Electrical Transporters Revenue (million) Forecast, by Application 2020 & 2033
- Table 68: North Africa Personal Electrical Transporters Volume (K) Forecast, by Application 2020 & 2033
- Table 69: South Africa Personal Electrical Transporters Revenue (million) Forecast, by Application 2020 & 2033
- Table 70: South Africa Personal Electrical Transporters Volume (K) Forecast, by Application 2020 & 2033
- Table 71: Rest of Middle East & Africa Personal Electrical Transporters Revenue (million) Forecast, by Application 2020 & 2033
- Table 72: Rest of Middle East & Africa Personal Electrical Transporters Volume (K) Forecast, by Application 2020 & 2033
- Table 73: Global Personal Electrical Transporters Revenue million Forecast, by Application 2020 & 2033
- Table 74: Global Personal Electrical Transporters Volume K Forecast, by Application 2020 & 2033
- Table 75: Global Personal Electrical Transporters Revenue million Forecast, by Types 2020 & 2033
- Table 76: Global Personal Electrical Transporters Volume K Forecast, by Types 2020 & 2033
- Table 77: Global Personal Electrical Transporters Revenue million Forecast, by Country 2020 & 2033
- Table 78: Global Personal Electrical Transporters Volume K Forecast, by Country 2020 & 2033
- Table 79: China Personal Electrical Transporters Revenue (million) Forecast, by Application 2020 & 2033
- Table 80: China Personal Electrical Transporters Volume (K) Forecast, by Application 2020 & 2033
- Table 81: India Personal Electrical Transporters Revenue (million) Forecast, by Application 2020 & 2033
- Table 82: India Personal Electrical Transporters Volume (K) Forecast, by Application 2020 & 2033
- Table 83: Japan Personal Electrical Transporters Revenue (million) Forecast, by Application 2020 & 2033
- Table 84: Japan Personal Electrical Transporters Volume (K) Forecast, by Application 2020 & 2033
- Table 85: South Korea Personal Electrical Transporters Revenue (million) Forecast, by Application 2020 & 2033
- Table 86: South Korea Personal Electrical Transporters Volume (K) Forecast, by Application 2020 & 2033
- Table 87: ASEAN Personal Electrical Transporters Revenue (million) Forecast, by Application 2020 & 2033
- Table 88: ASEAN Personal Electrical Transporters Volume (K) Forecast, by Application 2020 & 2033
- Table 89: Oceania Personal Electrical Transporters Revenue (million) Forecast, by Application 2020 & 2033
- Table 90: Oceania Personal Electrical Transporters Volume (K) Forecast, by Application 2020 & 2033
- Table 91: Rest of Asia Pacific Personal Electrical Transporters Revenue (million) Forecast, by Application 2020 & 2033
- Table 92: Rest of Asia Pacific Personal Electrical Transporters Volume (K) Forecast, by Application 2020 & 2033
Frequently Asked Questions
1. What is the projected Compound Annual Growth Rate (CAGR) of the Personal Electrical Transporters?
The projected CAGR is approximately XX%.
2. Which companies are prominent players in the Personal Electrical Transporters?
Key companies in the market include Airwheel Holding Ltd, AllCell Technologies LLC, BMW Motorrad International, BOXX Corporation, Hama GmbH&Co KG, Honda Motor Co.Ltd, Xinhui Xin-E-Vehicle, Kiwano, Ninebot Inc, Razor USA LLC, Jiangsu Xinri Electric Vehicle Co. Ltd, Terra Motors Corporation, Gogoro Inc, Mahindra GenZe, Vmoto Limited.
3. What are the main segments of the Personal Electrical Transporters?
The market segments include Application, Types.
4. Can you provide details about the market size?
The market size is estimated to be USD XXX million as of 2022.
5. What are some drivers contributing to market growth?
N/A
6. What are the notable trends driving market growth?
N/A
7. Are there any restraints impacting market growth?
N/A
8. Can you provide examples of recent developments in the market?
N/A
9. What pricing options are available for accessing the report?
Pricing options include single-user, multi-user, and enterprise licenses priced at USD 3350.00, USD 5025.00, and USD 6700.00 respectively.
10. Is the market size provided in terms of value or volume?
The market size is provided in terms of value, measured in million and volume, measured in K.
11. Are there any specific market keywords associated with the report?
Yes, the market keyword associated with the report is "Personal Electrical Transporters," which aids in identifying and referencing the specific market segment covered.
12. How do I determine which pricing option suits my needs best?
The pricing options vary based on user requirements and access needs. Individual users may opt for single-user licenses, while businesses requiring broader access may choose multi-user or enterprise licenses for cost-effective access to the report.
13. Are there any additional resources or data provided in the Personal Electrical Transporters report?
While the report offers comprehensive insights, it's advisable to review the specific contents or supplementary materials provided to ascertain if additional resources or data are available.
14. How can I stay updated on further developments or reports in the Personal Electrical Transporters?
To stay informed about further developments, trends, and reports in the Personal Electrical Transporters, consider subscribing to industry newsletters, following relevant companies and organizations, or regularly checking reputable industry news sources and publications.
Methodology
Step 1 - Identification of Relevant Samples Size from Population Database


Step 2 - Approaches for Defining Global Market Size (Value, Volume* & Price*)

Note*: In applicable scenarios
Step 3 - Data Sources
Primary Research
- Web Analytics
- Survey Reports
- Research Institute
- Latest Research Reports
- Opinion Leaders
Secondary Research
- Annual Reports
- White Paper
- Latest Press Release
- Industry Association
- Paid Database
- Investor Presentations

Step 4 - Data Triangulation
Involves using different sources of information in order to increase the validity of a study
These sources are likely to be stakeholders in a program - participants, other researchers, program staff, other community members, and so on.
Then we put all data in single framework & apply various statistical tools to find out the dynamic on the market.
During the analysis stage, feedback from the stakeholder groups would be compared to determine areas of agreement as well as areas of divergence