

Key Insights
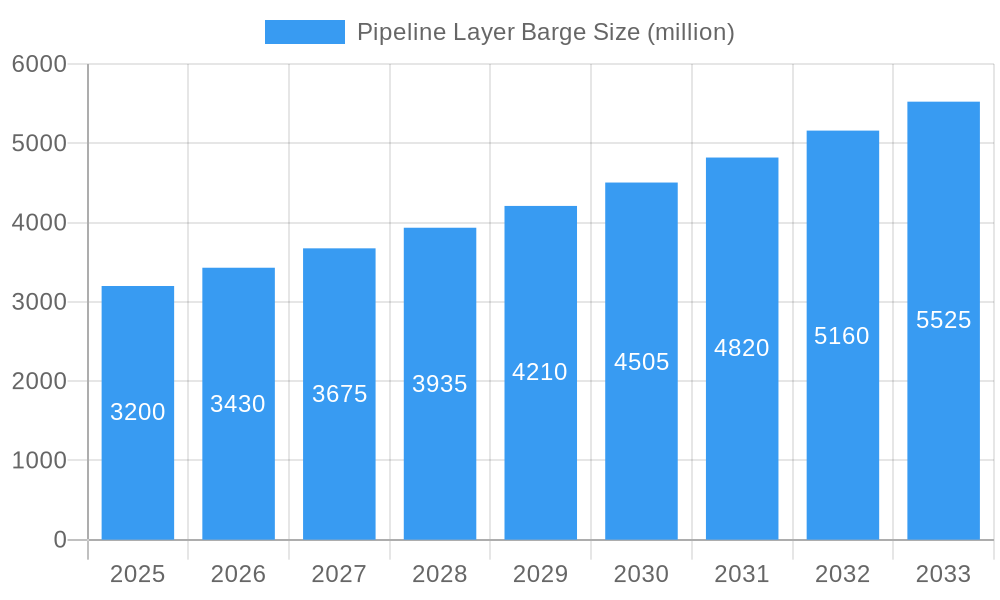
The global Pipeline Layer Barge market is poised for significant expansion, projected to reach approximately $3,200 million by the end of 2025. This growth is underpinned by a robust Compound Annual Growth Rate (CAGR) of around 7.5%, indicating a healthy and sustained upward trajectory for the sector throughout the forecast period ending in 2033. The primary engine driving this market momentum is the escalating demand for offshore energy exploration and infrastructure development, particularly within the Petroleum and Natural Gas sector. As nations continue to invest in securing energy supplies and expanding their continental shelf operations, the need for specialized vessels capable of laying pipelines in challenging deep-sea environments becomes paramount. The increasing complexity and depth of these offshore projects necessitate advanced and efficient pipeline installation solutions, directly benefiting the pipeline layer barge market. Furthermore, the growing emphasis on renewable energy infrastructure, such as offshore wind farms, which also require subsea pipeline installations for power transmission, presents a significant, albeit secondary, growth driver.
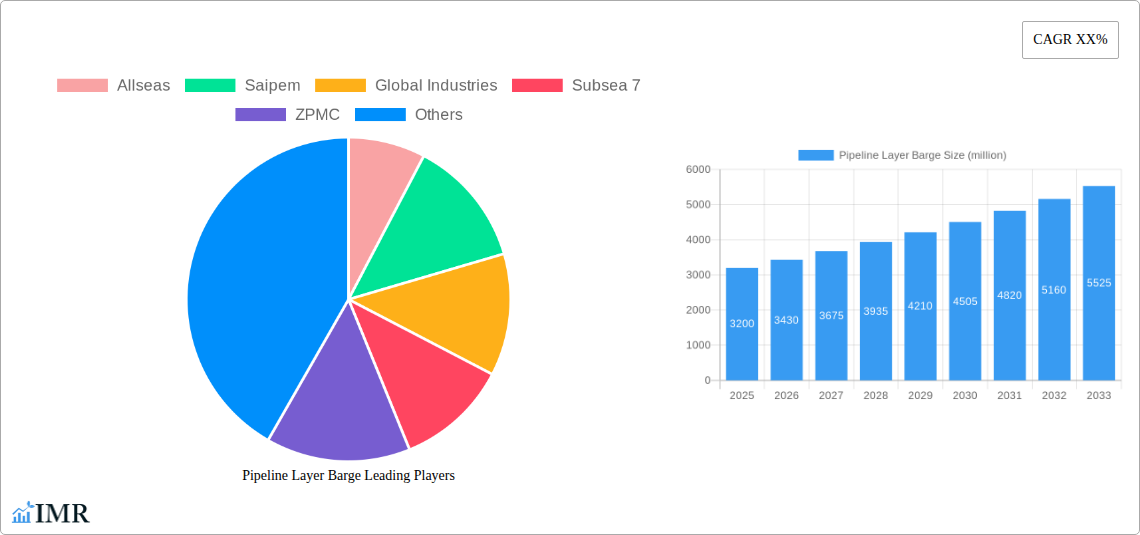
Pipeline Layer Barge Market Size (In Billion)
Despite the strong growth outlook, certain factors could moderate the market's pace. Stringent environmental regulations and the high operational costs associated with deep-sea pipeline laying pose considerable restraints. Companies must navigate complex permitting processes and invest heavily in technologically advanced, environmentally conscious equipment. However, the industry is actively addressing these challenges through innovation, developing more efficient and eco-friendly installation techniques. The market is broadly segmented by application into Deep Sea Operations, Petroleum and Natural Gas, and Others, with Petroleum and Natural Gas likely dominating due to existing infrastructure needs and ongoing exploration. In terms of type, S-Lay Pipeline Installation, Tow-In Pipeline Installation, and J-Lay Pipeline Installation represent the core methodologies, each suited to different operational requirements and water depths. Key players like Allseas, Saipem, and Subsea 7 are at the forefront, investing in cutting-edge technology and expanding their fleets to capture market share in this dynamic and capital-intensive industry.
Pipeline Layer Barge Company Market Share
Pipeline Layer Barge Market Analysis: Deep Dive into Offshore Infrastructure (2019-2033)
This comprehensive report provides an in-depth analysis of the global Pipeline Layer Barge market, a critical segment of the offshore oil and gas infrastructure industry. Covering the historical period from 2019 to 2024, the base year of 2025, and a robust forecast period extending to 2033, this report offers unparalleled insights for industry professionals, investors, and stakeholders. We meticulously examine market dynamics, growth trends, regional dominance, product innovations, key drivers, emerging opportunities, and the strategic landscape shaped by leading companies. This report is vital for understanding the evolving needs of Deep Sea Operations, Petroleum and Natural Gas extraction, and other crucial offshore applications, with a detailed breakdown of S-Lay Pipeline Installation, Tow-In Pipeline Installation, and J-Lay Pipeline Installation technologies.
Pipeline Layer Barge Market Dynamics & Structure
The pipeline layer barge market is characterized by a moderate to high level of concentration, with a few key players dominating the landscape. Technological innovation is a primary driver, with advancements in barge design, pipe-laying machinery, and digital integration enabling deeper water operations and more complex project executions. Regulatory frameworks, particularly those concerning environmental protection and offshore safety standards, significantly influence market entry and operational procedures. Competitive product substitutes are limited, as specialized pipeline layer barges offer unique capabilities for offshore infrastructure development. End-user demographics are primarily large oil and gas exploration and production companies, as well as major engineering, procurement, and construction (EPC) firms. Mergers and acquisitions (M&A) trends have been observed, with larger entities consolidating their market positions and expanding their service offerings.
- Market Concentration: Dominated by a few leading global EPC contractors with substantial investments in specialized fleets.
- Technological Innovation Drivers: Demand for deeper water installation, longer pipeline routes, and more efficient deployment methods.
- Regulatory Frameworks: Stringent environmental and safety regulations are critical for operational permits and market access.
- Competitive Product Substitutes: Limited due to the highly specialized nature and capital intensity of pipeline layer barges.
- End-User Demographics: Primarily major international oil companies (IOCs), national oil companies (NOCs), and large offshore EPC firms.
- M&A Trends: Consolidation of smaller players by larger companies to achieve economies of scale and broader service portfolios.
Pipeline Layer Barge Growth Trends & Insights
The global pipeline layer barge market is poised for significant expansion, driven by the sustained demand for energy infrastructure and the increasing complexity of offshore exploration and production projects. The market size is projected to grow from approximately $6,500 million in the historical period to an estimated $8,800 million by 2025, with a projected Compound Annual Growth Rate (CAGR) of around 5.8% during the forecast period of 2025–2033. This robust growth is fueled by ongoing investments in deepwater oil and gas fields, the need for enhanced subsea pipeline networks, and the development of new energy corridors. Adoption rates for advanced pipeline installation technologies, such as J-lay systems capable of handling increasingly large-diameter and high-pressure pipelines in extreme depths, are accelerating. Technological disruptions, including advancements in automation, robotics for subsea operations, and real-time data analytics for project management, are reshaping operational efficiencies and safety protocols. Shifts in consumer behavior are less direct but are influenced by the global push towards cleaner energy sources, which may lead to a diversification of pipeline applications beyond traditional oil and gas, such as carbon capture and storage (CCS) or hydrogen transportation infrastructure. The market penetration of specialized pipeline laying services is expected to deepen as projects become more technically demanding. Key metrics such as market size evolution, CAGR, and market penetration will be crucial for understanding this dynamic sector. The projected market value for 2033 is anticipated to reach $12,500 million.
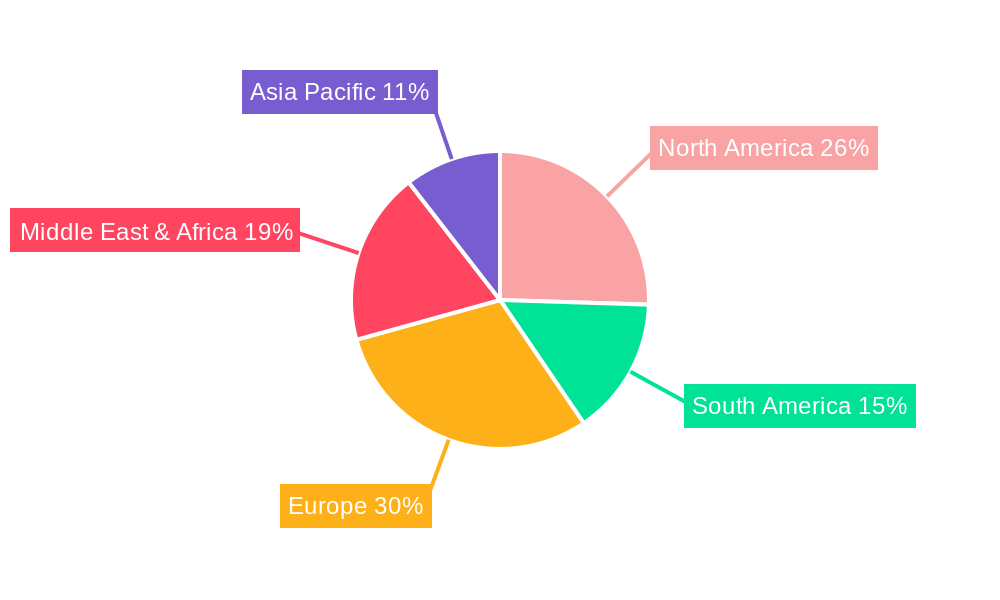
Dominant Regions, Countries, or Segments in Pipeline Layer Barge
The Petroleum and Natural Gas segment, particularly within Deep Sea Operations, is the undeniable driver of growth in the global pipeline layer barge market. This dominance is rooted in the continuous global demand for hydrocarbons and the strategic importance of offshore reserves in meeting this demand. Regions with significant offshore oil and gas exploration and production activities, such as the Asia-Pacific, North America (Gulf of Mexico), and the North Atlantic, are the key growth hubs.
In the Asia-Pacific region, countries like China, with its extensive coastline and growing energy needs, are making substantial investments in offshore infrastructure. The presence of major players like Sinopec Petroleum Engineering & Construction Shengli and CIMC Raffles, coupled with government initiatives supporting energy security, fuels the demand for advanced pipeline laying capabilities. The region’s burgeoning offshore oil and gas sector, combined with increasing investments in subsea pipeline networks for both domestic supply and international trade, positions it as a primary market.
North America, especially the U.S. Gulf of Mexico, remains a critical market due to its mature but still significant deepwater production. Companies like Subsea 7 and Global Industries are heavily involved in developing and maintaining extensive subsea pipeline infrastructure, requiring specialized vessels for S-Lay Pipeline Installation and J-Lay Pipeline Installation to accommodate increasingly challenging field developments.
The J-Lay Pipeline Installation type segment is experiencing particularly rapid growth. Its ability to install larger diameter pipelines in deeper waters and with greater precision makes it indispensable for many ultra-deepwater projects. This technological advantage directly supports the expansion of Deep Sea Operations. The market share for J-lay operations is steadily increasing as the industry pushes the boundaries of offshore exploration.
- Dominant Segment: Petroleum and Natural Gas Application, specifically Deep Sea Operations.
- Leading Regions: Asia-Pacific, North America (Gulf of Mexico), North Atlantic.
- Key Growth Drivers:
- Sustained global demand for oil and gas.
- Exploration and development of deepwater and ultra-deepwater reserves.
- Need for complex subsea pipeline networks for production and transportation.
- Government policies supporting energy security and infrastructure development.
- Technological advancements enabling operations in harsher environments.
- Dominant Type: J-Lay Pipeline Installation, driven by its efficiency in deep and ultra-deepwater applications.
- Market Share Analysis: The Petroleum and Natural Gas segment accounts for approximately 85% of the total market, with Deep Sea Operations representing a significant portion of that. J-Lay installation is projected to capture 45% of the installation type market by 2033.
Pipeline Layer Barge Product Landscape
The pipeline layer barge market is characterized by continuous innovation focused on enhancing operational efficiency, safety, and the capability to operate in increasingly challenging offshore environments. Modern pipeline layer barges are sophisticated vessels equipped with advanced pipe-handling systems, dynamic positioning capabilities, and integrated project management software. Key innovations include the development of ultra-deepwater J-lay towers capable of installing pipelines at depths exceeding 3,000 meters, and the integration of automated welding and inspection technologies to improve throughput and quality. The performance metrics emphasize pipe-laying speed, accuracy, vessel stability in adverse weather conditions, and the capacity to handle various pipeline diameters and wall thicknesses. Unique selling propositions often revolve around specialized capabilities, such as pipelaying in dynamically positioned modes for intricate subsea routing, or the ability to perform multiple operations like trenching and backfilling concurrently with installation.
Key Drivers, Barriers & Challenges in Pipeline Layer Barge
Key Drivers:
- Growing Global Energy Demand: Sustained need for oil and natural gas necessitates continued offshore exploration and pipeline infrastructure development.
- Deepwater Exploration and Production: The shift towards deeper offshore reserves requires specialized vessels like advanced pipeline layer barges.
- Technological Advancements: Innovations in barge design, installation methods (e.g., J-lay), and automation enhance efficiency and expand operational capabilities.
- Government Investments and Policies: Supportive policies for energy security and infrastructure development in various regions drive market growth.
- Aging Infrastructure Replacement: The need to replace aging subsea pipelines in mature offshore fields creates demand for new installation projects.
Barriers & Challenges:
- High Capital Expenditure: The immense cost of constructing and maintaining specialized pipeline layer barges limits new market entrants.
- Environmental Regulations: Stringent environmental compliance requirements can increase project costs and timelines.
- Geopolitical Instability: Political unrest in key energy-producing regions can disrupt investment and project execution.
- Volatile Oil and Gas Prices: Fluctuations in commodity prices directly impact the profitability and investment decisions in offshore projects.
- Skilled Labor Shortages: A limited pool of experienced personnel to operate and maintain these complex vessels poses a significant challenge.
- Supply Chain Disruptions: Delays in the procurement of specialized components and equipment can impact project schedules. The estimated impact of these challenges on market growth is approximately -2.0% annually.
Emerging Opportunities in Pipeline Layer Barge
Emerging opportunities in the pipeline layer barge sector are increasingly tied to the global energy transition and the expansion of subsea infrastructure beyond traditional oil and gas. The development of carbon capture and storage (CCS) projects presents a significant avenue for growth, requiring extensive subsea pipeline networks to transport captured CO2. Similarly, the burgeoning offshore wind sector, particularly the installation of inter-array cables and export cables, will necessitate specialized vessels with modified capabilities. Furthermore, the potential for hydrogen transportation via subsea pipelines offers a long-term opportunity. Growing investments in floating production, storage, and offloading (FPSO) facilities in remote and challenging environments also drive demand for complex pipeline connections. The digitalization of offshore operations, including the use of autonomous underwater vehicles (AUVs) for inspection and maintenance, coupled with advanced data analytics for real-time project monitoring, creates opportunities for service providers offering integrated solutions.
Growth Accelerators in the Pipeline Layer Barge Industry
Long-term growth in the pipeline layer barge industry will be significantly accelerated by breakthroughs in ultra-deepwater installation technology, enabling access to previously uneconomical reserves. Strategic partnerships between major EPC contractors, technology providers, and oil and gas companies will foster collaborative innovation and project execution. Market expansion into emerging offshore energy sectors, such as floating offshore wind farms and offshore hydrogen production facilities, will diversify revenue streams and drive demand for specialized services. The increasing adoption of modular construction techniques and pre-fabrication for subsea components will also streamline installation processes. Furthermore, the development of more sustainable and environmentally friendly installation practices will be crucial for maintaining social license to operate and attracting investment. The growing focus on life-of-field services, including the decommissioning of old platforms and the abandonment of wells, also presents opportunities for companies with versatile barge capabilities.
Key Players Shaping the Pipeline Layer Barge Market
- Allseas
- Saipem
- Global Industries
- Subsea 7
- ZPMC
- Daewoo
- Offshore Oil Engineering
- Sinopec Petroleum Engineering & Construction Shengli
- CIMC Raffles
- Van Oord
- Dredge Brokers
- Horizon Ship Brokers
Notable Milestones in Pipeline Layer Barge Sector
- 2019: Allseas' Pioneering Spirit successfully installs the world's largest ever offshore platform, marking a new era in heavy lift capabilities.
- 2020: Saipem secures a major contract for subsea pipeline installation in the challenging waters of the East Mediterranean, showcasing its deepwater expertise.
- 2021: Subsea 7 announces significant investments in upgrading its fleet for ultra-deepwater operations, including advanced J-lay capabilities.
- 2022: ZPMC delivers a state-of-the-art pipeline laying vessel to a leading Chinese offshore engineering company, bolstering regional capacity.
- 2023: CIMC Raffles launches a new generation of offshore construction vessels designed for enhanced efficiency and versatility in complex projects.
- 2024: Van Oord expands its offshore renewables services, demonstrating a strategic pivot towards new energy infrastructure that utilizes similar barge technologies.
- 2024: A significant consolidation trend begins with the acquisition of a smaller specialized barge operator by a major player, signaling industry maturation.
In-Depth Pipeline Layer Barge Market Outlook
The future of the pipeline layer barge market is exceptionally promising, driven by the indispensable role of subsea infrastructure in global energy supply and the burgeoning opportunities in new energy sectors. Growth accelerators such as advancements in ultra-deepwater technology, strategic alliances, and expansion into offshore wind and hydrogen transportation will ensure sustained demand. The industry's adaptation to digital transformation and a focus on sustainable practices will further solidify its long-term viability. Companies that can offer integrated solutions, embrace innovation, and navigate the evolving regulatory landscape are well-positioned for substantial growth. The projected market value for 2033 is $12,500 million, representing a significant expansion from current levels and underscoring the strategic importance of this sector.
Pipeline Layer Barge Segmentation
-
1. Application
- 1.1. Deep Sea Operations
- 1.2. Petroleum and Natural Gas
- 1.3. Others
-
2. Types
- 2.1. S-Lay Pipeline Installation
- 2.2. Tow-In Pipeline Installation
- 2.3. J-Lay Pipeline Installation
Pipeline Layer Barge Segmentation By Geography
-
1. North America
- 1.1. United States
- 1.2. Canada
- 1.3. Mexico
-
2. South America
- 2.1. Brazil
- 2.2. Argentina
- 2.3. Rest of South America
-
3. Europe
- 3.1. United Kingdom
- 3.2. Germany
- 3.3. France
- 3.4. Italy
- 3.5. Spain
- 3.6. Russia
- 3.7. Benelux
- 3.8. Nordics
- 3.9. Rest of Europe
-
4. Middle East & Africa
- 4.1. Turkey
- 4.2. Israel
- 4.3. GCC
- 4.4. North Africa
- 4.5. South Africa
- 4.6. Rest of Middle East & Africa
-
5. Asia Pacific
- 5.1. China
- 5.2. India
- 5.3. Japan
- 5.4. South Korea
- 5.5. ASEAN
- 5.6. Oceania
- 5.7. Rest of Asia Pacific
Pipeline Layer Barge Regional Market Share
Geographic Coverage of Pipeline Layer Barge
Pipeline Layer Barge REPORT HIGHLIGHTS
| Aspects | Details |
|---|---|
| Study Period | 2020-2034 |
| Base Year | 2025 |
| Estimated Year | 2026 |
| Forecast Period | 2026-2034 |
| Historical Period | 2020-2025 |
| Growth Rate | CAGR of XX% from 2020-2034 |
| Segmentation |
|
Table of Contents
- 1. Introduction
- 1.1. Research Scope
- 1.2. Market Segmentation
- 1.3. Research Objective
- 1.4. Definitions and Assumptions
- 2. Executive Summary
- 2.1. Market Snapshot
- 3. Market Dynamics
- 3.1. Market Drivers
- 3.2. Market Restrains
- 3.3. Market Trends
- 3.4. Market Opportunities
- 4. Market Factor Analysis
- 4.1. Porters Five Forces
- 4.1.1. Bargaining Power of Suppliers
- 4.1.2. Bargaining Power of Buyers
- 4.1.3. Threat of New Entrants
- 4.1.4. Threat of Substitutes
- 4.1.5. Competitive Rivalry
- 4.2. PESTEL analysis
- 4.3. BCG Analysis
- 4.3.1. Stars (High Growth, High Market Share)
- 4.3.2. Cash Cows (Low Growth, High Market Share)
- 4.3.3. Question Mark (High Growth, Low Market Share)
- 4.3.4. Dogs (Low Growth, Low Market Share)
- 4.4. Ansoff Matrix Analysis
- 4.5. Supply Chain Analysis
- 4.6. Regulatory Landscape
- 4.7. Current Market Potential and Opportunity Assessment (TAM–SAM–SOM Framework)
- 4.8. IMR Analyst Note
- 4.1. Porters Five Forces
- 5. Market Analysis, Insights and Forecast 2021-2033
- 5.1. Market Analysis, Insights and Forecast - by Application
- 5.1.1. Deep Sea Operations
- 5.1.2. Petroleum and Natural Gas
- 5.1.3. Others
- 5.2. Market Analysis, Insights and Forecast - by Types
- 5.2.1. S-Lay Pipeline Installation
- 5.2.2. Tow-In Pipeline Installation
- 5.2.3. J-Lay Pipeline Installation
- 5.3. Market Analysis, Insights and Forecast - by Region
- 5.3.1. North America
- 5.3.2. South America
- 5.3.3. Europe
- 5.3.4. Middle East & Africa
- 5.3.5. Asia Pacific
- 5.1. Market Analysis, Insights and Forecast - by Application
- 6. Global Pipeline Layer Barge Analysis, Insights and Forecast, 2021-2033
- 6.1. Market Analysis, Insights and Forecast - by Application
- 6.1.1. Deep Sea Operations
- 6.1.2. Petroleum and Natural Gas
- 6.1.3. Others
- 6.2. Market Analysis, Insights and Forecast - by Types
- 6.2.1. S-Lay Pipeline Installation
- 6.2.2. Tow-In Pipeline Installation
- 6.2.3. J-Lay Pipeline Installation
- 6.1. Market Analysis, Insights and Forecast - by Application
- 7. North America Pipeline Layer Barge Analysis, Insights and Forecast, 2020-2032
- 7.1. Market Analysis, Insights and Forecast - by Application
- 7.1.1. Deep Sea Operations
- 7.1.2. Petroleum and Natural Gas
- 7.1.3. Others
- 7.2. Market Analysis, Insights and Forecast - by Types
- 7.2.1. S-Lay Pipeline Installation
- 7.2.2. Tow-In Pipeline Installation
- 7.2.3. J-Lay Pipeline Installation
- 7.1. Market Analysis, Insights and Forecast - by Application
- 8. South America Pipeline Layer Barge Analysis, Insights and Forecast, 2020-2032
- 8.1. Market Analysis, Insights and Forecast - by Application
- 8.1.1. Deep Sea Operations
- 8.1.2. Petroleum and Natural Gas
- 8.1.3. Others
- 8.2. Market Analysis, Insights and Forecast - by Types
- 8.2.1. S-Lay Pipeline Installation
- 8.2.2. Tow-In Pipeline Installation
- 8.2.3. J-Lay Pipeline Installation
- 8.1. Market Analysis, Insights and Forecast - by Application
- 9. Europe Pipeline Layer Barge Analysis, Insights and Forecast, 2020-2032
- 9.1. Market Analysis, Insights and Forecast - by Application
- 9.1.1. Deep Sea Operations
- 9.1.2. Petroleum and Natural Gas
- 9.1.3. Others
- 9.2. Market Analysis, Insights and Forecast - by Types
- 9.2.1. S-Lay Pipeline Installation
- 9.2.2. Tow-In Pipeline Installation
- 9.2.3. J-Lay Pipeline Installation
- 9.1. Market Analysis, Insights and Forecast - by Application
- 10. Middle East & Africa Pipeline Layer Barge Analysis, Insights and Forecast, 2020-2032
- 10.1. Market Analysis, Insights and Forecast - by Application
- 10.1.1. Deep Sea Operations
- 10.1.2. Petroleum and Natural Gas
- 10.1.3. Others
- 10.2. Market Analysis, Insights and Forecast - by Types
- 10.2.1. S-Lay Pipeline Installation
- 10.2.2. Tow-In Pipeline Installation
- 10.2.3. J-Lay Pipeline Installation
- 10.1. Market Analysis, Insights and Forecast - by Application
- 11. Asia Pacific Pipeline Layer Barge Analysis, Insights and Forecast, 2020-2032
- 11.1. Market Analysis, Insights and Forecast - by Application
- 11.1.1. Deep Sea Operations
- 11.1.2. Petroleum and Natural Gas
- 11.1.3. Others
- 11.2. Market Analysis, Insights and Forecast - by Types
- 11.2.1. S-Lay Pipeline Installation
- 11.2.2. Tow-In Pipeline Installation
- 11.2.3. J-Lay Pipeline Installation
- 11.1. Market Analysis, Insights and Forecast - by Application
- 12. Competitive Analysis
- 12.1. Company Profiles
- 12.1.1 Allseas
- 12.1.1.1. Company Overview
- 12.1.1.2. Products
- 12.1.1.3. Company Financials
- 12.1.1.4. SWOT Analysis
- 12.1.2 Saipem
- 12.1.2.1. Company Overview
- 12.1.2.2. Products
- 12.1.2.3. Company Financials
- 12.1.2.4. SWOT Analysis
- 12.1.3 Global Industries
- 12.1.3.1. Company Overview
- 12.1.3.2. Products
- 12.1.3.3. Company Financials
- 12.1.3.4. SWOT Analysis
- 12.1.4 Subsea 7
- 12.1.4.1. Company Overview
- 12.1.4.2. Products
- 12.1.4.3. Company Financials
- 12.1.4.4. SWOT Analysis
- 12.1.5 ZPMC
- 12.1.5.1. Company Overview
- 12.1.5.2. Products
- 12.1.5.3. Company Financials
- 12.1.5.4. SWOT Analysis
- 12.1.6 Daewoo
- 12.1.6.1. Company Overview
- 12.1.6.2. Products
- 12.1.6.3. Company Financials
- 12.1.6.4. SWOT Analysis
- 12.1.7 Offshore Oil Engineering
- 12.1.7.1. Company Overview
- 12.1.7.2. Products
- 12.1.7.3. Company Financials
- 12.1.7.4. SWOT Analysis
- 12.1.8 Sinopec Petroleum Engineering & Construction Shengli
- 12.1.8.1. Company Overview
- 12.1.8.2. Products
- 12.1.8.3. Company Financials
- 12.1.8.4. SWOT Analysis
- 12.1.9 CIMC Raffles
- 12.1.9.1. Company Overview
- 12.1.9.2. Products
- 12.1.9.3. Company Financials
- 12.1.9.4. SWOT Analysis
- 12.1.10 Dredge Brokers
- 12.1.10.1. Company Overview
- 12.1.10.2. Products
- 12.1.10.3. Company Financials
- 12.1.10.4. SWOT Analysis
- 12.1.11 Van Oord
- 12.1.11.1. Company Overview
- 12.1.11.2. Products
- 12.1.11.3. Company Financials
- 12.1.11.4. SWOT Analysis
- 12.1.12 Horizon Ship Brokers
- 12.1.12.1. Company Overview
- 12.1.12.2. Products
- 12.1.12.3. Company Financials
- 12.1.12.4. SWOT Analysis
- 12.1.1 Allseas
- 12.2. Market Entropy
- 12.2.1 Company's Key Areas Served
- 12.2.2 Recent Developments
- 12.3. Company Market Share Analysis 2025
- 12.3.1 Top 5 Companies Market Share Analysis
- 12.3.2 Top 3 Companies Market Share Analysis
- 12.4. List of Potential Customers
- 13. Research Methodology
List of Figures
- Figure 1: Global Pipeline Layer Barge Revenue Breakdown (million, %) by Region 2025 & 2033
- Figure 2: North America Pipeline Layer Barge Revenue (million), by Application 2025 & 2033
- Figure 3: North America Pipeline Layer Barge Revenue Share (%), by Application 2025 & 2033
- Figure 4: North America Pipeline Layer Barge Revenue (million), by Types 2025 & 2033
- Figure 5: North America Pipeline Layer Barge Revenue Share (%), by Types 2025 & 2033
- Figure 6: North America Pipeline Layer Barge Revenue (million), by Country 2025 & 2033
- Figure 7: North America Pipeline Layer Barge Revenue Share (%), by Country 2025 & 2033
- Figure 8: South America Pipeline Layer Barge Revenue (million), by Application 2025 & 2033
- Figure 9: South America Pipeline Layer Barge Revenue Share (%), by Application 2025 & 2033
- Figure 10: South America Pipeline Layer Barge Revenue (million), by Types 2025 & 2033
- Figure 11: South America Pipeline Layer Barge Revenue Share (%), by Types 2025 & 2033
- Figure 12: South America Pipeline Layer Barge Revenue (million), by Country 2025 & 2033
- Figure 13: South America Pipeline Layer Barge Revenue Share (%), by Country 2025 & 2033
- Figure 14: Europe Pipeline Layer Barge Revenue (million), by Application 2025 & 2033
- Figure 15: Europe Pipeline Layer Barge Revenue Share (%), by Application 2025 & 2033
- Figure 16: Europe Pipeline Layer Barge Revenue (million), by Types 2025 & 2033
- Figure 17: Europe Pipeline Layer Barge Revenue Share (%), by Types 2025 & 2033
- Figure 18: Europe Pipeline Layer Barge Revenue (million), by Country 2025 & 2033
- Figure 19: Europe Pipeline Layer Barge Revenue Share (%), by Country 2025 & 2033
- Figure 20: Middle East & Africa Pipeline Layer Barge Revenue (million), by Application 2025 & 2033
- Figure 21: Middle East & Africa Pipeline Layer Barge Revenue Share (%), by Application 2025 & 2033
- Figure 22: Middle East & Africa Pipeline Layer Barge Revenue (million), by Types 2025 & 2033
- Figure 23: Middle East & Africa Pipeline Layer Barge Revenue Share (%), by Types 2025 & 2033
- Figure 24: Middle East & Africa Pipeline Layer Barge Revenue (million), by Country 2025 & 2033
- Figure 25: Middle East & Africa Pipeline Layer Barge Revenue Share (%), by Country 2025 & 2033
- Figure 26: Asia Pacific Pipeline Layer Barge Revenue (million), by Application 2025 & 2033
- Figure 27: Asia Pacific Pipeline Layer Barge Revenue Share (%), by Application 2025 & 2033
- Figure 28: Asia Pacific Pipeline Layer Barge Revenue (million), by Types 2025 & 2033
- Figure 29: Asia Pacific Pipeline Layer Barge Revenue Share (%), by Types 2025 & 2033
- Figure 30: Asia Pacific Pipeline Layer Barge Revenue (million), by Country 2025 & 2033
- Figure 31: Asia Pacific Pipeline Layer Barge Revenue Share (%), by Country 2025 & 2033
List of Tables
- Table 1: Global Pipeline Layer Barge Revenue million Forecast, by Application 2020 & 2033
- Table 2: Global Pipeline Layer Barge Revenue million Forecast, by Types 2020 & 2033
- Table 3: Global Pipeline Layer Barge Revenue million Forecast, by Region 2020 & 2033
- Table 4: Global Pipeline Layer Barge Revenue million Forecast, by Application 2020 & 2033
- Table 5: Global Pipeline Layer Barge Revenue million Forecast, by Types 2020 & 2033
- Table 6: Global Pipeline Layer Barge Revenue million Forecast, by Country 2020 & 2033
- Table 7: United States Pipeline Layer Barge Revenue (million) Forecast, by Application 2020 & 2033
- Table 8: Canada Pipeline Layer Barge Revenue (million) Forecast, by Application 2020 & 2033
- Table 9: Mexico Pipeline Layer Barge Revenue (million) Forecast, by Application 2020 & 2033
- Table 10: Global Pipeline Layer Barge Revenue million Forecast, by Application 2020 & 2033
- Table 11: Global Pipeline Layer Barge Revenue million Forecast, by Types 2020 & 2033
- Table 12: Global Pipeline Layer Barge Revenue million Forecast, by Country 2020 & 2033
- Table 13: Brazil Pipeline Layer Barge Revenue (million) Forecast, by Application 2020 & 2033
- Table 14: Argentina Pipeline Layer Barge Revenue (million) Forecast, by Application 2020 & 2033
- Table 15: Rest of South America Pipeline Layer Barge Revenue (million) Forecast, by Application 2020 & 2033
- Table 16: Global Pipeline Layer Barge Revenue million Forecast, by Application 2020 & 2033
- Table 17: Global Pipeline Layer Barge Revenue million Forecast, by Types 2020 & 2033
- Table 18: Global Pipeline Layer Barge Revenue million Forecast, by Country 2020 & 2033
- Table 19: United Kingdom Pipeline Layer Barge Revenue (million) Forecast, by Application 2020 & 2033
- Table 20: Germany Pipeline Layer Barge Revenue (million) Forecast, by Application 2020 & 2033
- Table 21: France Pipeline Layer Barge Revenue (million) Forecast, by Application 2020 & 2033
- Table 22: Italy Pipeline Layer Barge Revenue (million) Forecast, by Application 2020 & 2033
- Table 23: Spain Pipeline Layer Barge Revenue (million) Forecast, by Application 2020 & 2033
- Table 24: Russia Pipeline Layer Barge Revenue (million) Forecast, by Application 2020 & 2033
- Table 25: Benelux Pipeline Layer Barge Revenue (million) Forecast, by Application 2020 & 2033
- Table 26: Nordics Pipeline Layer Barge Revenue (million) Forecast, by Application 2020 & 2033
- Table 27: Rest of Europe Pipeline Layer Barge Revenue (million) Forecast, by Application 2020 & 2033
- Table 28: Global Pipeline Layer Barge Revenue million Forecast, by Application 2020 & 2033
- Table 29: Global Pipeline Layer Barge Revenue million Forecast, by Types 2020 & 2033
- Table 30: Global Pipeline Layer Barge Revenue million Forecast, by Country 2020 & 2033
- Table 31: Turkey Pipeline Layer Barge Revenue (million) Forecast, by Application 2020 & 2033
- Table 32: Israel Pipeline Layer Barge Revenue (million) Forecast, by Application 2020 & 2033
- Table 33: GCC Pipeline Layer Barge Revenue (million) Forecast, by Application 2020 & 2033
- Table 34: North Africa Pipeline Layer Barge Revenue (million) Forecast, by Application 2020 & 2033
- Table 35: South Africa Pipeline Layer Barge Revenue (million) Forecast, by Application 2020 & 2033
- Table 36: Rest of Middle East & Africa Pipeline Layer Barge Revenue (million) Forecast, by Application 2020 & 2033
- Table 37: Global Pipeline Layer Barge Revenue million Forecast, by Application 2020 & 2033
- Table 38: Global Pipeline Layer Barge Revenue million Forecast, by Types 2020 & 2033
- Table 39: Global Pipeline Layer Barge Revenue million Forecast, by Country 2020 & 2033
- Table 40: China Pipeline Layer Barge Revenue (million) Forecast, by Application 2020 & 2033
- Table 41: India Pipeline Layer Barge Revenue (million) Forecast, by Application 2020 & 2033
- Table 42: Japan Pipeline Layer Barge Revenue (million) Forecast, by Application 2020 & 2033
- Table 43: South Korea Pipeline Layer Barge Revenue (million) Forecast, by Application 2020 & 2033
- Table 44: ASEAN Pipeline Layer Barge Revenue (million) Forecast, by Application 2020 & 2033
- Table 45: Oceania Pipeline Layer Barge Revenue (million) Forecast, by Application 2020 & 2033
- Table 46: Rest of Asia Pacific Pipeline Layer Barge Revenue (million) Forecast, by Application 2020 & 2033
Frequently Asked Questions
1. What is the projected Compound Annual Growth Rate (CAGR) of the Pipeline Layer Barge?
The projected CAGR is approximately XX%.
2. Which companies are prominent players in the Pipeline Layer Barge?
Key companies in the market include Allseas, Saipem, Global Industries, Subsea 7, ZPMC, Daewoo, Offshore Oil Engineering, Sinopec Petroleum Engineering & Construction Shengli, CIMC Raffles, Dredge Brokers, Van Oord, Horizon Ship Brokers.
3. What are the main segments of the Pipeline Layer Barge?
The market segments include Application, Types.
4. Can you provide details about the market size?
The market size is estimated to be USD XXX million as of 2022.
5. What are some drivers contributing to market growth?
N/A
6. What are the notable trends driving market growth?
N/A
7. Are there any restraints impacting market growth?
N/A
8. Can you provide examples of recent developments in the market?
N/A
9. What pricing options are available for accessing the report?
Pricing options include single-user, multi-user, and enterprise licenses priced at USD 2900.00, USD 4350.00, and USD 5800.00 respectively.
10. Is the market size provided in terms of value or volume?
The market size is provided in terms of value, measured in million.
11. Are there any specific market keywords associated with the report?
Yes, the market keyword associated with the report is "Pipeline Layer Barge," which aids in identifying and referencing the specific market segment covered.
12. How do I determine which pricing option suits my needs best?
The pricing options vary based on user requirements and access needs. Individual users may opt for single-user licenses, while businesses requiring broader access may choose multi-user or enterprise licenses for cost-effective access to the report.
13. Are there any additional resources or data provided in the Pipeline Layer Barge report?
While the report offers comprehensive insights, it's advisable to review the specific contents or supplementary materials provided to ascertain if additional resources or data are available.
14. How can I stay updated on further developments or reports in the Pipeline Layer Barge?
To stay informed about further developments, trends, and reports in the Pipeline Layer Barge, consider subscribing to industry newsletters, following relevant companies and organizations, or regularly checking reputable industry news sources and publications.
Methodology
Step 1 - Identification of Relevant Samples Size from Population Database


Step 2 - Approaches for Defining Global Market Size (Value, Volume* & Price*)

Note*: In applicable scenarios
Step 3 - Data Sources
Primary Research
- Web Analytics
- Survey Reports
- Research Institute
- Latest Research Reports
- Opinion Leaders
Secondary Research
- Annual Reports
- White Paper
- Latest Press Release
- Industry Association
- Paid Database
- Investor Presentations

Step 4 - Data Triangulation
Involves using different sources of information in order to increase the validity of a study
These sources are likely to be stakeholders in a program - participants, other researchers, program staff, other community members, and so on.
Then we put all data in single framework & apply various statistical tools to find out the dynamic on the market.
During the analysis stage, feedback from the stakeholder groups would be compared to determine areas of agreement as well as areas of divergence