

Key Insights
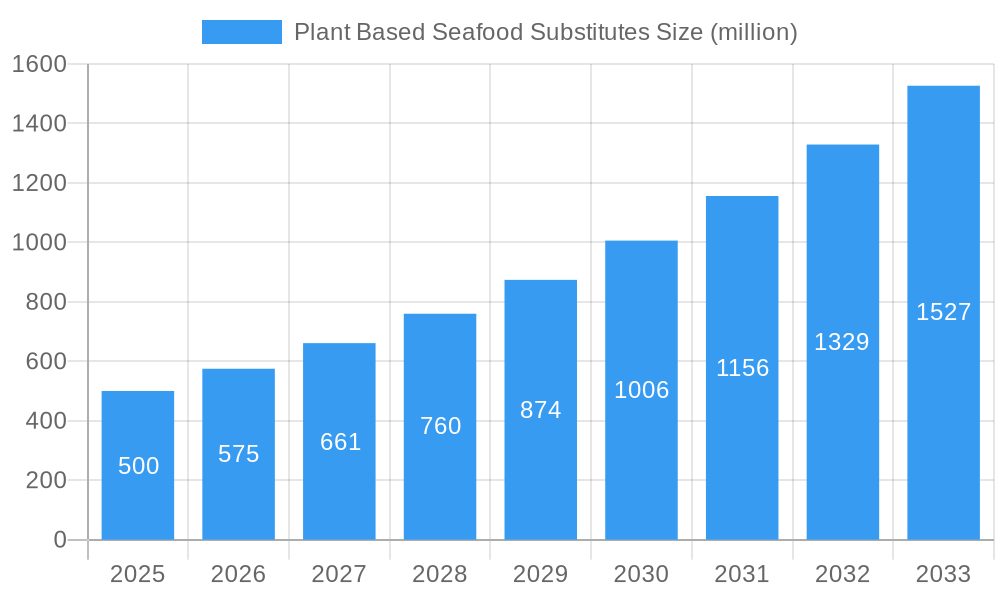
The plant-based seafood substitutes market is experiencing robust growth, driven by increasing consumer demand for sustainable and ethical food options, coupled with rising health consciousness. The market, estimated at $500 million in 2025, is projected to achieve a Compound Annual Growth Rate (CAGR) of 15% from 2025 to 2033, reaching approximately $2 billion by 2033. This significant expansion is fueled by several key factors. Firstly, concerns about overfishing and the environmental impact of traditional seafood farming are pushing consumers towards plant-based alternatives. Secondly, the rising prevalence of veganism and vegetarianism is directly contributing to market growth. Thirdly, technological advancements are leading to increasingly realistic and palatable plant-based seafood products, addressing earlier criticisms about taste and texture. Companies like Good Catch Foods, New Wave Foods, and Sophie's Kitchen are spearheading innovation in this space, continually improving product quality and expanding distribution channels. The market is segmented by product type (e.g., plant-based fish fillets, shrimp, tuna), distribution channels (retail, food service), and geographic region. While North America and Europe currently dominate the market, significant growth potential exists in Asia-Pacific and other emerging markets as consumer awareness increases. However, challenges remain, including overcoming consumer perceptions about taste and texture, managing production costs, and ensuring consistent product quality. Despite these obstacles, the long-term outlook for the plant-based seafood substitutes market remains exceptionally positive.
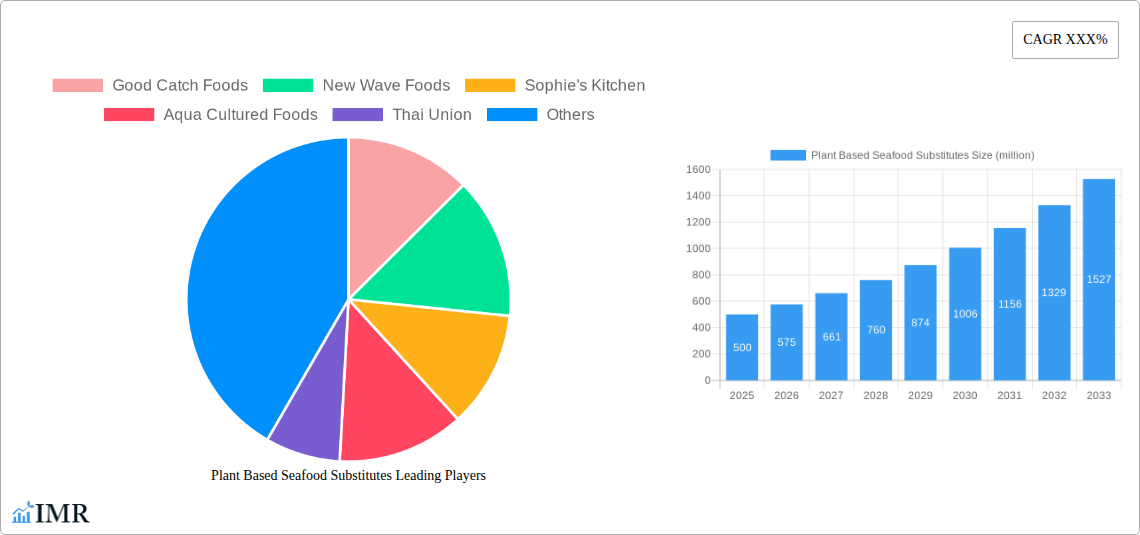
Plant Based Seafood Substitutes Market Size (In Million)
The competitive landscape is characterized by a mix of established food companies and innovative startups. Larger players like Nestlé are leveraging their existing infrastructure and brand recognition to enter the market, while smaller companies focus on product innovation and niche market penetration. Strategic partnerships, mergers, and acquisitions are expected to shape the market further. The industry is also witnessing increasing investment in research and development to improve product formulation and manufacturing processes, resulting in more sustainable and cost-effective production methods. This ongoing innovation, coupled with rising consumer demand and favorable regulatory environments in several key regions, is set to propel the market toward significant expansion in the coming years. The focus on product diversification, encompassing a wider range of seafood alternatives, will play a crucial role in sustaining this impressive growth trajectory.
Plant Based Seafood Substitutes Company Market Share
Plant Based Seafood Substitutes Market Report: 2019-2033
This comprehensive report provides a detailed analysis of the plant-based seafood substitutes market, encompassing market dynamics, growth trends, regional insights, product landscapes, and future outlooks. The study period covers 2019-2033, with a base year of 2025 and a forecast period of 2025-2033. The report leverages extensive primary and secondary research, delivering actionable insights for industry professionals, investors, and stakeholders. The market is segmented by product type (e.g., plant-based tuna, shrimp, etc.) and distribution channels (e.g., retail, foodservice). The parent market is the broader plant-based food market, and the child market is specific plant-based seafood alternatives. The report projects the market to reach xx million units by 2033.
Plant Based Seafood Substitutes Market Dynamics & Structure
The plant-based seafood substitutes market is characterized by increasing consumer demand for sustainable and ethical food choices, driven by growing awareness of overfishing and environmental concerns. Market concentration is moderate, with several key players and numerous smaller entrants. Technological innovation, particularly in mimicking the texture and flavor of seafood, is a significant driver. Regulatory frameworks vary across regions, impacting market entry and product approval. Competitive substitutes include traditional seafood and other protein sources. The end-user demographic is expanding, encompassing health-conscious consumers, vegetarians, vegans, and flexitarians. M&A activity is expected to increase as larger players consolidate market share.
- Market Concentration: Moderately concentrated, with a few dominant players and numerous smaller companies. xx% market share held by top 5 players in 2025.
- Technological Innovation: Focus on improving texture, flavor, and cost-effectiveness of plant-based seafood alternatives. Key innovations include 3D-printed seafood and advancements in protein extraction.
- Regulatory Frameworks: Vary across regions, potentially creating barriers to entry for some companies. Focus on labeling and food safety regulations.
- Competitive Substitutes: Traditional seafood, other plant-based protein sources (e.g., tofu, tempeh).
- End-User Demographics: Health-conscious consumers, vegetarians, vegans, flexitarians, and environmentally aware individuals.
- M&A Trends: Increasing consolidation expected, driven by larger companies seeking to expand their plant-based portfolio. xx M&A deals predicted in the forecast period.
Plant Based Seafood Substitutes Growth Trends & Insights
The plant-based seafood substitutes market is experiencing robust growth, driven by several factors, including rising consumer awareness of environmental sustainability, ethical concerns about traditional fishing practices, and the increasing popularity of plant-based diets. The market size has expanded significantly from xx million units in 2019 to an estimated xx million units in 2025, exhibiting a CAGR of xx% during the historical period. This growth is projected to continue, with the market expected to reach xx million units by 2033. Market penetration remains relatively low compared to traditional seafood, indicating substantial growth potential. Technological advancements in plant-based protein production and flavor enhancement are key catalysts for adoption. Consumer behavior is shifting towards more sustainable and ethical food choices, further fueling market expansion.
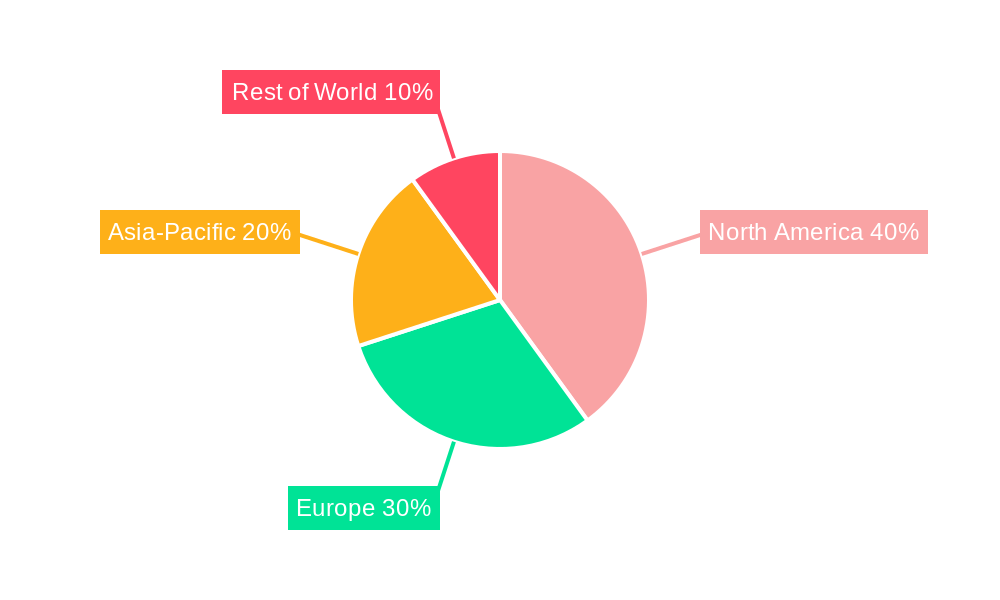
Dominant Regions, Countries, or Segments in Plant Based Seafood Substitutes
North America and Europe currently lead the plant-based seafood substitutes market, driven by high consumer awareness and acceptance of plant-based alternatives. However, Asia-Pacific is showing significant growth potential due to rising incomes, changing dietary habits, and increasing awareness of sustainability.
- North America: High consumer awareness of sustainability and ethical concerns regarding seafood sourcing. Strong presence of established plant-based food companies.
- Europe: Increasing demand for plant-based alternatives fueled by consumer health and environmental concerns. Favorable regulatory environment in certain countries.
- Asia-Pacific: Rapid growth potential driven by rising incomes, changing dietary habits, and increasing adoption of plant-based lifestyles.
Plant Based Seafood Substitutes Product Landscape
The plant-based seafood substitutes market offers a variety of products, including plant-based tuna, shrimp, crab cakes, and fillets, each designed to replicate the taste, texture, and appearance of their seafood counterparts. These products utilize various plant-based proteins, such as pea protein, soy protein, and algae, often combined with flavor enhancers and binding agents to achieve realistic sensory qualities. Continuous innovation focuses on improving product quality, enhancing sustainability, and offering a wider range of options to cater to diverse consumer preferences. Unique selling propositions include reduced environmental impact, ethical sourcing, and health benefits associated with plant-based diets.
Key Drivers, Barriers & Challenges in Plant Based Seafood Substitutes
Key Drivers:
- Growing consumer demand for sustainable and ethical food sources.
- Increasing awareness of overfishing and its environmental impact.
- Rise in popularity of plant-based and flexitarian diets.
- Technological advancements improving product quality and reducing costs.
Key Challenges:
- High production costs compared to traditional seafood.
- Achieving realistic texture and flavor remains a challenge for some products.
- Consumer perception and acceptance may vary across different demographics and regions.
- Regulatory hurdles and varying food safety standards across different countries. Potential supply chain issues related to sourcing raw materials.
Emerging Opportunities in Plant Based Seafood Substitutes
Emerging opportunities lie in expanding into untapped markets, particularly in developing countries with growing middle classes and increasing demand for protein-rich foods. Innovative product development, such as creating new plant-based seafood alternatives that mimic less commonly consumed seafood varieties, presents significant growth potential. Collaborations with foodservice providers to integrate plant-based seafood into menus can further expand market reach. Evolving consumer preferences for healthier, more sustainable options are driving demand for innovative products with improved nutritional profiles and enhanced sustainability credentials.
Growth Accelerators in the Plant Based Seafood Substitutes Industry
Technological breakthroughs in plant-based protein production are significantly accelerating market growth, allowing for the creation of more realistic and cost-effective products. Strategic partnerships between plant-based food companies and established food retailers and foodservice providers are expanding market access and driving consumer adoption. Furthermore, expansion into new geographic markets with high growth potential, coupled with effective marketing strategies that emphasize the sustainability and health benefits of plant-based seafood, will fuel further market expansion.
Key Players Shaping the Plant Based Seafood Substitutes Market
- Good Catch Foods
- New Wave Foods
- Sophie's Kitchen
- Aqua Cultured Foods
- Thai Union
- Shiok Meats
- The Plant-Based Seafood Co
- Vegefarm
- Gardein
- Ocean Hunger Foods
- Nestlé
Notable Milestones in Plant Based Seafood Substitutes Sector
- 2020, Q4: Good Catch Foods launched a new line of plant-based tuna pouches.
- 2021, Q2: New Wave Foods secured a significant investment to expand its shrimp production.
- 2022, Q3: Aqua Cultured Foods announced a partnership with a major food retailer.
- 2023, Q1: Several plant-based seafood companies participated in industry conferences, increasing brand awareness.
- 2024, Q4: A major merger between two key players reshaped the competitive landscape.
In-Depth Plant Based Seafood Substitutes Market Outlook
The plant-based seafood substitutes market is poised for continued robust growth, driven by sustained consumer demand for sustainable and ethical food choices, ongoing technological advancements, and increased market penetration. Strategic opportunities exist for companies to innovate in product development, expand into new geographic markets, and forge strategic partnerships to capture market share. The long-term outlook is positive, with significant potential for market expansion and the emergence of new industry leaders.
Plant Based Seafood Substitutes Segmentation
-
1. Application
- 1.1. Supermarket
- 1.2. Convenience Store
- 1.3. Specialty Store
- 1.4. Online Store
- 1.5. Others
-
2. Type
- 2.1. Shrimp Substitutes
- 2.2. Fish Substitutes
- 2.3. Crab Meat Substitutes
- 2.4. Others
Plant Based Seafood Substitutes Segmentation By Geography
-
1. North America
- 1.1. United States
- 1.2. Canada
- 1.3. Mexico
-
2. South America
- 2.1. Brazil
- 2.2. Argentina
- 2.3. Rest of South America
-
3. Europe
- 3.1. United Kingdom
- 3.2. Germany
- 3.3. France
- 3.4. Italy
- 3.5. Spain
- 3.6. Russia
- 3.7. Benelux
- 3.8. Nordics
- 3.9. Rest of Europe
-
4. Middle East & Africa
- 4.1. Turkey
- 4.2. Israel
- 4.3. GCC
- 4.4. North Africa
- 4.5. South Africa
- 4.6. Rest of Middle East & Africa
-
5. Asia Pacific
- 5.1. China
- 5.2. India
- 5.3. Japan
- 5.4. South Korea
- 5.5. ASEAN
- 5.6. Oceania
- 5.7. Rest of Asia Pacific
Plant Based Seafood Substitutes Regional Market Share
Geographic Coverage of Plant Based Seafood Substitutes
Plant Based Seafood Substitutes REPORT HIGHLIGHTS
| Aspects | Details |
|---|---|
| Study Period | 2020-2034 |
| Base Year | 2025 |
| Estimated Year | 2026 |
| Forecast Period | 2026-2034 |
| Historical Period | 2020-2025 |
| Growth Rate | CAGR of 5.3% from 2020-2034 |
| Segmentation |
|
Table of Contents
- 1. Introduction
- 1.1. Research Scope
- 1.2. Market Segmentation
- 1.3. Research Methodology
- 1.4. Definitions and Assumptions
- 2. Executive Summary
- 2.1. Introduction
- 3. Market Dynamics
- 3.1. Introduction
- 3.2. Market Drivers
- 3.3. Market Restrains
- 3.4. Market Trends
- 4. Market Factor Analysis
- 4.1. Porters Five Forces
- 4.2. Supply/Value Chain
- 4.3. PESTEL analysis
- 4.4. Market Entropy
- 4.5. Patent/Trademark Analysis
- 5. Global Plant Based Seafood Substitutes Analysis, Insights and Forecast, 2020-2032
- 5.1. Market Analysis, Insights and Forecast - by Application
- 5.1.1. Supermarket
- 5.1.2. Convenience Store
- 5.1.3. Specialty Store
- 5.1.4. Online Store
- 5.1.5. Others
- 5.2. Market Analysis, Insights and Forecast - by Type
- 5.2.1. Shrimp Substitutes
- 5.2.2. Fish Substitutes
- 5.2.3. Crab Meat Substitutes
- 5.2.4. Others
- 5.3. Market Analysis, Insights and Forecast - by Region
- 5.3.1. North America
- 5.3.2. South America
- 5.3.3. Europe
- 5.3.4. Middle East & Africa
- 5.3.5. Asia Pacific
- 5.1. Market Analysis, Insights and Forecast - by Application
- 6. North America Plant Based Seafood Substitutes Analysis, Insights and Forecast, 2020-2032
- 6.1. Market Analysis, Insights and Forecast - by Application
- 6.1.1. Supermarket
- 6.1.2. Convenience Store
- 6.1.3. Specialty Store
- 6.1.4. Online Store
- 6.1.5. Others
- 6.2. Market Analysis, Insights and Forecast - by Type
- 6.2.1. Shrimp Substitutes
- 6.2.2. Fish Substitutes
- 6.2.3. Crab Meat Substitutes
- 6.2.4. Others
- 6.1. Market Analysis, Insights and Forecast - by Application
- 7. South America Plant Based Seafood Substitutes Analysis, Insights and Forecast, 2020-2032
- 7.1. Market Analysis, Insights and Forecast - by Application
- 7.1.1. Supermarket
- 7.1.2. Convenience Store
- 7.1.3. Specialty Store
- 7.1.4. Online Store
- 7.1.5. Others
- 7.2. Market Analysis, Insights and Forecast - by Type
- 7.2.1. Shrimp Substitutes
- 7.2.2. Fish Substitutes
- 7.2.3. Crab Meat Substitutes
- 7.2.4. Others
- 7.1. Market Analysis, Insights and Forecast - by Application
- 8. Europe Plant Based Seafood Substitutes Analysis, Insights and Forecast, 2020-2032
- 8.1. Market Analysis, Insights and Forecast - by Application
- 8.1.1. Supermarket
- 8.1.2. Convenience Store
- 8.1.3. Specialty Store
- 8.1.4. Online Store
- 8.1.5. Others
- 8.2. Market Analysis, Insights and Forecast - by Type
- 8.2.1. Shrimp Substitutes
- 8.2.2. Fish Substitutes
- 8.2.3. Crab Meat Substitutes
- 8.2.4. Others
- 8.1. Market Analysis, Insights and Forecast - by Application
- 9. Middle East & Africa Plant Based Seafood Substitutes Analysis, Insights and Forecast, 2020-2032
- 9.1. Market Analysis, Insights and Forecast - by Application
- 9.1.1. Supermarket
- 9.1.2. Convenience Store
- 9.1.3. Specialty Store
- 9.1.4. Online Store
- 9.1.5. Others
- 9.2. Market Analysis, Insights and Forecast - by Type
- 9.2.1. Shrimp Substitutes
- 9.2.2. Fish Substitutes
- 9.2.3. Crab Meat Substitutes
- 9.2.4. Others
- 9.1. Market Analysis, Insights and Forecast - by Application
- 10. Asia Pacific Plant Based Seafood Substitutes Analysis, Insights and Forecast, 2020-2032
- 10.1. Market Analysis, Insights and Forecast - by Application
- 10.1.1. Supermarket
- 10.1.2. Convenience Store
- 10.1.3. Specialty Store
- 10.1.4. Online Store
- 10.1.5. Others
- 10.2. Market Analysis, Insights and Forecast - by Type
- 10.2.1. Shrimp Substitutes
- 10.2.2. Fish Substitutes
- 10.2.3. Crab Meat Substitutes
- 10.2.4. Others
- 10.1. Market Analysis, Insights and Forecast - by Application
- 11. Competitive Analysis
- 11.1. Global Market Share Analysis 2025
- 11.2. Company Profiles
- 11.2.1 Good Catch Foods
- 11.2.1.1. Overview
- 11.2.1.2. Products
- 11.2.1.3. SWOT Analysis
- 11.2.1.4. Recent Developments
- 11.2.1.5. Financials (Based on Availability)
- 11.2.2 New Wave Foods
- 11.2.2.1. Overview
- 11.2.2.2. Products
- 11.2.2.3. SWOT Analysis
- 11.2.2.4. Recent Developments
- 11.2.2.5. Financials (Based on Availability)
- 11.2.3 Sophie's Kitchen
- 11.2.3.1. Overview
- 11.2.3.2. Products
- 11.2.3.3. SWOT Analysis
- 11.2.3.4. Recent Developments
- 11.2.3.5. Financials (Based on Availability)
- 11.2.4 Aqua Cultured Foods
- 11.2.4.1. Overview
- 11.2.4.2. Products
- 11.2.4.3. SWOT Analysis
- 11.2.4.4. Recent Developments
- 11.2.4.5. Financials (Based on Availability)
- 11.2.5 Thai Union
- 11.2.5.1. Overview
- 11.2.5.2. Products
- 11.2.5.3. SWOT Analysis
- 11.2.5.4. Recent Developments
- 11.2.5.5. Financials (Based on Availability)
- 11.2.6 Shiok Meats
- 11.2.6.1. Overview
- 11.2.6.2. Products
- 11.2.6.3. SWOT Analysis
- 11.2.6.4. Recent Developments
- 11.2.6.5. Financials (Based on Availability)
- 11.2.7 The Plant-Based Seafood Co
- 11.2.7.1. Overview
- 11.2.7.2. Products
- 11.2.7.3. SWOT Analysis
- 11.2.7.4. Recent Developments
- 11.2.7.5. Financials (Based on Availability)
- 11.2.8 Vegefarm
- 11.2.8.1. Overview
- 11.2.8.2. Products
- 11.2.8.3. SWOT Analysis
- 11.2.8.4. Recent Developments
- 11.2.8.5. Financials (Based on Availability)
- 11.2.9 Gardein
- 11.2.9.1. Overview
- 11.2.9.2. Products
- 11.2.9.3. SWOT Analysis
- 11.2.9.4. Recent Developments
- 11.2.9.5. Financials (Based on Availability)
- 11.2.10 Ocean Hunger Foods
- 11.2.10.1. Overview
- 11.2.10.2. Products
- 11.2.10.3. SWOT Analysis
- 11.2.10.4. Recent Developments
- 11.2.10.5. Financials (Based on Availability)
- 11.2.11 Nestlé
- 11.2.11.1. Overview
- 11.2.11.2. Products
- 11.2.11.3. SWOT Analysis
- 11.2.11.4. Recent Developments
- 11.2.11.5. Financials (Based on Availability)
- 11.2.1 Good Catch Foods
List of Figures
- Figure 1: Global Plant Based Seafood Substitutes Revenue Breakdown (undefined, %) by Region 2025 & 2033
- Figure 2: North America Plant Based Seafood Substitutes Revenue (undefined), by Application 2025 & 2033
- Figure 3: North America Plant Based Seafood Substitutes Revenue Share (%), by Application 2025 & 2033
- Figure 4: North America Plant Based Seafood Substitutes Revenue (undefined), by Type 2025 & 2033
- Figure 5: North America Plant Based Seafood Substitutes Revenue Share (%), by Type 2025 & 2033
- Figure 6: North America Plant Based Seafood Substitutes Revenue (undefined), by Country 2025 & 2033
- Figure 7: North America Plant Based Seafood Substitutes Revenue Share (%), by Country 2025 & 2033
- Figure 8: South America Plant Based Seafood Substitutes Revenue (undefined), by Application 2025 & 2033
- Figure 9: South America Plant Based Seafood Substitutes Revenue Share (%), by Application 2025 & 2033
- Figure 10: South America Plant Based Seafood Substitutes Revenue (undefined), by Type 2025 & 2033
- Figure 11: South America Plant Based Seafood Substitutes Revenue Share (%), by Type 2025 & 2033
- Figure 12: South America Plant Based Seafood Substitutes Revenue (undefined), by Country 2025 & 2033
- Figure 13: South America Plant Based Seafood Substitutes Revenue Share (%), by Country 2025 & 2033
- Figure 14: Europe Plant Based Seafood Substitutes Revenue (undefined), by Application 2025 & 2033
- Figure 15: Europe Plant Based Seafood Substitutes Revenue Share (%), by Application 2025 & 2033
- Figure 16: Europe Plant Based Seafood Substitutes Revenue (undefined), by Type 2025 & 2033
- Figure 17: Europe Plant Based Seafood Substitutes Revenue Share (%), by Type 2025 & 2033
- Figure 18: Europe Plant Based Seafood Substitutes Revenue (undefined), by Country 2025 & 2033
- Figure 19: Europe Plant Based Seafood Substitutes Revenue Share (%), by Country 2025 & 2033
- Figure 20: Middle East & Africa Plant Based Seafood Substitutes Revenue (undefined), by Application 2025 & 2033
- Figure 21: Middle East & Africa Plant Based Seafood Substitutes Revenue Share (%), by Application 2025 & 2033
- Figure 22: Middle East & Africa Plant Based Seafood Substitutes Revenue (undefined), by Type 2025 & 2033
- Figure 23: Middle East & Africa Plant Based Seafood Substitutes Revenue Share (%), by Type 2025 & 2033
- Figure 24: Middle East & Africa Plant Based Seafood Substitutes Revenue (undefined), by Country 2025 & 2033
- Figure 25: Middle East & Africa Plant Based Seafood Substitutes Revenue Share (%), by Country 2025 & 2033
- Figure 26: Asia Pacific Plant Based Seafood Substitutes Revenue (undefined), by Application 2025 & 2033
- Figure 27: Asia Pacific Plant Based Seafood Substitutes Revenue Share (%), by Application 2025 & 2033
- Figure 28: Asia Pacific Plant Based Seafood Substitutes Revenue (undefined), by Type 2025 & 2033
- Figure 29: Asia Pacific Plant Based Seafood Substitutes Revenue Share (%), by Type 2025 & 2033
- Figure 30: Asia Pacific Plant Based Seafood Substitutes Revenue (undefined), by Country 2025 & 2033
- Figure 31: Asia Pacific Plant Based Seafood Substitutes Revenue Share (%), by Country 2025 & 2033
List of Tables
- Table 1: Global Plant Based Seafood Substitutes Revenue undefined Forecast, by Application 2020 & 2033
- Table 2: Global Plant Based Seafood Substitutes Revenue undefined Forecast, by Type 2020 & 2033
- Table 3: Global Plant Based Seafood Substitutes Revenue undefined Forecast, by Region 2020 & 2033
- Table 4: Global Plant Based Seafood Substitutes Revenue undefined Forecast, by Application 2020 & 2033
- Table 5: Global Plant Based Seafood Substitutes Revenue undefined Forecast, by Type 2020 & 2033
- Table 6: Global Plant Based Seafood Substitutes Revenue undefined Forecast, by Country 2020 & 2033
- Table 7: United States Plant Based Seafood Substitutes Revenue (undefined) Forecast, by Application 2020 & 2033
- Table 8: Canada Plant Based Seafood Substitutes Revenue (undefined) Forecast, by Application 2020 & 2033
- Table 9: Mexico Plant Based Seafood Substitutes Revenue (undefined) Forecast, by Application 2020 & 2033
- Table 10: Global Plant Based Seafood Substitutes Revenue undefined Forecast, by Application 2020 & 2033
- Table 11: Global Plant Based Seafood Substitutes Revenue undefined Forecast, by Type 2020 & 2033
- Table 12: Global Plant Based Seafood Substitutes Revenue undefined Forecast, by Country 2020 & 2033
- Table 13: Brazil Plant Based Seafood Substitutes Revenue (undefined) Forecast, by Application 2020 & 2033
- Table 14: Argentina Plant Based Seafood Substitutes Revenue (undefined) Forecast, by Application 2020 & 2033
- Table 15: Rest of South America Plant Based Seafood Substitutes Revenue (undefined) Forecast, by Application 2020 & 2033
- Table 16: Global Plant Based Seafood Substitutes Revenue undefined Forecast, by Application 2020 & 2033
- Table 17: Global Plant Based Seafood Substitutes Revenue undefined Forecast, by Type 2020 & 2033
- Table 18: Global Plant Based Seafood Substitutes Revenue undefined Forecast, by Country 2020 & 2033
- Table 19: United Kingdom Plant Based Seafood Substitutes Revenue (undefined) Forecast, by Application 2020 & 2033
- Table 20: Germany Plant Based Seafood Substitutes Revenue (undefined) Forecast, by Application 2020 & 2033
- Table 21: France Plant Based Seafood Substitutes Revenue (undefined) Forecast, by Application 2020 & 2033
- Table 22: Italy Plant Based Seafood Substitutes Revenue (undefined) Forecast, by Application 2020 & 2033
- Table 23: Spain Plant Based Seafood Substitutes Revenue (undefined) Forecast, by Application 2020 & 2033
- Table 24: Russia Plant Based Seafood Substitutes Revenue (undefined) Forecast, by Application 2020 & 2033
- Table 25: Benelux Plant Based Seafood Substitutes Revenue (undefined) Forecast, by Application 2020 & 2033
- Table 26: Nordics Plant Based Seafood Substitutes Revenue (undefined) Forecast, by Application 2020 & 2033
- Table 27: Rest of Europe Plant Based Seafood Substitutes Revenue (undefined) Forecast, by Application 2020 & 2033
- Table 28: Global Plant Based Seafood Substitutes Revenue undefined Forecast, by Application 2020 & 2033
- Table 29: Global Plant Based Seafood Substitutes Revenue undefined Forecast, by Type 2020 & 2033
- Table 30: Global Plant Based Seafood Substitutes Revenue undefined Forecast, by Country 2020 & 2033
- Table 31: Turkey Plant Based Seafood Substitutes Revenue (undefined) Forecast, by Application 2020 & 2033
- Table 32: Israel Plant Based Seafood Substitutes Revenue (undefined) Forecast, by Application 2020 & 2033
- Table 33: GCC Plant Based Seafood Substitutes Revenue (undefined) Forecast, by Application 2020 & 2033
- Table 34: North Africa Plant Based Seafood Substitutes Revenue (undefined) Forecast, by Application 2020 & 2033
- Table 35: South Africa Plant Based Seafood Substitutes Revenue (undefined) Forecast, by Application 2020 & 2033
- Table 36: Rest of Middle East & Africa Plant Based Seafood Substitutes Revenue (undefined) Forecast, by Application 2020 & 2033
- Table 37: Global Plant Based Seafood Substitutes Revenue undefined Forecast, by Application 2020 & 2033
- Table 38: Global Plant Based Seafood Substitutes Revenue undefined Forecast, by Type 2020 & 2033
- Table 39: Global Plant Based Seafood Substitutes Revenue undefined Forecast, by Country 2020 & 2033
- Table 40: China Plant Based Seafood Substitutes Revenue (undefined) Forecast, by Application 2020 & 2033
- Table 41: India Plant Based Seafood Substitutes Revenue (undefined) Forecast, by Application 2020 & 2033
- Table 42: Japan Plant Based Seafood Substitutes Revenue (undefined) Forecast, by Application 2020 & 2033
- Table 43: South Korea Plant Based Seafood Substitutes Revenue (undefined) Forecast, by Application 2020 & 2033
- Table 44: ASEAN Plant Based Seafood Substitutes Revenue (undefined) Forecast, by Application 2020 & 2033
- Table 45: Oceania Plant Based Seafood Substitutes Revenue (undefined) Forecast, by Application 2020 & 2033
- Table 46: Rest of Asia Pacific Plant Based Seafood Substitutes Revenue (undefined) Forecast, by Application 2020 & 2033
Frequently Asked Questions
1. What is the projected Compound Annual Growth Rate (CAGR) of the Plant Based Seafood Substitutes?
The projected CAGR is approximately 5.3%.
2. Which companies are prominent players in the Plant Based Seafood Substitutes?
Key companies in the market include Good Catch Foods, New Wave Foods, Sophie's Kitchen, Aqua Cultured Foods, Thai Union, Shiok Meats, The Plant-Based Seafood Co, Vegefarm, Gardein, Ocean Hunger Foods, Nestlé.
3. What are the main segments of the Plant Based Seafood Substitutes?
The market segments include Application, Type.
4. Can you provide details about the market size?
The market size is estimated to be USD XXX N/A as of 2022.
5. What are some drivers contributing to market growth?
N/A
6. What are the notable trends driving market growth?
N/A
7. Are there any restraints impacting market growth?
N/A
8. Can you provide examples of recent developments in the market?
N/A
9. What pricing options are available for accessing the report?
Pricing options include single-user, multi-user, and enterprise licenses priced at USD 3950.00, USD 5925.00, and USD 7900.00 respectively.
10. Is the market size provided in terms of value or volume?
The market size is provided in terms of value, measured in N/A.
11. Are there any specific market keywords associated with the report?
Yes, the market keyword associated with the report is "Plant Based Seafood Substitutes," which aids in identifying and referencing the specific market segment covered.
12. How do I determine which pricing option suits my needs best?
The pricing options vary based on user requirements and access needs. Individual users may opt for single-user licenses, while businesses requiring broader access may choose multi-user or enterprise licenses for cost-effective access to the report.
13. Are there any additional resources or data provided in the Plant Based Seafood Substitutes report?
While the report offers comprehensive insights, it's advisable to review the specific contents or supplementary materials provided to ascertain if additional resources or data are available.
14. How can I stay updated on further developments or reports in the Plant Based Seafood Substitutes?
To stay informed about further developments, trends, and reports in the Plant Based Seafood Substitutes, consider subscribing to industry newsletters, following relevant companies and organizations, or regularly checking reputable industry news sources and publications.
Methodology
Step 1 - Identification of Relevant Samples Size from Population Database


Step 2 - Approaches for Defining Global Market Size (Value, Volume* & Price*)

Note*: In applicable scenarios
Step 3 - Data Sources
Primary Research
- Web Analytics
- Survey Reports
- Research Institute
- Latest Research Reports
- Opinion Leaders
Secondary Research
- Annual Reports
- White Paper
- Latest Press Release
- Industry Association
- Paid Database
- Investor Presentations

Step 4 - Data Triangulation
Involves using different sources of information in order to increase the validity of a study
These sources are likely to be stakeholders in a program - participants, other researchers, program staff, other community members, and so on.
Then we put all data in single framework & apply various statistical tools to find out the dynamic on the market.
During the analysis stage, feedback from the stakeholder groups would be compared to determine areas of agreement as well as areas of divergence