

Key Insights
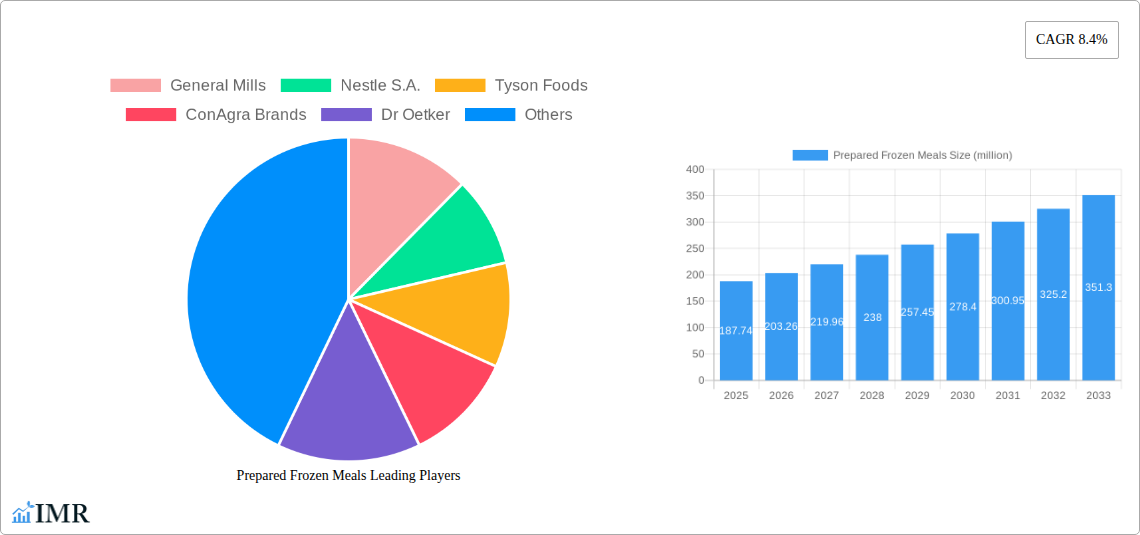
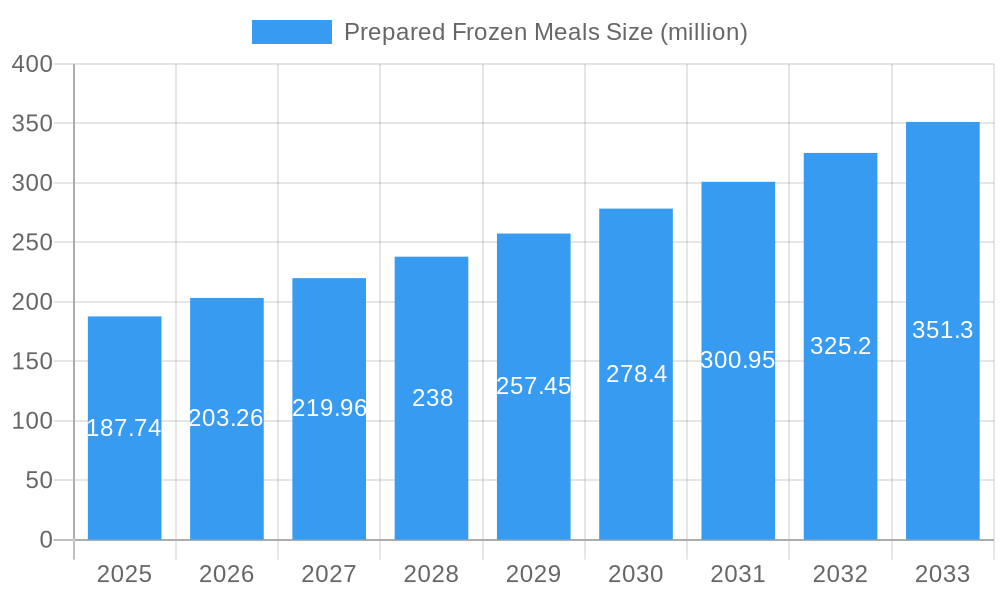
The prepared frozen meals market, valued at $187.74 million in 2025, is projected to experience robust growth, driven by several key factors. Convenience is a primary driver, appealing to busy consumers seeking quick and easy meal solutions. The increasing prevalence of dual-income households and single-person homes further fuels this demand. Health-conscious consumers are also influencing market trends, with a growing preference for healthier options such as meals with reduced sodium, added fiber, or organic ingredients. Innovation within the sector is another significant factor, with manufacturers constantly introducing new flavors, formats, and healthier options to cater to evolving consumer preferences. This includes the rise of meal kits and single-serving options designed for convenience and portion control. However, concerns regarding the nutritional content and potential preservatives in frozen meals pose a restraint on market growth. Overcoming consumer perceptions regarding the healthiness of frozen meals will be crucial for sustained market expansion. Major players like General Mills, Nestle, and Tyson Foods are leveraging brand recognition and extensive distribution networks to maintain a competitive edge. Emerging trends, such as plant-based options and sustainable packaging, present opportunities for market expansion and differentiation. The competitive landscape is characterized by both large multinational corporations and smaller regional players, suggesting the potential for further consolidation and diversification in the coming years.
Prepared Frozen Meals Market Size (In Million)
The forecast period (2025-2033) anticipates sustained growth, with the 8.4% CAGR indicating a significant market expansion. Regional variations are expected, with developed markets likely showing a more moderate growth rate compared to emerging economies where increased disposable incomes and evolving lifestyles drive higher demand. Further segmentation within the market, based on meal type (e.g., entrees, side dishes, desserts), dietary restrictions (vegetarian, vegan, gluten-free), and price points, will likely emerge as a key differentiator. Companies are expected to invest heavily in research and development, focusing on innovative product development and improved packaging to address concerns about food safety and environmental impact. Strategic partnerships and mergers and acquisitions will likely continue to shape the market dynamics, with larger players consolidating market share and smaller players focusing on niche segments.
Prepared Frozen Meals Company Market Share
Prepared Frozen Meals Market Report: 2019-2033
This comprehensive report provides a detailed analysis of the prepared frozen meals market, encompassing market dynamics, growth trends, regional analysis, product landscape, key players, and future outlook. The study period spans from 2019 to 2033, with 2025 serving as the base and estimated year. The report is essential for industry professionals, investors, and strategic decision-makers seeking a deep understanding of this dynamic market. Market values are presented in million units.
Prepared Frozen Meals Market Dynamics & Structure
The prepared frozen meals market is characterized by a moderately concentrated landscape, with key players like General Mills, Nestlé S.A., and Tyson Foods holding significant market share. The market is driven by technological innovations in food preservation and packaging, expanding consumer demand for convenient and ready-to-eat meals, and the increasing adoption of online grocery delivery services. Regulatory frameworks concerning food safety and labeling influence market practices, while competitive pressures from fresh and ready-to-heat meal alternatives exist. Mergers and acquisitions (M&A) activity has been moderate, with larger players strategically acquiring smaller companies to expand their product portfolios and market reach. The parent market is the broader frozen food industry, while child markets include single-serve meals, family-sized meals, and specialized dietary options.
- Market Concentration: Highly concentrated, with the top 5 players accounting for approximately xx% of the market share in 2025.
- Technological Innovation: Focus on improved freezing technologies, sustainable packaging, and extended shelf life.
- Regulatory Framework: Stringent food safety regulations and labeling requirements impacting product development and cost.
- Competitive Substitutes: Fresh, ready-to-heat, and restaurant meals pose significant competitive challenges.
- End-User Demographics: Growing demand from busy working professionals, single-person households, and families.
- M&A Trends: Moderate M&A activity, primarily focused on expanding product lines and geographic reach (xx deals in the past 5 years).
Prepared Frozen Meals Growth Trends & Insights
The prepared frozen meals market witnessed significant growth during the historical period (2019-2024), driven by factors such as rising disposable incomes, changing lifestyles, and increasing consumer preference for convenience. The market size is projected to reach xx million units by 2025, exhibiting a CAGR of xx% during the forecast period (2025-2033). This growth is further fueled by technological advancements in freezing and packaging, resulting in improved product quality and longer shelf life. Consumer behavior shifts towards healthier and more specialized dietary options are also impacting market trends, leading to an increase in demand for organic, gluten-free, and low-sodium prepared frozen meals. Technological disruptions, such as meal kit delivery services, are expected to influence market dynamics in the coming years. Market penetration of prepared frozen meals is expected to increase to xx% by 2033.
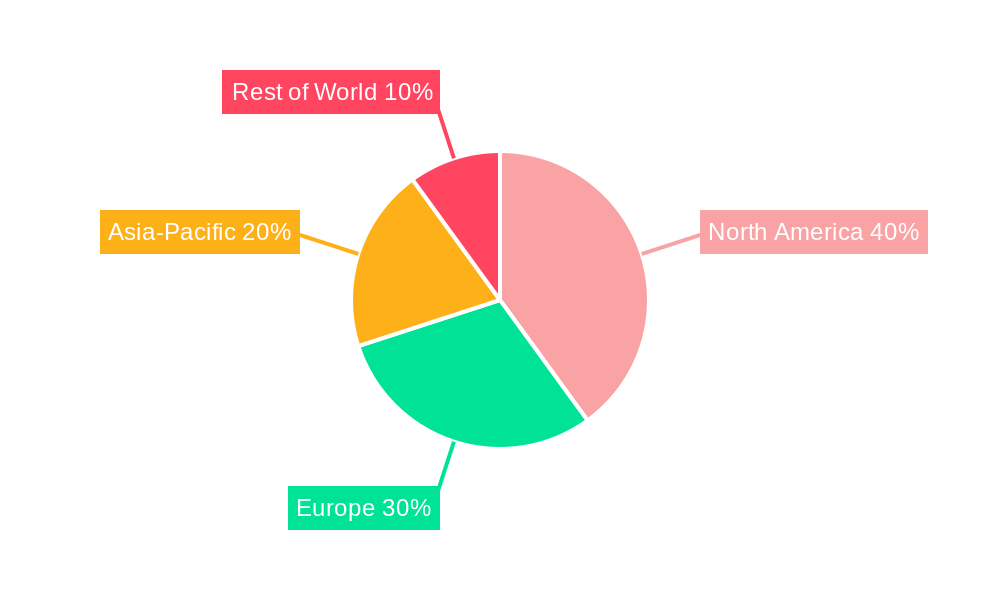
Dominant Regions, Countries, or Segments in Prepared Frozen Meals
The North American region dominates the prepared frozen meals market, driven by high consumer demand for convenience foods, strong retail infrastructure, and established distribution networks. Within North America, the United States holds the largest market share due to its large population and high per capita consumption. Other key regions exhibiting substantial growth potential include Europe and Asia-Pacific, with significant market expansion driven by factors such as rising disposable incomes, urbanization, and changing lifestyles.
- North America: High per capita consumption, developed retail infrastructure, and established distribution networks.
- Europe: Growing demand for convenient and healthy food options, particularly in Western European countries.
- Asia-Pacific: Rapid economic growth, urbanization, and changing consumer preferences driving market expansion.
Prepared Frozen Meals Product Landscape
The prepared frozen meals market offers a diverse range of products catering to varied consumer preferences and dietary needs. Innovations focus on healthier options, such as reduced sodium, organic ingredients, and plant-based protein sources. Technological advancements in freezing and packaging enhance product quality, extending shelf life and reducing waste. Key features include convenient packaging, single-serve portions, and microwaveable options. Unique selling propositions focus on taste, nutritional value, and convenience.
Key Drivers, Barriers & Challenges in Prepared Frozen Meals
Key Drivers:
- Rising disposable incomes and increased consumer spending on food.
- Busy lifestyles and the increasing demand for convenient meal solutions.
- Technological advancements in food processing and packaging.
- Growing popularity of online grocery delivery services.
Challenges & Restraints:
- Concerns about the nutritional value and high sodium content of some prepared frozen meals.
- Price sensitivity of consumers, impacting demand for premium products.
- Supply chain disruptions, impacting product availability and pricing. (xx% increase in transportation costs in 2022 impacting profitability).
- Competition from fresh, ready-to-heat meals, and restaurant options.
Emerging Opportunities in Prepared Frozen Meals
Emerging opportunities include the growth of meal kit delivery services, increasing demand for ethnic and specialized cuisines, and the rise of personalized nutrition plans. Untapped markets in developing economies, such as Africa and South America, offer significant growth potential. Innovations in sustainable packaging and reduced carbon footprint are also key emerging trends, enhancing product appeal and sustainability credentials.
Growth Accelerators in the Prepared Frozen Meals Industry
Strategic partnerships between food manufacturers and technology companies can drive innovation and efficiency in production and distribution. Expansion into new geographical markets, particularly in developing economies, provides access to vast consumer bases. Investment in research and development focused on healthier and more sustainable product formulations enhances product appeal and mitigates consumer concerns about nutritional content.
Key Players Shaping the Prepared Frozen Meals Market
- General Mills
- Nestle S.A.
- Tyson Foods
- ConAgra Brands
- Dr Oetker
- McCain Foods
- Kellogg Company
- Green Mill Foods
- Unilever
- J.M. Smucker
- Atkins Nutritionals
- Yum! Brands
- Luoyang CP Food
- COFCO
Notable Milestones in Prepared Frozen Meals Sector
- 2020: Increased adoption of e-commerce platforms for frozen food sales.
- 2021: Launch of several new plant-based prepared frozen meal options by major players.
- 2022: Significant investment in sustainable packaging solutions by key market players.
- 2023: Regulatory changes impacting labeling requirements for frozen meals.
In-Depth Prepared Frozen Meals Market Outlook
The prepared frozen meals market is poised for continued growth, driven by ongoing consumer demand for convenience and innovation in product offerings. Strategic partnerships, investment in research and development, and expansion into new markets are key opportunities for players to capture market share and enhance profitability. Technological advancements in freezing, packaging, and distribution will further shape market dynamics in the years to come. The focus on healthier and sustainable options will be a critical success factor.
Prepared Frozen Meals Segmentation
-
1. Application
- 1.1. Supermarkets & Hypermarkets
- 1.2. Convenience Stores
- 1.3. Online Retail
- 1.4. Others
-
2. Type
- 2.1. Vegetarian Meals
- 2.2. Chicken Meals
- 2.3. Beef Meals
- 2.4. Others
Prepared Frozen Meals Segmentation By Geography
-
1. North America
- 1.1. United States
- 1.2. Canada
- 1.3. Mexico
-
2. South America
- 2.1. Brazil
- 2.2. Argentina
- 2.3. Rest of South America
-
3. Europe
- 3.1. United Kingdom
- 3.2. Germany
- 3.3. France
- 3.4. Italy
- 3.5. Spain
- 3.6. Russia
- 3.7. Benelux
- 3.8. Nordics
- 3.9. Rest of Europe
-
4. Middle East & Africa
- 4.1. Turkey
- 4.2. Israel
- 4.3. GCC
- 4.4. North Africa
- 4.5. South Africa
- 4.6. Rest of Middle East & Africa
-
5. Asia Pacific
- 5.1. China
- 5.2. India
- 5.3. Japan
- 5.4. South Korea
- 5.5. ASEAN
- 5.6. Oceania
- 5.7. Rest of Asia Pacific
Prepared Frozen Meals Regional Market Share
Geographic Coverage of Prepared Frozen Meals
Prepared Frozen Meals REPORT HIGHLIGHTS
| Aspects | Details |
|---|---|
| Study Period | 2020-2034 |
| Base Year | 2025 |
| Estimated Year | 2026 |
| Forecast Period | 2026-2034 |
| Historical Period | 2020-2025 |
| Growth Rate | CAGR of 8.4% from 2020-2034 |
| Segmentation |
|
Table of Contents
- 1. Introduction
- 1.1. Research Scope
- 1.2. Market Segmentation
- 1.3. Research Methodology
- 1.4. Definitions and Assumptions
- 2. Executive Summary
- 2.1. Introduction
- 3. Market Dynamics
- 3.1. Introduction
- 3.2. Market Drivers
- 3.3. Market Restrains
- 3.4. Market Trends
- 4. Market Factor Analysis
- 4.1. Porters Five Forces
- 4.2. Supply/Value Chain
- 4.3. PESTEL analysis
- 4.4. Market Entropy
- 4.5. Patent/Trademark Analysis
- 5. Global Prepared Frozen Meals Analysis, Insights and Forecast, 2020-2032
- 5.1. Market Analysis, Insights and Forecast - by Application
- 5.1.1. Supermarkets & Hypermarkets
- 5.1.2. Convenience Stores
- 5.1.3. Online Retail
- 5.1.4. Others
- 5.2. Market Analysis, Insights and Forecast - by Type
- 5.2.1. Vegetarian Meals
- 5.2.2. Chicken Meals
- 5.2.3. Beef Meals
- 5.2.4. Others
- 5.3. Market Analysis, Insights and Forecast - by Region
- 5.3.1. North America
- 5.3.2. South America
- 5.3.3. Europe
- 5.3.4. Middle East & Africa
- 5.3.5. Asia Pacific
- 5.1. Market Analysis, Insights and Forecast - by Application
- 6. North America Prepared Frozen Meals Analysis, Insights and Forecast, 2020-2032
- 6.1. Market Analysis, Insights and Forecast - by Application
- 6.1.1. Supermarkets & Hypermarkets
- 6.1.2. Convenience Stores
- 6.1.3. Online Retail
- 6.1.4. Others
- 6.2. Market Analysis, Insights and Forecast - by Type
- 6.2.1. Vegetarian Meals
- 6.2.2. Chicken Meals
- 6.2.3. Beef Meals
- 6.2.4. Others
- 6.1. Market Analysis, Insights and Forecast - by Application
- 7. South America Prepared Frozen Meals Analysis, Insights and Forecast, 2020-2032
- 7.1. Market Analysis, Insights and Forecast - by Application
- 7.1.1. Supermarkets & Hypermarkets
- 7.1.2. Convenience Stores
- 7.1.3. Online Retail
- 7.1.4. Others
- 7.2. Market Analysis, Insights and Forecast - by Type
- 7.2.1. Vegetarian Meals
- 7.2.2. Chicken Meals
- 7.2.3. Beef Meals
- 7.2.4. Others
- 7.1. Market Analysis, Insights and Forecast - by Application
- 8. Europe Prepared Frozen Meals Analysis, Insights and Forecast, 2020-2032
- 8.1. Market Analysis, Insights and Forecast - by Application
- 8.1.1. Supermarkets & Hypermarkets
- 8.1.2. Convenience Stores
- 8.1.3. Online Retail
- 8.1.4. Others
- 8.2. Market Analysis, Insights and Forecast - by Type
- 8.2.1. Vegetarian Meals
- 8.2.2. Chicken Meals
- 8.2.3. Beef Meals
- 8.2.4. Others
- 8.1. Market Analysis, Insights and Forecast - by Application
- 9. Middle East & Africa Prepared Frozen Meals Analysis, Insights and Forecast, 2020-2032
- 9.1. Market Analysis, Insights and Forecast - by Application
- 9.1.1. Supermarkets & Hypermarkets
- 9.1.2. Convenience Stores
- 9.1.3. Online Retail
- 9.1.4. Others
- 9.2. Market Analysis, Insights and Forecast - by Type
- 9.2.1. Vegetarian Meals
- 9.2.2. Chicken Meals
- 9.2.3. Beef Meals
- 9.2.4. Others
- 9.1. Market Analysis, Insights and Forecast - by Application
- 10. Asia Pacific Prepared Frozen Meals Analysis, Insights and Forecast, 2020-2032
- 10.1. Market Analysis, Insights and Forecast - by Application
- 10.1.1. Supermarkets & Hypermarkets
- 10.1.2. Convenience Stores
- 10.1.3. Online Retail
- 10.1.4. Others
- 10.2. Market Analysis, Insights and Forecast - by Type
- 10.2.1. Vegetarian Meals
- 10.2.2. Chicken Meals
- 10.2.3. Beef Meals
- 10.2.4. Others
- 10.1. Market Analysis, Insights and Forecast - by Application
- 11. Competitive Analysis
- 11.1. Global Market Share Analysis 2025
- 11.2. Company Profiles
- 11.2.1 General Mills
- 11.2.1.1. Overview
- 11.2.1.2. Products
- 11.2.1.3. SWOT Analysis
- 11.2.1.4. Recent Developments
- 11.2.1.5. Financials (Based on Availability)
- 11.2.2 Nestle S.A.
- 11.2.2.1. Overview
- 11.2.2.2. Products
- 11.2.2.3. SWOT Analysis
- 11.2.2.4. Recent Developments
- 11.2.2.5. Financials (Based on Availability)
- 11.2.3 Tyson Foods
- 11.2.3.1. Overview
- 11.2.3.2. Products
- 11.2.3.3. SWOT Analysis
- 11.2.3.4. Recent Developments
- 11.2.3.5. Financials (Based on Availability)
- 11.2.4 ConAgra Brands
- 11.2.4.1. Overview
- 11.2.4.2. Products
- 11.2.4.3. SWOT Analysis
- 11.2.4.4. Recent Developments
- 11.2.4.5. Financials (Based on Availability)
- 11.2.5 Dr Oetker
- 11.2.5.1. Overview
- 11.2.5.2. Products
- 11.2.5.3. SWOT Analysis
- 11.2.5.4. Recent Developments
- 11.2.5.5. Financials (Based on Availability)
- 11.2.6 McCain Foods
- 11.2.6.1. Overview
- 11.2.6.2. Products
- 11.2.6.3. SWOT Analysis
- 11.2.6.4. Recent Developments
- 11.2.6.5. Financials (Based on Availability)
- 11.2.7 Kellogg Company
- 11.2.7.1. Overview
- 11.2.7.2. Products
- 11.2.7.3. SWOT Analysis
- 11.2.7.4. Recent Developments
- 11.2.7.5. Financials (Based on Availability)
- 11.2.8 Green Mill Foods
- 11.2.8.1. Overview
- 11.2.8.2. Products
- 11.2.8.3. SWOT Analysis
- 11.2.8.4. Recent Developments
- 11.2.8.5. Financials (Based on Availability)
- 11.2.9 Unilever
- 11.2.9.1. Overview
- 11.2.9.2. Products
- 11.2.9.3. SWOT Analysis
- 11.2.9.4. Recent Developments
- 11.2.9.5. Financials (Based on Availability)
- 11.2.10 J.M.Smucker
- 11.2.10.1. Overview
- 11.2.10.2. Products
- 11.2.10.3. SWOT Analysis
- 11.2.10.4. Recent Developments
- 11.2.10.5. Financials (Based on Availability)
- 11.2.11 Atkins Nutritionals
- 11.2.11.1. Overview
- 11.2.11.2. Products
- 11.2.11.3. SWOT Analysis
- 11.2.11.4. Recent Developments
- 11.2.11.5. Financials (Based on Availability)
- 11.2.12 Yum! Brands
- 11.2.12.1. Overview
- 11.2.12.2. Products
- 11.2.12.3. SWOT Analysis
- 11.2.12.4. Recent Developments
- 11.2.12.5. Financials (Based on Availability)
- 11.2.13 Luoyang CP Food
- 11.2.13.1. Overview
- 11.2.13.2. Products
- 11.2.13.3. SWOT Analysis
- 11.2.13.4. Recent Developments
- 11.2.13.5. Financials (Based on Availability)
- 11.2.14 COFCO
- 11.2.14.1. Overview
- 11.2.14.2. Products
- 11.2.14.3. SWOT Analysis
- 11.2.14.4. Recent Developments
- 11.2.14.5. Financials (Based on Availability)
- 11.2.1 General Mills
List of Figures
- Figure 1: Global Prepared Frozen Meals Revenue Breakdown (million, %) by Region 2025 & 2033
- Figure 2: Global Prepared Frozen Meals Volume Breakdown (K, %) by Region 2025 & 2033
- Figure 3: North America Prepared Frozen Meals Revenue (million), by Application 2025 & 2033
- Figure 4: North America Prepared Frozen Meals Volume (K), by Application 2025 & 2033
- Figure 5: North America Prepared Frozen Meals Revenue Share (%), by Application 2025 & 2033
- Figure 6: North America Prepared Frozen Meals Volume Share (%), by Application 2025 & 2033
- Figure 7: North America Prepared Frozen Meals Revenue (million), by Type 2025 & 2033
- Figure 8: North America Prepared Frozen Meals Volume (K), by Type 2025 & 2033
- Figure 9: North America Prepared Frozen Meals Revenue Share (%), by Type 2025 & 2033
- Figure 10: North America Prepared Frozen Meals Volume Share (%), by Type 2025 & 2033
- Figure 11: North America Prepared Frozen Meals Revenue (million), by Country 2025 & 2033
- Figure 12: North America Prepared Frozen Meals Volume (K), by Country 2025 & 2033
- Figure 13: North America Prepared Frozen Meals Revenue Share (%), by Country 2025 & 2033
- Figure 14: North America Prepared Frozen Meals Volume Share (%), by Country 2025 & 2033
- Figure 15: South America Prepared Frozen Meals Revenue (million), by Application 2025 & 2033
- Figure 16: South America Prepared Frozen Meals Volume (K), by Application 2025 & 2033
- Figure 17: South America Prepared Frozen Meals Revenue Share (%), by Application 2025 & 2033
- Figure 18: South America Prepared Frozen Meals Volume Share (%), by Application 2025 & 2033
- Figure 19: South America Prepared Frozen Meals Revenue (million), by Type 2025 & 2033
- Figure 20: South America Prepared Frozen Meals Volume (K), by Type 2025 & 2033
- Figure 21: South America Prepared Frozen Meals Revenue Share (%), by Type 2025 & 2033
- Figure 22: South America Prepared Frozen Meals Volume Share (%), by Type 2025 & 2033
- Figure 23: South America Prepared Frozen Meals Revenue (million), by Country 2025 & 2033
- Figure 24: South America Prepared Frozen Meals Volume (K), by Country 2025 & 2033
- Figure 25: South America Prepared Frozen Meals Revenue Share (%), by Country 2025 & 2033
- Figure 26: South America Prepared Frozen Meals Volume Share (%), by Country 2025 & 2033
- Figure 27: Europe Prepared Frozen Meals Revenue (million), by Application 2025 & 2033
- Figure 28: Europe Prepared Frozen Meals Volume (K), by Application 2025 & 2033
- Figure 29: Europe Prepared Frozen Meals Revenue Share (%), by Application 2025 & 2033
- Figure 30: Europe Prepared Frozen Meals Volume Share (%), by Application 2025 & 2033
- Figure 31: Europe Prepared Frozen Meals Revenue (million), by Type 2025 & 2033
- Figure 32: Europe Prepared Frozen Meals Volume (K), by Type 2025 & 2033
- Figure 33: Europe Prepared Frozen Meals Revenue Share (%), by Type 2025 & 2033
- Figure 34: Europe Prepared Frozen Meals Volume Share (%), by Type 2025 & 2033
- Figure 35: Europe Prepared Frozen Meals Revenue (million), by Country 2025 & 2033
- Figure 36: Europe Prepared Frozen Meals Volume (K), by Country 2025 & 2033
- Figure 37: Europe Prepared Frozen Meals Revenue Share (%), by Country 2025 & 2033
- Figure 38: Europe Prepared Frozen Meals Volume Share (%), by Country 2025 & 2033
- Figure 39: Middle East & Africa Prepared Frozen Meals Revenue (million), by Application 2025 & 2033
- Figure 40: Middle East & Africa Prepared Frozen Meals Volume (K), by Application 2025 & 2033
- Figure 41: Middle East & Africa Prepared Frozen Meals Revenue Share (%), by Application 2025 & 2033
- Figure 42: Middle East & Africa Prepared Frozen Meals Volume Share (%), by Application 2025 & 2033
- Figure 43: Middle East & Africa Prepared Frozen Meals Revenue (million), by Type 2025 & 2033
- Figure 44: Middle East & Africa Prepared Frozen Meals Volume (K), by Type 2025 & 2033
- Figure 45: Middle East & Africa Prepared Frozen Meals Revenue Share (%), by Type 2025 & 2033
- Figure 46: Middle East & Africa Prepared Frozen Meals Volume Share (%), by Type 2025 & 2033
- Figure 47: Middle East & Africa Prepared Frozen Meals Revenue (million), by Country 2025 & 2033
- Figure 48: Middle East & Africa Prepared Frozen Meals Volume (K), by Country 2025 & 2033
- Figure 49: Middle East & Africa Prepared Frozen Meals Revenue Share (%), by Country 2025 & 2033
- Figure 50: Middle East & Africa Prepared Frozen Meals Volume Share (%), by Country 2025 & 2033
- Figure 51: Asia Pacific Prepared Frozen Meals Revenue (million), by Application 2025 & 2033
- Figure 52: Asia Pacific Prepared Frozen Meals Volume (K), by Application 2025 & 2033
- Figure 53: Asia Pacific Prepared Frozen Meals Revenue Share (%), by Application 2025 & 2033
- Figure 54: Asia Pacific Prepared Frozen Meals Volume Share (%), by Application 2025 & 2033
- Figure 55: Asia Pacific Prepared Frozen Meals Revenue (million), by Type 2025 & 2033
- Figure 56: Asia Pacific Prepared Frozen Meals Volume (K), by Type 2025 & 2033
- Figure 57: Asia Pacific Prepared Frozen Meals Revenue Share (%), by Type 2025 & 2033
- Figure 58: Asia Pacific Prepared Frozen Meals Volume Share (%), by Type 2025 & 2033
- Figure 59: Asia Pacific Prepared Frozen Meals Revenue (million), by Country 2025 & 2033
- Figure 60: Asia Pacific Prepared Frozen Meals Volume (K), by Country 2025 & 2033
- Figure 61: Asia Pacific Prepared Frozen Meals Revenue Share (%), by Country 2025 & 2033
- Figure 62: Asia Pacific Prepared Frozen Meals Volume Share (%), by Country 2025 & 2033
List of Tables
- Table 1: Global Prepared Frozen Meals Revenue million Forecast, by Application 2020 & 2033
- Table 2: Global Prepared Frozen Meals Volume K Forecast, by Application 2020 & 2033
- Table 3: Global Prepared Frozen Meals Revenue million Forecast, by Type 2020 & 2033
- Table 4: Global Prepared Frozen Meals Volume K Forecast, by Type 2020 & 2033
- Table 5: Global Prepared Frozen Meals Revenue million Forecast, by Region 2020 & 2033
- Table 6: Global Prepared Frozen Meals Volume K Forecast, by Region 2020 & 2033
- Table 7: Global Prepared Frozen Meals Revenue million Forecast, by Application 2020 & 2033
- Table 8: Global Prepared Frozen Meals Volume K Forecast, by Application 2020 & 2033
- Table 9: Global Prepared Frozen Meals Revenue million Forecast, by Type 2020 & 2033
- Table 10: Global Prepared Frozen Meals Volume K Forecast, by Type 2020 & 2033
- Table 11: Global Prepared Frozen Meals Revenue million Forecast, by Country 2020 & 2033
- Table 12: Global Prepared Frozen Meals Volume K Forecast, by Country 2020 & 2033
- Table 13: United States Prepared Frozen Meals Revenue (million) Forecast, by Application 2020 & 2033
- Table 14: United States Prepared Frozen Meals Volume (K) Forecast, by Application 2020 & 2033
- Table 15: Canada Prepared Frozen Meals Revenue (million) Forecast, by Application 2020 & 2033
- Table 16: Canada Prepared Frozen Meals Volume (K) Forecast, by Application 2020 & 2033
- Table 17: Mexico Prepared Frozen Meals Revenue (million) Forecast, by Application 2020 & 2033
- Table 18: Mexico Prepared Frozen Meals Volume (K) Forecast, by Application 2020 & 2033
- Table 19: Global Prepared Frozen Meals Revenue million Forecast, by Application 2020 & 2033
- Table 20: Global Prepared Frozen Meals Volume K Forecast, by Application 2020 & 2033
- Table 21: Global Prepared Frozen Meals Revenue million Forecast, by Type 2020 & 2033
- Table 22: Global Prepared Frozen Meals Volume K Forecast, by Type 2020 & 2033
- Table 23: Global Prepared Frozen Meals Revenue million Forecast, by Country 2020 & 2033
- Table 24: Global Prepared Frozen Meals Volume K Forecast, by Country 2020 & 2033
- Table 25: Brazil Prepared Frozen Meals Revenue (million) Forecast, by Application 2020 & 2033
- Table 26: Brazil Prepared Frozen Meals Volume (K) Forecast, by Application 2020 & 2033
- Table 27: Argentina Prepared Frozen Meals Revenue (million) Forecast, by Application 2020 & 2033
- Table 28: Argentina Prepared Frozen Meals Volume (K) Forecast, by Application 2020 & 2033
- Table 29: Rest of South America Prepared Frozen Meals Revenue (million) Forecast, by Application 2020 & 2033
- Table 30: Rest of South America Prepared Frozen Meals Volume (K) Forecast, by Application 2020 & 2033
- Table 31: Global Prepared Frozen Meals Revenue million Forecast, by Application 2020 & 2033
- Table 32: Global Prepared Frozen Meals Volume K Forecast, by Application 2020 & 2033
- Table 33: Global Prepared Frozen Meals Revenue million Forecast, by Type 2020 & 2033
- Table 34: Global Prepared Frozen Meals Volume K Forecast, by Type 2020 & 2033
- Table 35: Global Prepared Frozen Meals Revenue million Forecast, by Country 2020 & 2033
- Table 36: Global Prepared Frozen Meals Volume K Forecast, by Country 2020 & 2033
- Table 37: United Kingdom Prepared Frozen Meals Revenue (million) Forecast, by Application 2020 & 2033
- Table 38: United Kingdom Prepared Frozen Meals Volume (K) Forecast, by Application 2020 & 2033
- Table 39: Germany Prepared Frozen Meals Revenue (million) Forecast, by Application 2020 & 2033
- Table 40: Germany Prepared Frozen Meals Volume (K) Forecast, by Application 2020 & 2033
- Table 41: France Prepared Frozen Meals Revenue (million) Forecast, by Application 2020 & 2033
- Table 42: France Prepared Frozen Meals Volume (K) Forecast, by Application 2020 & 2033
- Table 43: Italy Prepared Frozen Meals Revenue (million) Forecast, by Application 2020 & 2033
- Table 44: Italy Prepared Frozen Meals Volume (K) Forecast, by Application 2020 & 2033
- Table 45: Spain Prepared Frozen Meals Revenue (million) Forecast, by Application 2020 & 2033
- Table 46: Spain Prepared Frozen Meals Volume (K) Forecast, by Application 2020 & 2033
- Table 47: Russia Prepared Frozen Meals Revenue (million) Forecast, by Application 2020 & 2033
- Table 48: Russia Prepared Frozen Meals Volume (K) Forecast, by Application 2020 & 2033
- Table 49: Benelux Prepared Frozen Meals Revenue (million) Forecast, by Application 2020 & 2033
- Table 50: Benelux Prepared Frozen Meals Volume (K) Forecast, by Application 2020 & 2033
- Table 51: Nordics Prepared Frozen Meals Revenue (million) Forecast, by Application 2020 & 2033
- Table 52: Nordics Prepared Frozen Meals Volume (K) Forecast, by Application 2020 & 2033
- Table 53: Rest of Europe Prepared Frozen Meals Revenue (million) Forecast, by Application 2020 & 2033
- Table 54: Rest of Europe Prepared Frozen Meals Volume (K) Forecast, by Application 2020 & 2033
- Table 55: Global Prepared Frozen Meals Revenue million Forecast, by Application 2020 & 2033
- Table 56: Global Prepared Frozen Meals Volume K Forecast, by Application 2020 & 2033
- Table 57: Global Prepared Frozen Meals Revenue million Forecast, by Type 2020 & 2033
- Table 58: Global Prepared Frozen Meals Volume K Forecast, by Type 2020 & 2033
- Table 59: Global Prepared Frozen Meals Revenue million Forecast, by Country 2020 & 2033
- Table 60: Global Prepared Frozen Meals Volume K Forecast, by Country 2020 & 2033
- Table 61: Turkey Prepared Frozen Meals Revenue (million) Forecast, by Application 2020 & 2033
- Table 62: Turkey Prepared Frozen Meals Volume (K) Forecast, by Application 2020 & 2033
- Table 63: Israel Prepared Frozen Meals Revenue (million) Forecast, by Application 2020 & 2033
- Table 64: Israel Prepared Frozen Meals Volume (K) Forecast, by Application 2020 & 2033
- Table 65: GCC Prepared Frozen Meals Revenue (million) Forecast, by Application 2020 & 2033
- Table 66: GCC Prepared Frozen Meals Volume (K) Forecast, by Application 2020 & 2033
- Table 67: North Africa Prepared Frozen Meals Revenue (million) Forecast, by Application 2020 & 2033
- Table 68: North Africa Prepared Frozen Meals Volume (K) Forecast, by Application 2020 & 2033
- Table 69: South Africa Prepared Frozen Meals Revenue (million) Forecast, by Application 2020 & 2033
- Table 70: South Africa Prepared Frozen Meals Volume (K) Forecast, by Application 2020 & 2033
- Table 71: Rest of Middle East & Africa Prepared Frozen Meals Revenue (million) Forecast, by Application 2020 & 2033
- Table 72: Rest of Middle East & Africa Prepared Frozen Meals Volume (K) Forecast, by Application 2020 & 2033
- Table 73: Global Prepared Frozen Meals Revenue million Forecast, by Application 2020 & 2033
- Table 74: Global Prepared Frozen Meals Volume K Forecast, by Application 2020 & 2033
- Table 75: Global Prepared Frozen Meals Revenue million Forecast, by Type 2020 & 2033
- Table 76: Global Prepared Frozen Meals Volume K Forecast, by Type 2020 & 2033
- Table 77: Global Prepared Frozen Meals Revenue million Forecast, by Country 2020 & 2033
- Table 78: Global Prepared Frozen Meals Volume K Forecast, by Country 2020 & 2033
- Table 79: China Prepared Frozen Meals Revenue (million) Forecast, by Application 2020 & 2033
- Table 80: China Prepared Frozen Meals Volume (K) Forecast, by Application 2020 & 2033
- Table 81: India Prepared Frozen Meals Revenue (million) Forecast, by Application 2020 & 2033
- Table 82: India Prepared Frozen Meals Volume (K) Forecast, by Application 2020 & 2033
- Table 83: Japan Prepared Frozen Meals Revenue (million) Forecast, by Application 2020 & 2033
- Table 84: Japan Prepared Frozen Meals Volume (K) Forecast, by Application 2020 & 2033
- Table 85: South Korea Prepared Frozen Meals Revenue (million) Forecast, by Application 2020 & 2033
- Table 86: South Korea Prepared Frozen Meals Volume (K) Forecast, by Application 2020 & 2033
- Table 87: ASEAN Prepared Frozen Meals Revenue (million) Forecast, by Application 2020 & 2033
- Table 88: ASEAN Prepared Frozen Meals Volume (K) Forecast, by Application 2020 & 2033
- Table 89: Oceania Prepared Frozen Meals Revenue (million) Forecast, by Application 2020 & 2033
- Table 90: Oceania Prepared Frozen Meals Volume (K) Forecast, by Application 2020 & 2033
- Table 91: Rest of Asia Pacific Prepared Frozen Meals Revenue (million) Forecast, by Application 2020 & 2033
- Table 92: Rest of Asia Pacific Prepared Frozen Meals Volume (K) Forecast, by Application 2020 & 2033
Frequently Asked Questions
1. What is the projected Compound Annual Growth Rate (CAGR) of the Prepared Frozen Meals?
The projected CAGR is approximately 8.4%.
2. Which companies are prominent players in the Prepared Frozen Meals?
Key companies in the market include General Mills, Nestle S.A., Tyson Foods, ConAgra Brands, Dr Oetker, McCain Foods, Kellogg Company, Green Mill Foods, Unilever, J.M.Smucker, Atkins Nutritionals, Yum! Brands, Luoyang CP Food, COFCO.
3. What are the main segments of the Prepared Frozen Meals?
The market segments include Application, Type.
4. Can you provide details about the market size?
The market size is estimated to be USD 187740 million as of 2022.
5. What are some drivers contributing to market growth?
N/A
6. What are the notable trends driving market growth?
N/A
7. Are there any restraints impacting market growth?
N/A
8. Can you provide examples of recent developments in the market?
N/A
9. What pricing options are available for accessing the report?
Pricing options include single-user, multi-user, and enterprise licenses priced at USD 3950.00, USD 5925.00, and USD 7900.00 respectively.
10. Is the market size provided in terms of value or volume?
The market size is provided in terms of value, measured in million and volume, measured in K.
11. Are there any specific market keywords associated with the report?
Yes, the market keyword associated with the report is "Prepared Frozen Meals," which aids in identifying and referencing the specific market segment covered.
12. How do I determine which pricing option suits my needs best?
The pricing options vary based on user requirements and access needs. Individual users may opt for single-user licenses, while businesses requiring broader access may choose multi-user or enterprise licenses for cost-effective access to the report.
13. Are there any additional resources or data provided in the Prepared Frozen Meals report?
While the report offers comprehensive insights, it's advisable to review the specific contents or supplementary materials provided to ascertain if additional resources or data are available.
14. How can I stay updated on further developments or reports in the Prepared Frozen Meals?
To stay informed about further developments, trends, and reports in the Prepared Frozen Meals, consider subscribing to industry newsletters, following relevant companies and organizations, or regularly checking reputable industry news sources and publications.
Methodology
Step 1 - Identification of Relevant Samples Size from Population Database


Step 2 - Approaches for Defining Global Market Size (Value, Volume* & Price*)

Note*: In applicable scenarios
Step 3 - Data Sources
Primary Research
- Web Analytics
- Survey Reports
- Research Institute
- Latest Research Reports
- Opinion Leaders
Secondary Research
- Annual Reports
- White Paper
- Latest Press Release
- Industry Association
- Paid Database
- Investor Presentations

Step 4 - Data Triangulation
Involves using different sources of information in order to increase the validity of a study
These sources are likely to be stakeholders in a program - participants, other researchers, program staff, other community members, and so on.
Then we put all data in single framework & apply various statistical tools to find out the dynamic on the market.
During the analysis stage, feedback from the stakeholder groups would be compared to determine areas of agreement as well as areas of divergence