

Key Insights
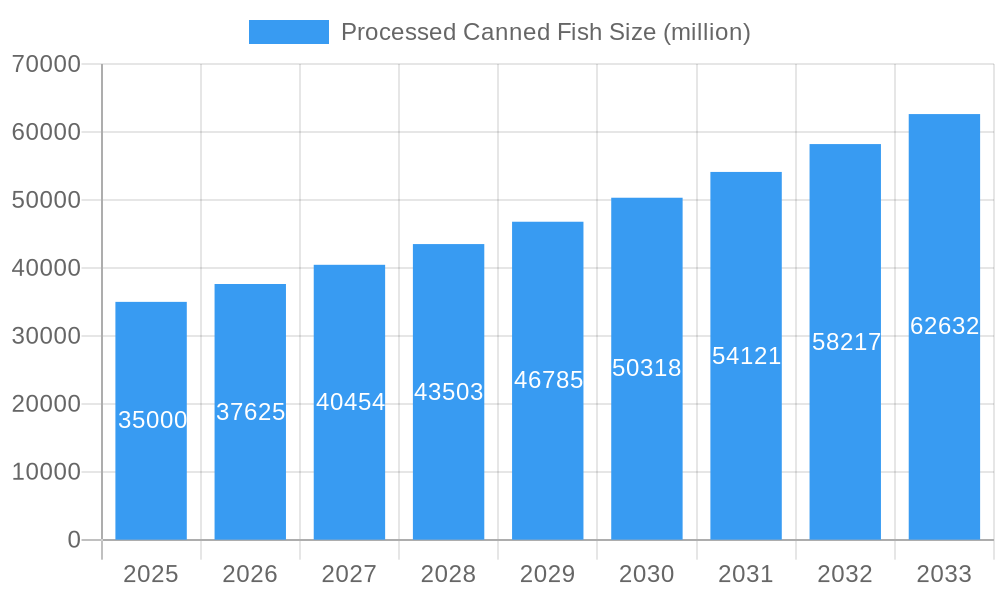
The global processed canned fish market is poised for substantial growth, projected to reach an estimated $35,000 million by 2025, with a robust Compound Annual Growth Rate (CAGR) of 7.5% during the forecast period of 2025-2033. This expansion is underpinned by a confluence of factors, including increasing consumer demand for convenient and shelf-stable protein sources, particularly in developing economies. The rising awareness of the health benefits associated with fish consumption, such as omega-3 fatty acids, further fuels market penetration. Key market drivers include evolving consumer lifestyles, a preference for quick meal solutions, and the extended shelf life offered by canned fish. The market's trajectory is significantly influenced by these trends, making processed canned fish an attractive segment within the broader food industry.
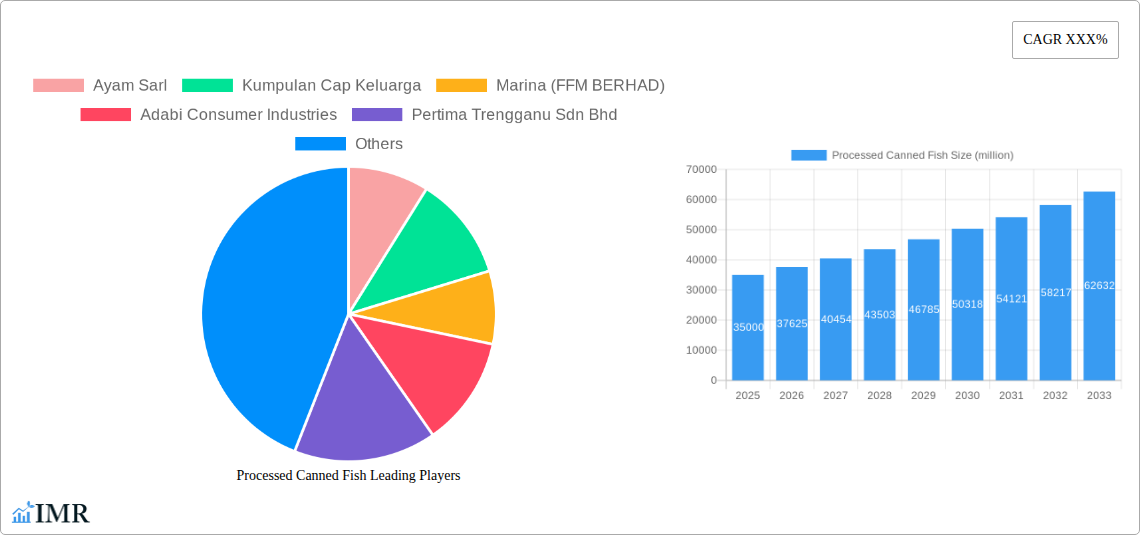
Processed Canned Fish Market Size (In Billion)
The market is segmented into various applications and types, each contributing to its dynamic nature. Supermarkets and hypermarkets represent the dominant distribution channel, followed by the rapidly growing online retail segment, which offers unparalleled convenience and accessibility. Convenience stores are also emerging as significant players, catering to impulse purchases and on-the-go consumption. In terms of product type, canned fish, encompassing both marine and freshwater varieties, continues to capture consumer interest. While the market demonstrates strong growth potential, certain restraints such as fluctuating raw material prices and increasing competition from fresh and frozen seafood alternatives need to be strategically managed by industry stakeholders. Companies like Ayam Sarl, Kumpulan Cap Keluarga, and Marina (FFM BERHAD) are actively shaping the market landscape through product innovation and strategic market positioning.
Processed Canned Fish Company Market Share
Processed Canned Fish Market Report: Navigating the Global Shelf
This comprehensive report offers an in-depth analysis of the global processed canned fish market, examining its intricate dynamics, growth trajectories, and future outlook. Delving into both parent and child market segments, this study provides invaluable insights for industry stakeholders, including manufacturers, suppliers, distributors, and investors. The report leverages a robust research methodology, encompassing historical data from 2019–2024, a base year of 2025, and a detailed forecast period from 2025–2033. All quantitative data is presented in million units for clarity and industry relevance.
Processed Canned Fish Market Dynamics & Structure
The processed canned fish market exhibits a moderate to high level of market concentration, with key players actively shaping its landscape. Technological innovation is a significant driver, particularly in areas such as improved canning techniques for enhanced shelf-life and nutrient retention, as well as the development of value-added products with diverse flavor profiles and ingredients. Regulatory frameworks, primarily focused on food safety, labeling standards (e.g., origin, sustainability), and import/export regulations, play a crucial role in market access and product compliance. Competitive product substitutes, including fresh seafood, frozen fish, and plant-based protein alternatives, pose a constant challenge, necessitating product differentiation and competitive pricing strategies. End-user demographics are increasingly influenced by a growing demand for convenient, portable, and protein-rich food options, particularly among busy households and on-the-go consumers. Mergers and acquisitions (M&A) are a notable trend, with larger entities acquiring smaller competitors to expand product portfolios, geographical reach, and market share.
- Market Concentration: Dominated by a blend of multinational corporations and regional leaders.
- Technological Innovation: Focus on extended shelf-life, nutrient preservation, and novel flavor development.
- Regulatory Frameworks: Stringent food safety standards, labeling compliance, and sustainability certifications are paramount.
- Competitive Substitutes: Fresh, frozen, and plant-based alternatives exert price and choice pressure.
- End-User Demographics: Driven by demand for convenience, health benefits, and affordability.
- M&A Trends: Strategic acquisitions to consolidate market share and diversify product offerings.
Processed Canned Fish Growth Trends & Insights
The global processed canned fish market is poised for consistent and robust growth over the forecast period. The market size has witnessed a steady evolution, driven by an increasing consumer preference for convenient and protein-rich food solutions. Adoption rates for canned fish are particularly high in developing economies due to its affordability and long shelf-life, while developed markets are seeing a resurgence driven by health-conscious consumers and demand for sustainable seafood options. Technological disruptions, such as advanced sterilization techniques and innovative packaging solutions that preserve freshness and texture, are enhancing product appeal and expanding consumption occasions. Consumer behavior shifts are a significant factor, with a growing emphasis on health and wellness, leading to increased demand for omega-3 rich fish like sardines and mackerel. The convenience factor remains paramount, making canned fish an ideal option for quick meals and travel. Sustainability concerns are also gaining traction, with consumers actively seeking out responsibly sourced and certified canned fish products.
The Compound Annual Growth Rate (CAGR) for the processed canned fish market is projected to be approximately 4.2% during the forecast period (2025–2033). This growth will be fueled by a combination of factors, including an expanding global population, rising disposable incomes in emerging markets, and ongoing innovation in product development and marketing. Market penetration is expected to deepen, particularly in regions where canned fish is already a staple, and to see significant expansion in new geographical territories. The increasing awareness of the health benefits associated with regular consumption of fish, such as its rich omega-3 fatty acid content, will further propel demand. Furthermore, the versatility of canned fish in culinary applications, ranging from simple snacks to elaborate dishes, contributes to its sustained popularity. The industry is also adapting to evolving retail landscapes, with a growing emphasis on online sales channels and direct-to-consumer models.
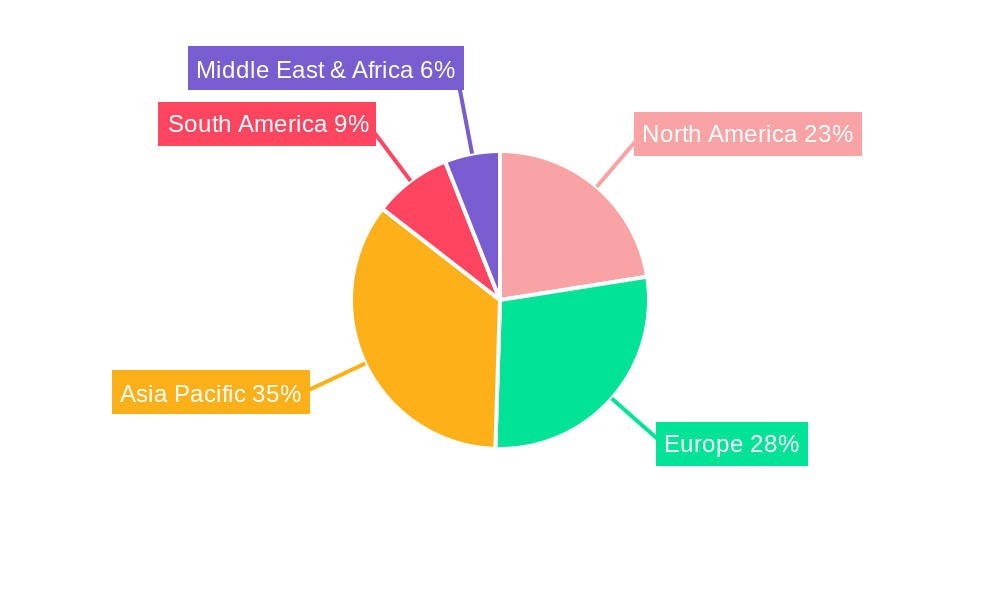
Dominant Regions, Countries, or Segments in Processed Canned Fish
The Supermarkets/Hypermarkets segment, within the Application category, is identified as the dominant channel driving growth in the processed canned fish market. This dominance stems from their extensive reach, ability to offer a wide variety of brands and product types, and their role as primary grocery shopping destinations for a vast consumer base. The broad aisle space and strategic product placement within these retail giants facilitate high sales volumes. Economic policies that support trade and reduce import tariffs in key consuming nations also contribute to the accessibility and affordability of canned fish in these large retail formats.
Key Drivers for Supermarket/Hypermarket Dominance:
- Extensive Consumer Reach: Access to a broad demographic of shoppers.
- Product Variety & Choice: Offering a wide range of canned fish types, brands, and flavors.
- Promotional Activities: Effective in-store promotions and discounts drive impulse purchases.
- Supply Chain Efficiency: Centralized distribution networks support consistent stock availability.
- Brand Visibility: Prominent shelf space ensures strong brand exposure.
In terms of Type, Canned Fish (encompassing tuna, sardines, mackerel, salmon, etc.) collectively holds the leading position, outpacing Canned Freshwater Fish in overall market share. This is due to the widespread availability of marine fish species, their established popularity in global cuisines, and their significant nutritional benefits, particularly omega-3 fatty acids. The infrastructure supporting the harvesting, processing, and distribution of these marine resources is more developed and extensive.
Key Drivers for Canned Fish Dominance:
- Global Availability of Species: Abundant and diverse marine fish stocks support large-scale production.
- Established Consumer Palates: Traditional acceptance and preference for marine fish in many cultures.
- Nutritional Superiority: High content of omega-3 fatty acids, vitamin D, and protein.
- Economies of Scale: Large-scale processing and distribution lead to competitive pricing.
- Culinary Versatility: Adaptable to a wide array of recipes and meal preparations.
Processed Canned Fish Product Landscape
The processed canned fish market is characterized by a dynamic product landscape driven by innovation and evolving consumer preferences. Key product innovations include the introduction of value-added canned fish with a diverse range of sauces and seasonings (e.g., chili, curry, olive oil, lemon pepper), catering to specific taste profiles. Advancements in canning technology are also enabling the preservation of higher nutritional content, such as omega-3 fatty acids, and improved texture, addressing historical consumer concerns. Performance metrics are increasingly focusing on sustainability certifications, such as MSC (Marine Stewardship Council) or ASC (Aquaculture Stewardship Council) labels, which are becoming significant unique selling propositions. Technological advancements in retort pouch packaging are also emerging, offering greater convenience and a lighter alternative to traditional cans.
Key Drivers, Barriers & Challenges in Processed Canned Fish
Key Drivers:
- Convenience and Portability: The inherent nature of canned fish makes it an ideal choice for busy lifestyles, travel, and quick meal solutions.
- Nutritional Benefits: High content of protein and essential omega-3 fatty acids appeals to health-conscious consumers.
- Affordability: Canned fish often presents a more economical protein source compared to fresh alternatives.
- Extended Shelf-Life: The canning process ensures long-term preservation without refrigeration, reducing food waste and increasing accessibility.
- Product Innovation: Development of new flavors, sauces, and ready-to-eat formats caters to diverse consumer tastes and preferences.
Barriers & Challenges:
- Perception of Quality: Some consumers associate canned fish with lower quality or a less appealing texture compared to fresh options.
- Sustainability Concerns: Overfishing and unethical fishing practices can negatively impact consumer perception and drive demand for certified sustainable products, which can be more expensive.
- Fluctuations in Raw Material Prices: The availability and cost of fish species can be volatile, impacting production costs and retail pricing.
- Competition from Alternatives: A growing array of convenient protein sources, including plant-based options, poses significant competition.
- Regulatory Hurdles: Stringent food safety regulations and labeling requirements across different regions can create compliance complexities and increase operational costs.
- Supply Chain Disruptions: Geopolitical events, climate change impacts on fish stocks, and logistical challenges can disrupt the consistent supply of raw materials and finished products.
Emerging Opportunities in Processed Canned Fish
Emerging opportunities lie in the development of premium and artisanal canned fish products, targeting consumers willing to pay a premium for superior quality, unique flavor combinations, and ethically sourced ingredients. The expansion into niche markets, such as plant-based tuna alternatives derived from legumes or algae, presents a significant growth avenue to cater to vegan and vegetarian consumers. Furthermore, the increasing demand for ready-to-eat meals and meal kits incorporating canned fish offers an opportunity to develop convenient, healthy, and flavorful options. Exploring innovative packaging solutions, such as sustainable and biodegradable materials, can also resonate with environmentally conscious consumers. Digital transformation presents opportunities for direct-to-consumer sales, enabling brands to build stronger relationships with their customer base and offer personalized product selections.
Growth Accelerators in the Processed Canned Fish Industry
Long-term growth in the processed canned fish industry will be significantly accelerated by technological breakthroughs in sustainable aquaculture and fishing practices, ensuring a stable and environmentally responsible supply of raw materials. Strategic partnerships between processors and technology providers for advanced preservation techniques and packaging innovations will further enhance product appeal and shelf-life. Market expansion into underserved geographical regions, particularly those with growing middle classes and increasing demand for convenient protein sources, will be a key catalyst. Furthermore, robust marketing campaigns focusing on health benefits and sustainability credentials will be crucial in shifting consumer perceptions and driving demand. The development of diversified product portfolios, including plant-based alternatives and ready-to-cook meal components, will also play a pivotal role in capturing broader consumer segments.
Key Players Shaping the Processed Canned Fish Market
- Ayam Sarl
- Kumpulan Cap Keluarga
- Marina (FFM BERHAD)
- Adabi Consumer Industries
- Pertima Trengganu Sdn Bhd
- KING CUP (MCM)
- PROTIGAM
Notable Milestones in Processed Canned Fish Sector
- 2019: Increased focus on sustainable sourcing certifications (e.g., MSC) by major manufacturers.
- 2020: Surge in demand for shelf-stable, convenient food options due to global pandemic.
- 2021: Introduction of wider variety of flavor profiles and value-added canned fish products in key markets.
- 2022: Growing consumer awareness and demand for plant-based seafood alternatives.
- 2023: Investment in advanced processing technologies to enhance nutrient retention and texture.
- 2024: Expansion of online retail channels and direct-to-consumer sales strategies by leading companies.
In-Depth Processed Canned Fish Market Outlook
The future outlook for the processed canned fish market remains highly promising, driven by persistent consumer demand for convenient, nutritious, and affordable protein. Growth accelerators will continue to be fueled by ongoing innovation in product development, including the expansion of value-added options and the exploration of novel ingredients and flavor profiles. Sustainability will increasingly become a defining factor, with brands that demonstrate a commitment to responsible sourcing and eco-friendly practices gaining a competitive edge. Strategic market expansion into emerging economies, coupled with robust digital marketing efforts, will unlock new consumer segments and drive revenue growth. The industry is also expected to adapt to evolving dietary trends, potentially through the increased development and promotion of canned fish in plant-based formulations. Overall, the processed canned fish market is set for sustained expansion, presenting significant strategic opportunities for agile and forward-thinking players.
Processed Canned Fish Segmentation
-
1. Application
- 1.1. Supermarkets/ Hypermarkets
- 1.2. Convenience Stores
- 1.3. Online Retailers
- 1.4. Others
-
2. Type
- 2.1. Canned Fish
- 2.2. Canned Freshwater Fish
Processed Canned Fish Segmentation By Geography
-
1. North America
- 1.1. United States
- 1.2. Canada
- 1.3. Mexico
-
2. South America
- 2.1. Brazil
- 2.2. Argentina
- 2.3. Rest of South America
-
3. Europe
- 3.1. United Kingdom
- 3.2. Germany
- 3.3. France
- 3.4. Italy
- 3.5. Spain
- 3.6. Russia
- 3.7. Benelux
- 3.8. Nordics
- 3.9. Rest of Europe
-
4. Middle East & Africa
- 4.1. Turkey
- 4.2. Israel
- 4.3. GCC
- 4.4. North Africa
- 4.5. South Africa
- 4.6. Rest of Middle East & Africa
-
5. Asia Pacific
- 5.1. China
- 5.2. India
- 5.3. Japan
- 5.4. South Korea
- 5.5. ASEAN
- 5.6. Oceania
- 5.7. Rest of Asia Pacific
Processed Canned Fish Regional Market Share
Geographic Coverage of Processed Canned Fish
Processed Canned Fish REPORT HIGHLIGHTS
| Aspects | Details |
|---|---|
| Study Period | 2020-2034 |
| Base Year | 2025 |
| Estimated Year | 2026 |
| Forecast Period | 2026-2034 |
| Historical Period | 2020-2025 |
| Growth Rate | CAGR of 3.4% from 2020-2034 |
| Segmentation |
|
Table of Contents
- 1. Introduction
- 1.1. Research Scope
- 1.2. Market Segmentation
- 1.3. Research Methodology
- 1.4. Definitions and Assumptions
- 2. Executive Summary
- 2.1. Introduction
- 3. Market Dynamics
- 3.1. Introduction
- 3.2. Market Drivers
- 3.3. Market Restrains
- 3.4. Market Trends
- 4. Market Factor Analysis
- 4.1. Porters Five Forces
- 4.2. Supply/Value Chain
- 4.3. PESTEL analysis
- 4.4. Market Entropy
- 4.5. Patent/Trademark Analysis
- 5. Global Processed Canned Fish Analysis, Insights and Forecast, 2020-2032
- 5.1. Market Analysis, Insights and Forecast - by Application
- 5.1.1. Supermarkets/ Hypermarkets
- 5.1.2. Convenience Stores
- 5.1.3. Online Retailers
- 5.1.4. Others
- 5.2. Market Analysis, Insights and Forecast - by Type
- 5.2.1. Canned Fish
- 5.2.2. Canned Freshwater Fish
- 5.3. Market Analysis, Insights and Forecast - by Region
- 5.3.1. North America
- 5.3.2. South America
- 5.3.3. Europe
- 5.3.4. Middle East & Africa
- 5.3.5. Asia Pacific
- 5.1. Market Analysis, Insights and Forecast - by Application
- 6. North America Processed Canned Fish Analysis, Insights and Forecast, 2020-2032
- 6.1. Market Analysis, Insights and Forecast - by Application
- 6.1.1. Supermarkets/ Hypermarkets
- 6.1.2. Convenience Stores
- 6.1.3. Online Retailers
- 6.1.4. Others
- 6.2. Market Analysis, Insights and Forecast - by Type
- 6.2.1. Canned Fish
- 6.2.2. Canned Freshwater Fish
- 6.1. Market Analysis, Insights and Forecast - by Application
- 7. South America Processed Canned Fish Analysis, Insights and Forecast, 2020-2032
- 7.1. Market Analysis, Insights and Forecast - by Application
- 7.1.1. Supermarkets/ Hypermarkets
- 7.1.2. Convenience Stores
- 7.1.3. Online Retailers
- 7.1.4. Others
- 7.2. Market Analysis, Insights and Forecast - by Type
- 7.2.1. Canned Fish
- 7.2.2. Canned Freshwater Fish
- 7.1. Market Analysis, Insights and Forecast - by Application
- 8. Europe Processed Canned Fish Analysis, Insights and Forecast, 2020-2032
- 8.1. Market Analysis, Insights and Forecast - by Application
- 8.1.1. Supermarkets/ Hypermarkets
- 8.1.2. Convenience Stores
- 8.1.3. Online Retailers
- 8.1.4. Others
- 8.2. Market Analysis, Insights and Forecast - by Type
- 8.2.1. Canned Fish
- 8.2.2. Canned Freshwater Fish
- 8.1. Market Analysis, Insights and Forecast - by Application
- 9. Middle East & Africa Processed Canned Fish Analysis, Insights and Forecast, 2020-2032
- 9.1. Market Analysis, Insights and Forecast - by Application
- 9.1.1. Supermarkets/ Hypermarkets
- 9.1.2. Convenience Stores
- 9.1.3. Online Retailers
- 9.1.4. Others
- 9.2. Market Analysis, Insights and Forecast - by Type
- 9.2.1. Canned Fish
- 9.2.2. Canned Freshwater Fish
- 9.1. Market Analysis, Insights and Forecast - by Application
- 10. Asia Pacific Processed Canned Fish Analysis, Insights and Forecast, 2020-2032
- 10.1. Market Analysis, Insights and Forecast - by Application
- 10.1.1. Supermarkets/ Hypermarkets
- 10.1.2. Convenience Stores
- 10.1.3. Online Retailers
- 10.1.4. Others
- 10.2. Market Analysis, Insights and Forecast - by Type
- 10.2.1. Canned Fish
- 10.2.2. Canned Freshwater Fish
- 10.1. Market Analysis, Insights and Forecast - by Application
- 11. Competitive Analysis
- 11.1. Global Market Share Analysis 2025
- 11.2. Company Profiles
- 11.2.1 Ayam Sarl
- 11.2.1.1. Overview
- 11.2.1.2. Products
- 11.2.1.3. SWOT Analysis
- 11.2.1.4. Recent Developments
- 11.2.1.5. Financials (Based on Availability)
- 11.2.2 Kumpulan Cap Keluarga
- 11.2.2.1. Overview
- 11.2.2.2. Products
- 11.2.2.3. SWOT Analysis
- 11.2.2.4. Recent Developments
- 11.2.2.5. Financials (Based on Availability)
- 11.2.3 Marina (FFM BERHAD)
- 11.2.3.1. Overview
- 11.2.3.2. Products
- 11.2.3.3. SWOT Analysis
- 11.2.3.4. Recent Developments
- 11.2.3.5. Financials (Based on Availability)
- 11.2.4 Adabi Consumer Industries
- 11.2.4.1. Overview
- 11.2.4.2. Products
- 11.2.4.3. SWOT Analysis
- 11.2.4.4. Recent Developments
- 11.2.4.5. Financials (Based on Availability)
- 11.2.5 Pertima Trengganu Sdn Bhd
- 11.2.5.1. Overview
- 11.2.5.2. Products
- 11.2.5.3. SWOT Analysis
- 11.2.5.4. Recent Developments
- 11.2.5.5. Financials (Based on Availability)
- 11.2.6 KING CUP (MCM)
- 11.2.6.1. Overview
- 11.2.6.2. Products
- 11.2.6.3. SWOT Analysis
- 11.2.6.4. Recent Developments
- 11.2.6.5. Financials (Based on Availability)
- 11.2.7 PROTIGAM
- 11.2.7.1. Overview
- 11.2.7.2. Products
- 11.2.7.3. SWOT Analysis
- 11.2.7.4. Recent Developments
- 11.2.7.5. Financials (Based on Availability)
- 11.2.1 Ayam Sarl
List of Figures
- Figure 1: Global Processed Canned Fish Revenue Breakdown (undefined, %) by Region 2025 & 2033
- Figure 2: Global Processed Canned Fish Volume Breakdown (K, %) by Region 2025 & 2033
- Figure 3: North America Processed Canned Fish Revenue (undefined), by Application 2025 & 2033
- Figure 4: North America Processed Canned Fish Volume (K), by Application 2025 & 2033
- Figure 5: North America Processed Canned Fish Revenue Share (%), by Application 2025 & 2033
- Figure 6: North America Processed Canned Fish Volume Share (%), by Application 2025 & 2033
- Figure 7: North America Processed Canned Fish Revenue (undefined), by Type 2025 & 2033
- Figure 8: North America Processed Canned Fish Volume (K), by Type 2025 & 2033
- Figure 9: North America Processed Canned Fish Revenue Share (%), by Type 2025 & 2033
- Figure 10: North America Processed Canned Fish Volume Share (%), by Type 2025 & 2033
- Figure 11: North America Processed Canned Fish Revenue (undefined), by Country 2025 & 2033
- Figure 12: North America Processed Canned Fish Volume (K), by Country 2025 & 2033
- Figure 13: North America Processed Canned Fish Revenue Share (%), by Country 2025 & 2033
- Figure 14: North America Processed Canned Fish Volume Share (%), by Country 2025 & 2033
- Figure 15: South America Processed Canned Fish Revenue (undefined), by Application 2025 & 2033
- Figure 16: South America Processed Canned Fish Volume (K), by Application 2025 & 2033
- Figure 17: South America Processed Canned Fish Revenue Share (%), by Application 2025 & 2033
- Figure 18: South America Processed Canned Fish Volume Share (%), by Application 2025 & 2033
- Figure 19: South America Processed Canned Fish Revenue (undefined), by Type 2025 & 2033
- Figure 20: South America Processed Canned Fish Volume (K), by Type 2025 & 2033
- Figure 21: South America Processed Canned Fish Revenue Share (%), by Type 2025 & 2033
- Figure 22: South America Processed Canned Fish Volume Share (%), by Type 2025 & 2033
- Figure 23: South America Processed Canned Fish Revenue (undefined), by Country 2025 & 2033
- Figure 24: South America Processed Canned Fish Volume (K), by Country 2025 & 2033
- Figure 25: South America Processed Canned Fish Revenue Share (%), by Country 2025 & 2033
- Figure 26: South America Processed Canned Fish Volume Share (%), by Country 2025 & 2033
- Figure 27: Europe Processed Canned Fish Revenue (undefined), by Application 2025 & 2033
- Figure 28: Europe Processed Canned Fish Volume (K), by Application 2025 & 2033
- Figure 29: Europe Processed Canned Fish Revenue Share (%), by Application 2025 & 2033
- Figure 30: Europe Processed Canned Fish Volume Share (%), by Application 2025 & 2033
- Figure 31: Europe Processed Canned Fish Revenue (undefined), by Type 2025 & 2033
- Figure 32: Europe Processed Canned Fish Volume (K), by Type 2025 & 2033
- Figure 33: Europe Processed Canned Fish Revenue Share (%), by Type 2025 & 2033
- Figure 34: Europe Processed Canned Fish Volume Share (%), by Type 2025 & 2033
- Figure 35: Europe Processed Canned Fish Revenue (undefined), by Country 2025 & 2033
- Figure 36: Europe Processed Canned Fish Volume (K), by Country 2025 & 2033
- Figure 37: Europe Processed Canned Fish Revenue Share (%), by Country 2025 & 2033
- Figure 38: Europe Processed Canned Fish Volume Share (%), by Country 2025 & 2033
- Figure 39: Middle East & Africa Processed Canned Fish Revenue (undefined), by Application 2025 & 2033
- Figure 40: Middle East & Africa Processed Canned Fish Volume (K), by Application 2025 & 2033
- Figure 41: Middle East & Africa Processed Canned Fish Revenue Share (%), by Application 2025 & 2033
- Figure 42: Middle East & Africa Processed Canned Fish Volume Share (%), by Application 2025 & 2033
- Figure 43: Middle East & Africa Processed Canned Fish Revenue (undefined), by Type 2025 & 2033
- Figure 44: Middle East & Africa Processed Canned Fish Volume (K), by Type 2025 & 2033
- Figure 45: Middle East & Africa Processed Canned Fish Revenue Share (%), by Type 2025 & 2033
- Figure 46: Middle East & Africa Processed Canned Fish Volume Share (%), by Type 2025 & 2033
- Figure 47: Middle East & Africa Processed Canned Fish Revenue (undefined), by Country 2025 & 2033
- Figure 48: Middle East & Africa Processed Canned Fish Volume (K), by Country 2025 & 2033
- Figure 49: Middle East & Africa Processed Canned Fish Revenue Share (%), by Country 2025 & 2033
- Figure 50: Middle East & Africa Processed Canned Fish Volume Share (%), by Country 2025 & 2033
- Figure 51: Asia Pacific Processed Canned Fish Revenue (undefined), by Application 2025 & 2033
- Figure 52: Asia Pacific Processed Canned Fish Volume (K), by Application 2025 & 2033
- Figure 53: Asia Pacific Processed Canned Fish Revenue Share (%), by Application 2025 & 2033
- Figure 54: Asia Pacific Processed Canned Fish Volume Share (%), by Application 2025 & 2033
- Figure 55: Asia Pacific Processed Canned Fish Revenue (undefined), by Type 2025 & 2033
- Figure 56: Asia Pacific Processed Canned Fish Volume (K), by Type 2025 & 2033
- Figure 57: Asia Pacific Processed Canned Fish Revenue Share (%), by Type 2025 & 2033
- Figure 58: Asia Pacific Processed Canned Fish Volume Share (%), by Type 2025 & 2033
- Figure 59: Asia Pacific Processed Canned Fish Revenue (undefined), by Country 2025 & 2033
- Figure 60: Asia Pacific Processed Canned Fish Volume (K), by Country 2025 & 2033
- Figure 61: Asia Pacific Processed Canned Fish Revenue Share (%), by Country 2025 & 2033
- Figure 62: Asia Pacific Processed Canned Fish Volume Share (%), by Country 2025 & 2033
List of Tables
- Table 1: Global Processed Canned Fish Revenue undefined Forecast, by Application 2020 & 2033
- Table 2: Global Processed Canned Fish Volume K Forecast, by Application 2020 & 2033
- Table 3: Global Processed Canned Fish Revenue undefined Forecast, by Type 2020 & 2033
- Table 4: Global Processed Canned Fish Volume K Forecast, by Type 2020 & 2033
- Table 5: Global Processed Canned Fish Revenue undefined Forecast, by Region 2020 & 2033
- Table 6: Global Processed Canned Fish Volume K Forecast, by Region 2020 & 2033
- Table 7: Global Processed Canned Fish Revenue undefined Forecast, by Application 2020 & 2033
- Table 8: Global Processed Canned Fish Volume K Forecast, by Application 2020 & 2033
- Table 9: Global Processed Canned Fish Revenue undefined Forecast, by Type 2020 & 2033
- Table 10: Global Processed Canned Fish Volume K Forecast, by Type 2020 & 2033
- Table 11: Global Processed Canned Fish Revenue undefined Forecast, by Country 2020 & 2033
- Table 12: Global Processed Canned Fish Volume K Forecast, by Country 2020 & 2033
- Table 13: United States Processed Canned Fish Revenue (undefined) Forecast, by Application 2020 & 2033
- Table 14: United States Processed Canned Fish Volume (K) Forecast, by Application 2020 & 2033
- Table 15: Canada Processed Canned Fish Revenue (undefined) Forecast, by Application 2020 & 2033
- Table 16: Canada Processed Canned Fish Volume (K) Forecast, by Application 2020 & 2033
- Table 17: Mexico Processed Canned Fish Revenue (undefined) Forecast, by Application 2020 & 2033
- Table 18: Mexico Processed Canned Fish Volume (K) Forecast, by Application 2020 & 2033
- Table 19: Global Processed Canned Fish Revenue undefined Forecast, by Application 2020 & 2033
- Table 20: Global Processed Canned Fish Volume K Forecast, by Application 2020 & 2033
- Table 21: Global Processed Canned Fish Revenue undefined Forecast, by Type 2020 & 2033
- Table 22: Global Processed Canned Fish Volume K Forecast, by Type 2020 & 2033
- Table 23: Global Processed Canned Fish Revenue undefined Forecast, by Country 2020 & 2033
- Table 24: Global Processed Canned Fish Volume K Forecast, by Country 2020 & 2033
- Table 25: Brazil Processed Canned Fish Revenue (undefined) Forecast, by Application 2020 & 2033
- Table 26: Brazil Processed Canned Fish Volume (K) Forecast, by Application 2020 & 2033
- Table 27: Argentina Processed Canned Fish Revenue (undefined) Forecast, by Application 2020 & 2033
- Table 28: Argentina Processed Canned Fish Volume (K) Forecast, by Application 2020 & 2033
- Table 29: Rest of South America Processed Canned Fish Revenue (undefined) Forecast, by Application 2020 & 2033
- Table 30: Rest of South America Processed Canned Fish Volume (K) Forecast, by Application 2020 & 2033
- Table 31: Global Processed Canned Fish Revenue undefined Forecast, by Application 2020 & 2033
- Table 32: Global Processed Canned Fish Volume K Forecast, by Application 2020 & 2033
- Table 33: Global Processed Canned Fish Revenue undefined Forecast, by Type 2020 & 2033
- Table 34: Global Processed Canned Fish Volume K Forecast, by Type 2020 & 2033
- Table 35: Global Processed Canned Fish Revenue undefined Forecast, by Country 2020 & 2033
- Table 36: Global Processed Canned Fish Volume K Forecast, by Country 2020 & 2033
- Table 37: United Kingdom Processed Canned Fish Revenue (undefined) Forecast, by Application 2020 & 2033
- Table 38: United Kingdom Processed Canned Fish Volume (K) Forecast, by Application 2020 & 2033
- Table 39: Germany Processed Canned Fish Revenue (undefined) Forecast, by Application 2020 & 2033
- Table 40: Germany Processed Canned Fish Volume (K) Forecast, by Application 2020 & 2033
- Table 41: France Processed Canned Fish Revenue (undefined) Forecast, by Application 2020 & 2033
- Table 42: France Processed Canned Fish Volume (K) Forecast, by Application 2020 & 2033
- Table 43: Italy Processed Canned Fish Revenue (undefined) Forecast, by Application 2020 & 2033
- Table 44: Italy Processed Canned Fish Volume (K) Forecast, by Application 2020 & 2033
- Table 45: Spain Processed Canned Fish Revenue (undefined) Forecast, by Application 2020 & 2033
- Table 46: Spain Processed Canned Fish Volume (K) Forecast, by Application 2020 & 2033
- Table 47: Russia Processed Canned Fish Revenue (undefined) Forecast, by Application 2020 & 2033
- Table 48: Russia Processed Canned Fish Volume (K) Forecast, by Application 2020 & 2033
- Table 49: Benelux Processed Canned Fish Revenue (undefined) Forecast, by Application 2020 & 2033
- Table 50: Benelux Processed Canned Fish Volume (K) Forecast, by Application 2020 & 2033
- Table 51: Nordics Processed Canned Fish Revenue (undefined) Forecast, by Application 2020 & 2033
- Table 52: Nordics Processed Canned Fish Volume (K) Forecast, by Application 2020 & 2033
- Table 53: Rest of Europe Processed Canned Fish Revenue (undefined) Forecast, by Application 2020 & 2033
- Table 54: Rest of Europe Processed Canned Fish Volume (K) Forecast, by Application 2020 & 2033
- Table 55: Global Processed Canned Fish Revenue undefined Forecast, by Application 2020 & 2033
- Table 56: Global Processed Canned Fish Volume K Forecast, by Application 2020 & 2033
- Table 57: Global Processed Canned Fish Revenue undefined Forecast, by Type 2020 & 2033
- Table 58: Global Processed Canned Fish Volume K Forecast, by Type 2020 & 2033
- Table 59: Global Processed Canned Fish Revenue undefined Forecast, by Country 2020 & 2033
- Table 60: Global Processed Canned Fish Volume K Forecast, by Country 2020 & 2033
- Table 61: Turkey Processed Canned Fish Revenue (undefined) Forecast, by Application 2020 & 2033
- Table 62: Turkey Processed Canned Fish Volume (K) Forecast, by Application 2020 & 2033
- Table 63: Israel Processed Canned Fish Revenue (undefined) Forecast, by Application 2020 & 2033
- Table 64: Israel Processed Canned Fish Volume (K) Forecast, by Application 2020 & 2033
- Table 65: GCC Processed Canned Fish Revenue (undefined) Forecast, by Application 2020 & 2033
- Table 66: GCC Processed Canned Fish Volume (K) Forecast, by Application 2020 & 2033
- Table 67: North Africa Processed Canned Fish Revenue (undefined) Forecast, by Application 2020 & 2033
- Table 68: North Africa Processed Canned Fish Volume (K) Forecast, by Application 2020 & 2033
- Table 69: South Africa Processed Canned Fish Revenue (undefined) Forecast, by Application 2020 & 2033
- Table 70: South Africa Processed Canned Fish Volume (K) Forecast, by Application 2020 & 2033
- Table 71: Rest of Middle East & Africa Processed Canned Fish Revenue (undefined) Forecast, by Application 2020 & 2033
- Table 72: Rest of Middle East & Africa Processed Canned Fish Volume (K) Forecast, by Application 2020 & 2033
- Table 73: Global Processed Canned Fish Revenue undefined Forecast, by Application 2020 & 2033
- Table 74: Global Processed Canned Fish Volume K Forecast, by Application 2020 & 2033
- Table 75: Global Processed Canned Fish Revenue undefined Forecast, by Type 2020 & 2033
- Table 76: Global Processed Canned Fish Volume K Forecast, by Type 2020 & 2033
- Table 77: Global Processed Canned Fish Revenue undefined Forecast, by Country 2020 & 2033
- Table 78: Global Processed Canned Fish Volume K Forecast, by Country 2020 & 2033
- Table 79: China Processed Canned Fish Revenue (undefined) Forecast, by Application 2020 & 2033
- Table 80: China Processed Canned Fish Volume (K) Forecast, by Application 2020 & 2033
- Table 81: India Processed Canned Fish Revenue (undefined) Forecast, by Application 2020 & 2033
- Table 82: India Processed Canned Fish Volume (K) Forecast, by Application 2020 & 2033
- Table 83: Japan Processed Canned Fish Revenue (undefined) Forecast, by Application 2020 & 2033
- Table 84: Japan Processed Canned Fish Volume (K) Forecast, by Application 2020 & 2033
- Table 85: South Korea Processed Canned Fish Revenue (undefined) Forecast, by Application 2020 & 2033
- Table 86: South Korea Processed Canned Fish Volume (K) Forecast, by Application 2020 & 2033
- Table 87: ASEAN Processed Canned Fish Revenue (undefined) Forecast, by Application 2020 & 2033
- Table 88: ASEAN Processed Canned Fish Volume (K) Forecast, by Application 2020 & 2033
- Table 89: Oceania Processed Canned Fish Revenue (undefined) Forecast, by Application 2020 & 2033
- Table 90: Oceania Processed Canned Fish Volume (K) Forecast, by Application 2020 & 2033
- Table 91: Rest of Asia Pacific Processed Canned Fish Revenue (undefined) Forecast, by Application 2020 & 2033
- Table 92: Rest of Asia Pacific Processed Canned Fish Volume (K) Forecast, by Application 2020 & 2033
Frequently Asked Questions
1. What is the projected Compound Annual Growth Rate (CAGR) of the Processed Canned Fish?
The projected CAGR is approximately 3.4%.
2. Which companies are prominent players in the Processed Canned Fish?
Key companies in the market include Ayam Sarl, Kumpulan Cap Keluarga, Marina (FFM BERHAD), Adabi Consumer Industries, Pertima Trengganu Sdn Bhd, KING CUP (MCM), PROTIGAM.
3. What are the main segments of the Processed Canned Fish?
The market segments include Application, Type.
4. Can you provide details about the market size?
The market size is estimated to be USD XXX N/A as of 2022.
5. What are some drivers contributing to market growth?
N/A
6. What are the notable trends driving market growth?
N/A
7. Are there any restraints impacting market growth?
N/A
8. Can you provide examples of recent developments in the market?
N/A
9. What pricing options are available for accessing the report?
Pricing options include single-user, multi-user, and enterprise licenses priced at USD 3950.00, USD 5925.00, and USD 7900.00 respectively.
10. Is the market size provided in terms of value or volume?
The market size is provided in terms of value, measured in N/A and volume, measured in K.
11. Are there any specific market keywords associated with the report?
Yes, the market keyword associated with the report is "Processed Canned Fish," which aids in identifying and referencing the specific market segment covered.
12. How do I determine which pricing option suits my needs best?
The pricing options vary based on user requirements and access needs. Individual users may opt for single-user licenses, while businesses requiring broader access may choose multi-user or enterprise licenses for cost-effective access to the report.
13. Are there any additional resources or data provided in the Processed Canned Fish report?
While the report offers comprehensive insights, it's advisable to review the specific contents or supplementary materials provided to ascertain if additional resources or data are available.
14. How can I stay updated on further developments or reports in the Processed Canned Fish?
To stay informed about further developments, trends, and reports in the Processed Canned Fish, consider subscribing to industry newsletters, following relevant companies and organizations, or regularly checking reputable industry news sources and publications.
Methodology
Step 1 - Identification of Relevant Samples Size from Population Database


Step 2 - Approaches for Defining Global Market Size (Value, Volume* & Price*)

Note*: In applicable scenarios
Step 3 - Data Sources
Primary Research
- Web Analytics
- Survey Reports
- Research Institute
- Latest Research Reports
- Opinion Leaders
Secondary Research
- Annual Reports
- White Paper
- Latest Press Release
- Industry Association
- Paid Database
- Investor Presentations

Step 4 - Data Triangulation
Involves using different sources of information in order to increase the validity of a study
These sources are likely to be stakeholders in a program - participants, other researchers, program staff, other community members, and so on.
Then we put all data in single framework & apply various statistical tools to find out the dynamic on the market.
During the analysis stage, feedback from the stakeholder groups would be compared to determine areas of agreement as well as areas of divergence