

Key Insights
The global market for radar-based blind spot monitoring (BSM) systems is poised for significant expansion, driven by escalating vehicle production, evolving safety mandates, and heightened consumer interest in advanced driver-assistance systems (ADAS). The market, valued at an estimated $18.35 billion in 2025, is projected to grow at a Compound Annual Growth Rate (CAGR) of 13.3% between 2025 and 2033. This robust growth is underpinned by several key catalysts: mandatory BSM integration in key automotive markets, technological advancements in radar systems enhancing accuracy and affordability, and increasing consumer demand for enhanced road safety features. Major industry participants, including Continental and Bosch, are actively pursuing R&D and strategic alliances to fortify their market positions.
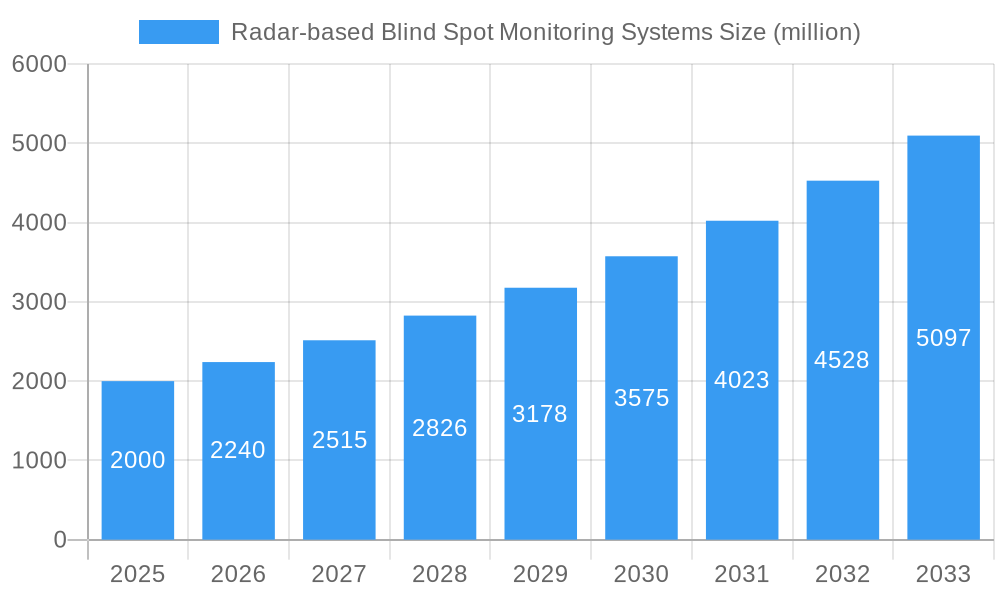
Radar-based Blind Spot Monitoring Systems Market Size (In Billion)
Despite the positive trajectory, market penetration is moderated by factors such as the initial integration costs for entry-level vehicles and the technical complexities associated with integrating BSM with other ADAS functionalities. Nevertheless, the long-term outlook for the radar-based BSM market remains exceptionally strong. Continuous improvements in vehicle safety standards, the maturation of cost-effective radar technology, and a growing consumer preference for advanced vehicle features are expected to fuel sustained market growth. The diverse market segmentation across vehicle types and geographies presents substantial opportunities for both established players and emerging innovators.
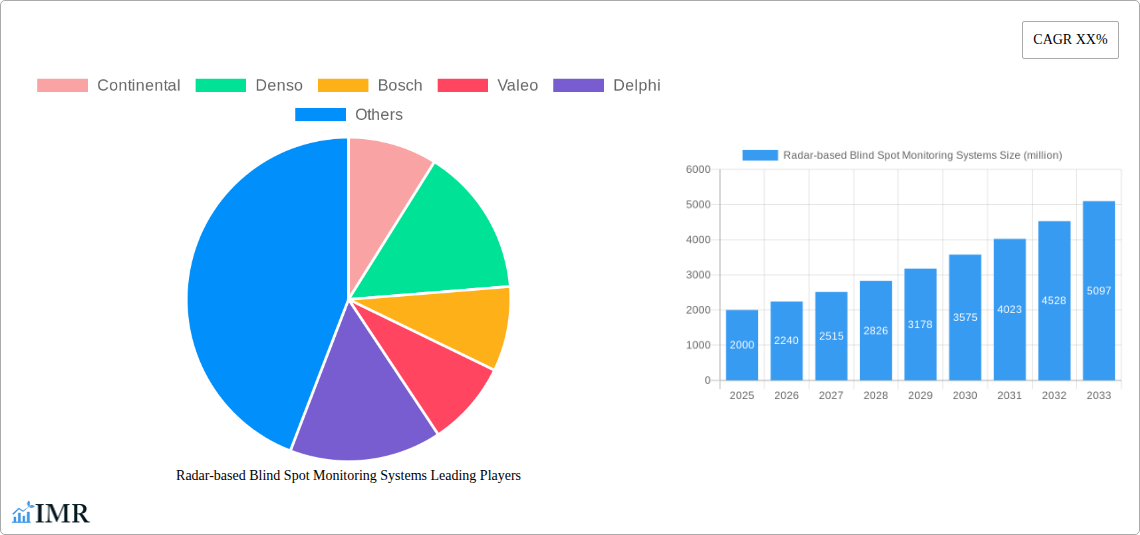
Radar-based Blind Spot Monitoring Systems Company Market Share
Radar-based Blind Spot Monitoring Systems Market Report: 2019-2033
This comprehensive report provides an in-depth analysis of the global Radar-based Blind Spot Monitoring Systems market, encompassing the parent market of Advanced Driver-Assistance Systems (ADAS) and the child market of automotive safety systems. The study period spans from 2019 to 2033, with 2025 serving as the base and estimated year. The report offers crucial insights for industry professionals, investors, and strategists seeking to navigate this rapidly evolving landscape. Key players analyzed include Continental, Denso, Bosch, Valeo, Delphi, ZF TRW, WABCO, Hella, Autoliv, Brandmotion, Accele Electronics, Rydeen Mobile Electronics, and Audiovox. The market is projected to reach xx million units by 2033.
Radar-based Blind Spot Monitoring Systems Market Dynamics & Structure
The global Radar-based Blind Spot Monitoring Systems market is characterized by moderate concentration, with a few dominant players holding significant market share. Technological innovation, driven by advancements in radar technology and processing power, is a key driver, while stringent safety regulations worldwide are compelling adoption. Competitive substitutes include camera-based systems, but radar offers superior performance in adverse weather conditions. The market's end-users primarily comprise automotive Original Equipment Manufacturers (OEMs) and aftermarket suppliers. M&A activity has been relatively moderate in recent years, with xx deals recorded between 2019 and 2024.
- Market Concentration: Moderately concentrated, with top 5 players holding approximately xx% market share in 2024.
- Technological Innovation: Advancements in 77GHz radar technology, improved signal processing, and fusion with other ADAS sensors.
- Regulatory Landscape: Stringent safety regulations in regions like Europe and North America driving adoption.
- Competitive Substitutes: Camera-based systems, but radar offers superior reliability in diverse weather conditions.
- End-User Demographics: Primarily automotive OEMs and Tier-1 automotive suppliers.
- M&A Trends: xx M&A deals between 2019 and 2024, focusing on technology integration and market expansion.
Radar-based Blind Spot Monitoring Systems Growth Trends & Insights
The Radar-based Blind Spot Monitoring Systems market witnessed significant growth during the historical period (2019-2024), driven by increasing vehicle production and rising consumer demand for enhanced safety features. The market size expanded from xx million units in 2019 to xx million units in 2024, registering a CAGR of xx%. Technological disruptions, such as the integration of artificial intelligence and machine learning, are expected to further accelerate growth. Consumer behavior shifts towards prioritizing safety and advanced technology are also contributing to market expansion. The market penetration rate is estimated at xx% in 2024, with significant potential for future growth, particularly in emerging markets. We project a CAGR of xx% during the forecast period (2025-2033), reaching xx million units by 2033.
Dominant Regions, Countries, or Segments in Radar-based Blind Spot Monitoring Systems
North America currently holds the largest market share for Radar-based Blind Spot Monitoring Systems, driven by high vehicle ownership rates, stringent safety regulations, and strong consumer preference for advanced safety features. Europe follows closely, with significant adoption fueled by robust government regulations and a well-established automotive industry. Asia-Pacific is poised for substantial growth, driven by rising vehicle sales and increasing disposable incomes in emerging economies.
- North America: High vehicle ownership, stringent safety regulations, and strong consumer demand drive market dominance.
- Europe: Stringent safety standards and a strong automotive industry contribute to high adoption rates.
- Asia-Pacific: Rapid growth potential driven by rising vehicle sales and increasing disposable incomes.
- Other Regions: Moderate growth expected, influenced by regional economic development and government policies.
Radar-based Blind Spot Monitoring Systems Product Landscape
The product landscape is characterized by a variety of systems with varying features and performance metrics, including range, accuracy, and processing speed. Key innovations include the integration of multiple sensors for improved reliability and the development of more compact and cost-effective radar modules. Unique selling propositions focus on enhanced detection accuracy, improved reliability in adverse weather conditions, and seamless integration with other ADAS systems. The trend is toward more sophisticated systems that leverage AI and machine learning for enhanced object detection and classification.
Key Drivers, Barriers & Challenges in Radar-based Blind Spot Monitoring Systems
Key Drivers:
- Increasing consumer demand for enhanced vehicle safety.
- Stringent government regulations mandating advanced safety features.
- Technological advancements in radar technology and processing capabilities.
Challenges and Restraints:
- High initial costs associated with implementation.
- Potential for false positives and negative impacts on system reliability.
- Supply chain disruptions impacting the availability of key components. The semiconductor shortage of 2021-2023 resulted in a xx% reduction in production capacity for several key players.
Emerging Opportunities in Radar-based Blind Spot Monitoring Systems
- Expansion into emerging markets with rising vehicle sales.
- Integration with autonomous driving systems for enhanced safety and functionality.
- Development of more cost-effective and compact radar modules for broader adoption.
Growth Accelerators in the Radar-based Blind Spot Monitoring Systems Industry
Technological breakthroughs in radar technology, such as the development of 4D imaging radar, are poised to significantly enhance the capabilities of blind spot monitoring systems. Strategic partnerships between automotive OEMs and Tier-1 suppliers will facilitate innovation and accelerate market penetration. Government incentives and subsidies for the adoption of advanced safety features are further accelerating market growth.
Notable Milestones in Radar-based Blind Spot Monitoring Systems Sector
- 2020: Bosch launches a new generation of 77GHz radar sensor with improved long-range detection capabilities.
- 2022: Continental announces a strategic partnership with a major automotive OEM to integrate its blind spot monitoring system into a new vehicle model.
- 2023: Valeo releases a new compact radar sensor designed for cost-effective integration into smaller vehicles.
In-Depth Radar-based Blind Spot Monitoring Systems Market Outlook
The Radar-based Blind Spot Monitoring Systems market is poised for continued growth driven by technological advancements, expanding adoption rates in emerging markets, and the increasing integration of these systems into autonomous driving platforms. Strategic opportunities exist for companies focusing on innovation, cost reduction, and expansion into untapped markets. The future outlook is highly positive, with significant potential for market expansion and increased market penetration across various vehicle segments.
Radar-based Blind Spot Monitoring Systems Segmentation
-
1. Application
- 1.1. Passenger Car
- 1.2. Commercial Vehicle
-
2. Types
- 2.1. 24 GHz Radar Systems
- 2.2. 77 GHz Radar Systems
Radar-based Blind Spot Monitoring Systems Segmentation By Geography
-
1. North America
- 1.1. United States
- 1.2. Canada
- 1.3. Mexico
-
2. South America
- 2.1. Brazil
- 2.2. Argentina
- 2.3. Rest of South America
-
3. Europe
- 3.1. United Kingdom
- 3.2. Germany
- 3.3. France
- 3.4. Italy
- 3.5. Spain
- 3.6. Russia
- 3.7. Benelux
- 3.8. Nordics
- 3.9. Rest of Europe
-
4. Middle East & Africa
- 4.1. Turkey
- 4.2. Israel
- 4.3. GCC
- 4.4. North Africa
- 4.5. South Africa
- 4.6. Rest of Middle East & Africa
-
5. Asia Pacific
- 5.1. China
- 5.2. India
- 5.3. Japan
- 5.4. South Korea
- 5.5. ASEAN
- 5.6. Oceania
- 5.7. Rest of Asia Pacific

Radar-based Blind Spot Monitoring Systems Regional Market Share
Geographic Coverage of Radar-based Blind Spot Monitoring Systems
Radar-based Blind Spot Monitoring Systems REPORT HIGHLIGHTS
| Aspects | Details |
|---|---|
| Study Period | 2020-2034 |
| Base Year | 2025 |
| Estimated Year | 2026 |
| Forecast Period | 2026-2034 |
| Historical Period | 2020-2025 |
| Growth Rate | CAGR of 13.3% from 2020-2034 |
| Segmentation |
|
Table of Contents
- 1. Introduction
- 1.1. Research Scope
- 1.2. Market Segmentation
- 1.3. Research Objective
- 1.4. Definitions and Assumptions
- 2. Executive Summary
- 2.1. Market Snapshot
- 3. Market Dynamics
- 3.1. Market Drivers
- 3.2. Market Restrains
- 3.3. Market Trends
- 3.4. Market Opportunities
- 4. Market Factor Analysis
- 4.1. Porters Five Forces
- 4.1.1. Bargaining Power of Suppliers
- 4.1.2. Bargaining Power of Buyers
- 4.1.3. Threat of New Entrants
- 4.1.4. Threat of Substitutes
- 4.1.5. Competitive Rivalry
- 4.2. PESTEL analysis
- 4.3. BCG Analysis
- 4.3.1. Stars (High Growth, High Market Share)
- 4.3.2. Cash Cows (Low Growth, High Market Share)
- 4.3.3. Question Mark (High Growth, Low Market Share)
- 4.3.4. Dogs (Low Growth, Low Market Share)
- 4.4. Ansoff Matrix Analysis
- 4.5. Supply Chain Analysis
- 4.6. Regulatory Landscape
- 4.7. Current Market Potential and Opportunity Assessment (TAM–SAM–SOM Framework)
- 4.8. IMR Analyst Note
- 4.1. Porters Five Forces
- 5. Market Analysis, Insights and Forecast 2021-2033
- 5.1. Market Analysis, Insights and Forecast - by Application
- 5.1.1. Passenger Car
- 5.1.2. Commercial Vehicle
- 5.2. Market Analysis, Insights and Forecast - by Types
- 5.2.1. 24 GHz Radar Systems
- 5.2.2. 77 GHz Radar Systems
- 5.3. Market Analysis, Insights and Forecast - by Region
- 5.3.1. North America
- 5.3.2. South America
- 5.3.3. Europe
- 5.3.4. Middle East & Africa
- 5.3.5. Asia Pacific
- 5.1. Market Analysis, Insights and Forecast - by Application
- 6. Global Radar-based Blind Spot Monitoring Systems Analysis, Insights and Forecast, 2021-2033
- 6.1. Market Analysis, Insights and Forecast - by Application
- 6.1.1. Passenger Car
- 6.1.2. Commercial Vehicle
- 6.2. Market Analysis, Insights and Forecast - by Types
- 6.2.1. 24 GHz Radar Systems
- 6.2.2. 77 GHz Radar Systems
- 6.1. Market Analysis, Insights and Forecast - by Application
- 7. North America Radar-based Blind Spot Monitoring Systems Analysis, Insights and Forecast, 2020-2032
- 7.1. Market Analysis, Insights and Forecast - by Application
- 7.1.1. Passenger Car
- 7.1.2. Commercial Vehicle
- 7.2. Market Analysis, Insights and Forecast - by Types
- 7.2.1. 24 GHz Radar Systems
- 7.2.2. 77 GHz Radar Systems
- 7.1. Market Analysis, Insights and Forecast - by Application
- 8. South America Radar-based Blind Spot Monitoring Systems Analysis, Insights and Forecast, 2020-2032
- 8.1. Market Analysis, Insights and Forecast - by Application
- 8.1.1. Passenger Car
- 8.1.2. Commercial Vehicle
- 8.2. Market Analysis, Insights and Forecast - by Types
- 8.2.1. 24 GHz Radar Systems
- 8.2.2. 77 GHz Radar Systems
- 8.1. Market Analysis, Insights and Forecast - by Application
- 9. Europe Radar-based Blind Spot Monitoring Systems Analysis, Insights and Forecast, 2020-2032
- 9.1. Market Analysis, Insights and Forecast - by Application
- 9.1.1. Passenger Car
- 9.1.2. Commercial Vehicle
- 9.2. Market Analysis, Insights and Forecast - by Types
- 9.2.1. 24 GHz Radar Systems
- 9.2.2. 77 GHz Radar Systems
- 9.1. Market Analysis, Insights and Forecast - by Application
- 10. Middle East & Africa Radar-based Blind Spot Monitoring Systems Analysis, Insights and Forecast, 2020-2032
- 10.1. Market Analysis, Insights and Forecast - by Application
- 10.1.1. Passenger Car
- 10.1.2. Commercial Vehicle
- 10.2. Market Analysis, Insights and Forecast - by Types
- 10.2.1. 24 GHz Radar Systems
- 10.2.2. 77 GHz Radar Systems
- 10.1. Market Analysis, Insights and Forecast - by Application
- 11. Asia Pacific Radar-based Blind Spot Monitoring Systems Analysis, Insights and Forecast, 2020-2032
- 11.1. Market Analysis, Insights and Forecast - by Application
- 11.1.1. Passenger Car
- 11.1.2. Commercial Vehicle
- 11.2. Market Analysis, Insights and Forecast - by Types
- 11.2.1. 24 GHz Radar Systems
- 11.2.2. 77 GHz Radar Systems
- 11.1. Market Analysis, Insights and Forecast - by Application
- 12. Competitive Analysis
- 12.1. Company Profiles
- 12.1.1 Continental
- 12.1.1.1. Company Overview
- 12.1.1.2. Products
- 12.1.1.3. Company Financials
- 12.1.1.4. SWOT Analysis
- 12.1.2 Denso
- 12.1.2.1. Company Overview
- 12.1.2.2. Products
- 12.1.2.3. Company Financials
- 12.1.2.4. SWOT Analysis
- 12.1.3 Bosch
- 12.1.3.1. Company Overview
- 12.1.3.2. Products
- 12.1.3.3. Company Financials
- 12.1.3.4. SWOT Analysis
- 12.1.4 Valeo
- 12.1.4.1. Company Overview
- 12.1.4.2. Products
- 12.1.4.3. Company Financials
- 12.1.4.4. SWOT Analysis
- 12.1.5 Delphi
- 12.1.5.1. Company Overview
- 12.1.5.2. Products
- 12.1.5.3. Company Financials
- 12.1.5.4. SWOT Analysis
- 12.1.6 ZF TRW
- 12.1.6.1. Company Overview
- 12.1.6.2. Products
- 12.1.6.3. Company Financials
- 12.1.6.4. SWOT Analysis
- 12.1.7 WABCO
- 12.1.7.1. Company Overview
- 12.1.7.2. Products
- 12.1.7.3. Company Financials
- 12.1.7.4. SWOT Analysis
- 12.1.8 Hella
- 12.1.8.1. Company Overview
- 12.1.8.2. Products
- 12.1.8.3. Company Financials
- 12.1.8.4. SWOT Analysis
- 12.1.9 Autoliv
- 12.1.9.1. Company Overview
- 12.1.9.2. Products
- 12.1.9.3. Company Financials
- 12.1.9.4. SWOT Analysis
- 12.1.10 Brandmotion
- 12.1.10.1. Company Overview
- 12.1.10.2. Products
- 12.1.10.3. Company Financials
- 12.1.10.4. SWOT Analysis
- 12.1.11 Accele Electronics
- 12.1.11.1. Company Overview
- 12.1.11.2. Products
- 12.1.11.3. Company Financials
- 12.1.11.4. SWOT Analysis
- 12.1.12 Rydeen Mobile Electronics
- 12.1.12.1. Company Overview
- 12.1.12.2. Products
- 12.1.12.3. Company Financials
- 12.1.12.4. SWOT Analysis
- 12.1.13 Audiovox
- 12.1.13.1. Company Overview
- 12.1.13.2. Products
- 12.1.13.3. Company Financials
- 12.1.13.4. SWOT Analysis
- 12.1.1 Continental
- 12.2. Market Entropy
- 12.2.1 Company's Key Areas Served
- 12.2.2 Recent Developments
- 12.3. Company Market Share Analysis 2025
- 12.3.1 Top 5 Companies Market Share Analysis
- 12.3.2 Top 3 Companies Market Share Analysis
- 12.4. List of Potential Customers
- 13. Research Methodology
List of Figures
- Figure 1: Global Radar-based Blind Spot Monitoring Systems Revenue Breakdown (billion, %) by Region 2025 & 2033
- Figure 2: North America Radar-based Blind Spot Monitoring Systems Revenue (billion), by Application 2025 & 2033
- Figure 3: North America Radar-based Blind Spot Monitoring Systems Revenue Share (%), by Application 2025 & 2033
- Figure 4: North America Radar-based Blind Spot Monitoring Systems Revenue (billion), by Types 2025 & 2033
- Figure 5: North America Radar-based Blind Spot Monitoring Systems Revenue Share (%), by Types 2025 & 2033
- Figure 6: North America Radar-based Blind Spot Monitoring Systems Revenue (billion), by Country 2025 & 2033
- Figure 7: North America Radar-based Blind Spot Monitoring Systems Revenue Share (%), by Country 2025 & 2033
- Figure 8: South America Radar-based Blind Spot Monitoring Systems Revenue (billion), by Application 2025 & 2033
- Figure 9: South America Radar-based Blind Spot Monitoring Systems Revenue Share (%), by Application 2025 & 2033
- Figure 10: South America Radar-based Blind Spot Monitoring Systems Revenue (billion), by Types 2025 & 2033
- Figure 11: South America Radar-based Blind Spot Monitoring Systems Revenue Share (%), by Types 2025 & 2033
- Figure 12: South America Radar-based Blind Spot Monitoring Systems Revenue (billion), by Country 2025 & 2033
- Figure 13: South America Radar-based Blind Spot Monitoring Systems Revenue Share (%), by Country 2025 & 2033
- Figure 14: Europe Radar-based Blind Spot Monitoring Systems Revenue (billion), by Application 2025 & 2033
- Figure 15: Europe Radar-based Blind Spot Monitoring Systems Revenue Share (%), by Application 2025 & 2033
- Figure 16: Europe Radar-based Blind Spot Monitoring Systems Revenue (billion), by Types 2025 & 2033
- Figure 17: Europe Radar-based Blind Spot Monitoring Systems Revenue Share (%), by Types 2025 & 2033
- Figure 18: Europe Radar-based Blind Spot Monitoring Systems Revenue (billion), by Country 2025 & 2033
- Figure 19: Europe Radar-based Blind Spot Monitoring Systems Revenue Share (%), by Country 2025 & 2033
- Figure 20: Middle East & Africa Radar-based Blind Spot Monitoring Systems Revenue (billion), by Application 2025 & 2033
- Figure 21: Middle East & Africa Radar-based Blind Spot Monitoring Systems Revenue Share (%), by Application 2025 & 2033
- Figure 22: Middle East & Africa Radar-based Blind Spot Monitoring Systems Revenue (billion), by Types 2025 & 2033
- Figure 23: Middle East & Africa Radar-based Blind Spot Monitoring Systems Revenue Share (%), by Types 2025 & 2033
- Figure 24: Middle East & Africa Radar-based Blind Spot Monitoring Systems Revenue (billion), by Country 2025 & 2033
- Figure 25: Middle East & Africa Radar-based Blind Spot Monitoring Systems Revenue Share (%), by Country 2025 & 2033
- Figure 26: Asia Pacific Radar-based Blind Spot Monitoring Systems Revenue (billion), by Application 2025 & 2033
- Figure 27: Asia Pacific Radar-based Blind Spot Monitoring Systems Revenue Share (%), by Application 2025 & 2033
- Figure 28: Asia Pacific Radar-based Blind Spot Monitoring Systems Revenue (billion), by Types 2025 & 2033
- Figure 29: Asia Pacific Radar-based Blind Spot Monitoring Systems Revenue Share (%), by Types 2025 & 2033
- Figure 30: Asia Pacific Radar-based Blind Spot Monitoring Systems Revenue (billion), by Country 2025 & 2033
- Figure 31: Asia Pacific Radar-based Blind Spot Monitoring Systems Revenue Share (%), by Country 2025 & 2033
List of Tables
- Table 1: Global Radar-based Blind Spot Monitoring Systems Revenue billion Forecast, by Application 2020 & 2033
- Table 2: Global Radar-based Blind Spot Monitoring Systems Revenue billion Forecast, by Types 2020 & 2033
- Table 3: Global Radar-based Blind Spot Monitoring Systems Revenue billion Forecast, by Region 2020 & 2033
- Table 4: Global Radar-based Blind Spot Monitoring Systems Revenue billion Forecast, by Application 2020 & 2033
- Table 5: Global Radar-based Blind Spot Monitoring Systems Revenue billion Forecast, by Types 2020 & 2033
- Table 6: Global Radar-based Blind Spot Monitoring Systems Revenue billion Forecast, by Country 2020 & 2033
- Table 7: United States Radar-based Blind Spot Monitoring Systems Revenue (billion) Forecast, by Application 2020 & 2033
- Table 8: Canada Radar-based Blind Spot Monitoring Systems Revenue (billion) Forecast, by Application 2020 & 2033
- Table 9: Mexico Radar-based Blind Spot Monitoring Systems Revenue (billion) Forecast, by Application 2020 & 2033
- Table 10: Global Radar-based Blind Spot Monitoring Systems Revenue billion Forecast, by Application 2020 & 2033
- Table 11: Global Radar-based Blind Spot Monitoring Systems Revenue billion Forecast, by Types 2020 & 2033
- Table 12: Global Radar-based Blind Spot Monitoring Systems Revenue billion Forecast, by Country 2020 & 2033
- Table 13: Brazil Radar-based Blind Spot Monitoring Systems Revenue (billion) Forecast, by Application 2020 & 2033
- Table 14: Argentina Radar-based Blind Spot Monitoring Systems Revenue (billion) Forecast, by Application 2020 & 2033
- Table 15: Rest of South America Radar-based Blind Spot Monitoring Systems Revenue (billion) Forecast, by Application 2020 & 2033
- Table 16: Global Radar-based Blind Spot Monitoring Systems Revenue billion Forecast, by Application 2020 & 2033
- Table 17: Global Radar-based Blind Spot Monitoring Systems Revenue billion Forecast, by Types 2020 & 2033
- Table 18: Global Radar-based Blind Spot Monitoring Systems Revenue billion Forecast, by Country 2020 & 2033
- Table 19: United Kingdom Radar-based Blind Spot Monitoring Systems Revenue (billion) Forecast, by Application 2020 & 2033
- Table 20: Germany Radar-based Blind Spot Monitoring Systems Revenue (billion) Forecast, by Application 2020 & 2033
- Table 21: France Radar-based Blind Spot Monitoring Systems Revenue (billion) Forecast, by Application 2020 & 2033
- Table 22: Italy Radar-based Blind Spot Monitoring Systems Revenue (billion) Forecast, by Application 2020 & 2033
- Table 23: Spain Radar-based Blind Spot Monitoring Systems Revenue (billion) Forecast, by Application 2020 & 2033
- Table 24: Russia Radar-based Blind Spot Monitoring Systems Revenue (billion) Forecast, by Application 2020 & 2033
- Table 25: Benelux Radar-based Blind Spot Monitoring Systems Revenue (billion) Forecast, by Application 2020 & 2033
- Table 26: Nordics Radar-based Blind Spot Monitoring Systems Revenue (billion) Forecast, by Application 2020 & 2033
- Table 27: Rest of Europe Radar-based Blind Spot Monitoring Systems Revenue (billion) Forecast, by Application 2020 & 2033
- Table 28: Global Radar-based Blind Spot Monitoring Systems Revenue billion Forecast, by Application 2020 & 2033
- Table 29: Global Radar-based Blind Spot Monitoring Systems Revenue billion Forecast, by Types 2020 & 2033
- Table 30: Global Radar-based Blind Spot Monitoring Systems Revenue billion Forecast, by Country 2020 & 2033
- Table 31: Turkey Radar-based Blind Spot Monitoring Systems Revenue (billion) Forecast, by Application 2020 & 2033
- Table 32: Israel Radar-based Blind Spot Monitoring Systems Revenue (billion) Forecast, by Application 2020 & 2033
- Table 33: GCC Radar-based Blind Spot Monitoring Systems Revenue (billion) Forecast, by Application 2020 & 2033
- Table 34: North Africa Radar-based Blind Spot Monitoring Systems Revenue (billion) Forecast, by Application 2020 & 2033
- Table 35: South Africa Radar-based Blind Spot Monitoring Systems Revenue (billion) Forecast, by Application 2020 & 2033
- Table 36: Rest of Middle East & Africa Radar-based Blind Spot Monitoring Systems Revenue (billion) Forecast, by Application 2020 & 2033
- Table 37: Global Radar-based Blind Spot Monitoring Systems Revenue billion Forecast, by Application 2020 & 2033
- Table 38: Global Radar-based Blind Spot Monitoring Systems Revenue billion Forecast, by Types 2020 & 2033
- Table 39: Global Radar-based Blind Spot Monitoring Systems Revenue billion Forecast, by Country 2020 & 2033
- Table 40: China Radar-based Blind Spot Monitoring Systems Revenue (billion) Forecast, by Application 2020 & 2033
- Table 41: India Radar-based Blind Spot Monitoring Systems Revenue (billion) Forecast, by Application 2020 & 2033
- Table 42: Japan Radar-based Blind Spot Monitoring Systems Revenue (billion) Forecast, by Application 2020 & 2033
- Table 43: South Korea Radar-based Blind Spot Monitoring Systems Revenue (billion) Forecast, by Application 2020 & 2033
- Table 44: ASEAN Radar-based Blind Spot Monitoring Systems Revenue (billion) Forecast, by Application 2020 & 2033
- Table 45: Oceania Radar-based Blind Spot Monitoring Systems Revenue (billion) Forecast, by Application 2020 & 2033
- Table 46: Rest of Asia Pacific Radar-based Blind Spot Monitoring Systems Revenue (billion) Forecast, by Application 2020 & 2033
Frequently Asked Questions
1. What is the projected Compound Annual Growth Rate (CAGR) of the Radar-based Blind Spot Monitoring Systems?
The projected CAGR is approximately 13.3%.
2. Which companies are prominent players in the Radar-based Blind Spot Monitoring Systems?
Key companies in the market include Continental, Denso, Bosch, Valeo, Delphi, ZF TRW, WABCO, Hella, Autoliv, Brandmotion, Accele Electronics, Rydeen Mobile Electronics, Audiovox.
3. What are the main segments of the Radar-based Blind Spot Monitoring Systems?
The market segments include Application, Types.
4. Can you provide details about the market size?
The market size is estimated to be USD 18.35 billion as of 2022.
5. What are some drivers contributing to market growth?
N/A
6. What are the notable trends driving market growth?
N/A
7. Are there any restraints impacting market growth?
N/A
8. Can you provide examples of recent developments in the market?
N/A
9. What pricing options are available for accessing the report?
Pricing options include single-user, multi-user, and enterprise licenses priced at USD 2900.00, USD 4350.00, and USD 5800.00 respectively.
10. Is the market size provided in terms of value or volume?
The market size is provided in terms of value, measured in billion.
11. Are there any specific market keywords associated with the report?
Yes, the market keyword associated with the report is "Radar-based Blind Spot Monitoring Systems," which aids in identifying and referencing the specific market segment covered.
12. How do I determine which pricing option suits my needs best?
The pricing options vary based on user requirements and access needs. Individual users may opt for single-user licenses, while businesses requiring broader access may choose multi-user or enterprise licenses for cost-effective access to the report.
13. Are there any additional resources or data provided in the Radar-based Blind Spot Monitoring Systems report?
While the report offers comprehensive insights, it's advisable to review the specific contents or supplementary materials provided to ascertain if additional resources or data are available.
14. How can I stay updated on further developments or reports in the Radar-based Blind Spot Monitoring Systems?
To stay informed about further developments, trends, and reports in the Radar-based Blind Spot Monitoring Systems, consider subscribing to industry newsletters, following relevant companies and organizations, or regularly checking reputable industry news sources and publications.
Methodology
Step 1 - Identification of Relevant Samples Size from Population Database


Step 2 - Approaches for Defining Global Market Size (Value, Volume* & Price*)

Note*: In applicable scenarios
Step 3 - Data Sources
Primary Research
- Web Analytics
- Survey Reports
- Research Institute
- Latest Research Reports
- Opinion Leaders
Secondary Research
- Annual Reports
- White Paper
- Latest Press Release
- Industry Association
- Paid Database
- Investor Presentations

Step 4 - Data Triangulation
Involves using different sources of information in order to increase the validity of a study
These sources are likely to be stakeholders in a program - participants, other researchers, program staff, other community members, and so on.
Then we put all data in single framework & apply various statistical tools to find out the dynamic on the market.
During the analysis stage, feedback from the stakeholder groups would be compared to determine areas of agreement as well as areas of divergence