

Key Insights
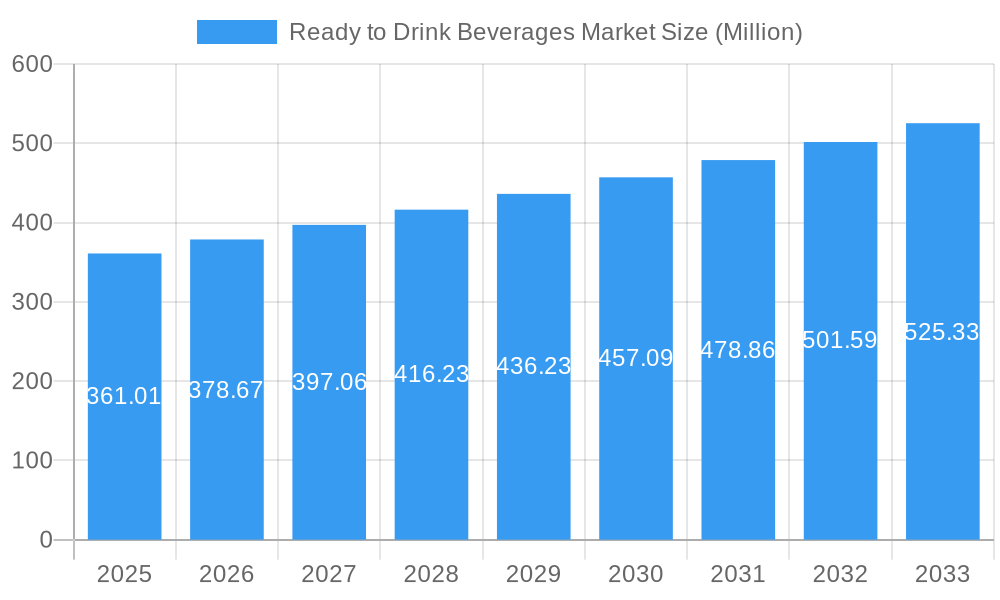
The Ready-to-Drink (RTD) beverage market, valued at $361.01 million in 2025, is projected to experience robust growth, driven by several key factors. The increasing demand for convenient and on-the-go consumption options fuels the market's expansion. Health-conscious consumers are driving the popularity of functional beverages like flavored and fortified water, yogurt drinks, and energy drinks with added vitamins or electrolytes. The growing adoption of online grocery shopping also contributes significantly to market expansion, offering consumers a wider selection and easier access to RTD beverages. Furthermore, innovative product launches, such as unique flavor profiles and sustainable packaging, are attracting consumers and boosting market growth. Competition among established players like Nestle, PepsiCo, and Coca-Cola, alongside emerging brands, intensifies innovation and expands product offerings.
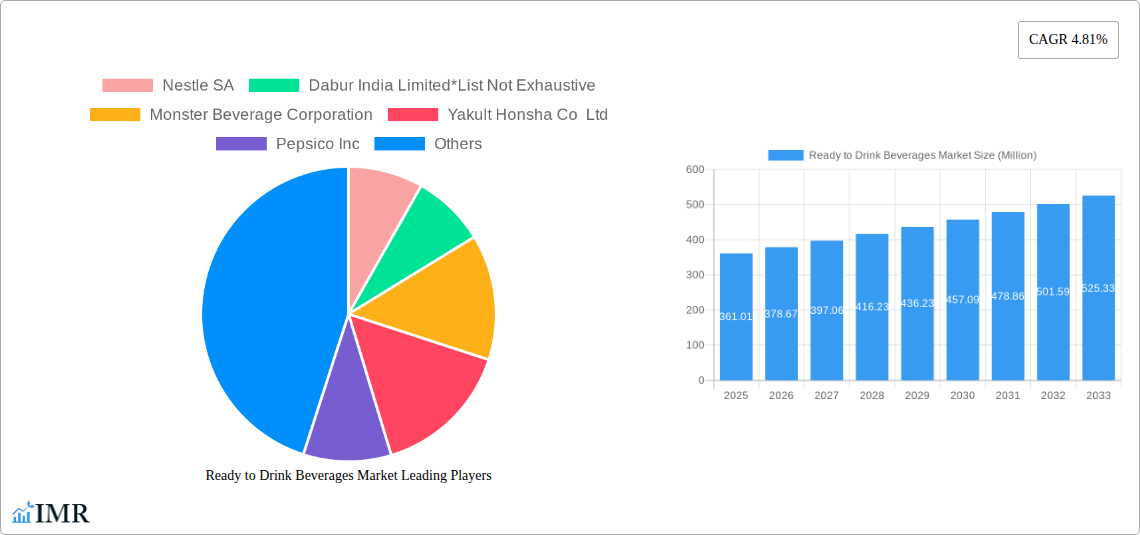
Ready to Drink Beverages Market Market Size (In Million)
Segment-wise, the tea and coffee segments within RTD beverages are expected to maintain strong performance due to the established consumer base and continuous product diversification. The dairy and dairy alternative beverage segment, including yogurt drinks, is anticipated to demonstrate significant growth driven by health and wellness trends. Distribution channels, such as supermarkets/hypermarkets and online stores, are expected to dominate the market, reflecting consumer preferences for ease of access and varied shopping options. Geographic variations exist; North America and Europe are likely to retain substantial market shares due to established consumer preferences and strong brand presence, while the Asia Pacific region presents significant growth potential driven by rising disposable incomes and changing lifestyles. The projected CAGR of 4.81% suggests a steady and sustained expansion of the RTD beverage market through 2033, with the market size expected to significantly increase in the coming years.
Ready to Drink Beverages Market Company Market Share
Ready-to-Drink Beverages Market: A Comprehensive Market Report (2019-2033)
This comprehensive report provides a detailed analysis of the Ready-to-Drink (RTD) Beverages market, encompassing historical data (2019-2024), current estimates (2025), and future forecasts (2025-2033). We delve into market dynamics, growth trends, regional performance, product landscapes, key players, and emerging opportunities within the broader beverage industry. This in-depth study is essential for industry professionals, investors, and strategists seeking to understand and capitalize on the evolving RTD beverage landscape. The report segments the market by distribution channels (Supermarkets/Hypermarkets, Convenience/Grocery Stores, Online Stores, Specialty Retail Stores, Other Distribution Channels) and product types (Tea, Coffee, Energy Drinks, Yogurt Drinks, Dairy and Dairy Alternative Beverages, Flavored & Fortified Water, Other Product Types).
Ready to Drink Beverages Market Dynamics & Structure
This section analyzes the market's competitive landscape, technological advancements, regulatory influences, and evolving consumer preferences. The study period covers 2019-2033, with 2025 serving as the base year.
Market Concentration: The RTD beverage market is highly concentrated, with key players holding significant market share. The top 10 companies account for approximately xx% of the global market in 2025. This high concentration is driven by strong brand recognition, extensive distribution networks, and significant marketing investments. However, smaller niche players are also emerging, driven by consumer demand for unique and healthier options.
Technological Innovation: Advancements in packaging, preservation techniques, and flavor development are crucial drivers of market growth. Innovative packaging solutions, such as sustainable materials and convenient formats, are gaining traction. Furthermore, technological advancements in production efficiency are enabling companies to meet rising demand while controlling costs.
Regulatory Frameworks: Government regulations concerning sugar content, labeling, and health claims significantly impact the RTD beverage industry. These regulations vary across countries, creating both challenges and opportunities for companies. Compliance with these regulations is a key aspect of market entry and sustained growth.
Competitive Product Substitutes: The RTD beverage market faces competition from other beverage categories, including bottled water, juices, and homemade beverages. The intense competition necessitates continuous innovation and product differentiation to maintain market share.
End-User Demographics: The target demographic for RTD beverages is broad, encompassing various age groups and lifestyles. However, changing consumer preferences towards healthier and more functional beverages are shaping demand and influencing product development strategies.
M&A Trends: Mergers and acquisitions (M&A) activity in the RTD beverage industry has been significant. In 2024, xx M&A deals were recorded, with a total value of xx million units. These transactions facilitate market expansion, product diversification, and access to new technologies and distribution networks. However, stringent regulatory approvals can create barriers to M&A activity.
Ready to Drink Beverages Market Growth Trends & Insights
The RTD beverage market is experiencing robust growth, driven by factors such as rising disposable incomes, changing lifestyles, and increased demand for convenient and refreshing beverages. The global market size was valued at xx million units in 2024, and it is projected to reach xx million units by 2033, exhibiting a CAGR of xx% during the forecast period. This growth is fueled by increasing consumption in emerging economies, along with sustained demand in developed markets. Technological disruptions, such as the introduction of new flavor profiles and functional beverages, are further enhancing market expansion. Consumer behavior shifts towards healthier options and increased demand for premium and organic products are shaping market trends. Market penetration rates in various regions vary depending on factors such as economic development, cultural preferences, and product availability. Specific metrics regarding adoption rates and consumer preferences will be further detailed in the full report.
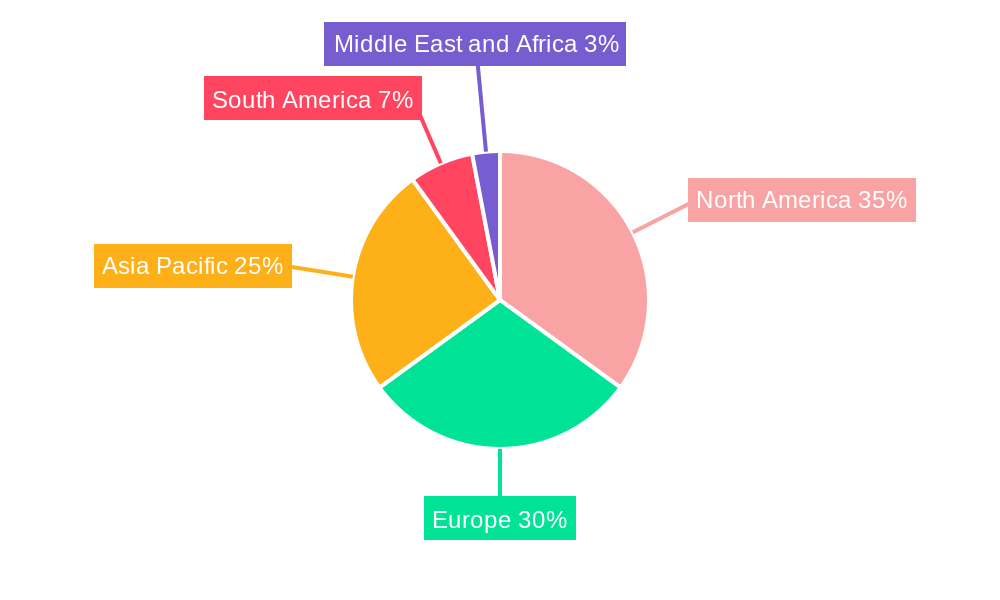
Dominant Regions, Countries, or Segments in Ready to Drink Beverages Market
North America and Europe currently dominate the RTD beverage market, accounting for approximately xx% of the global market share. However, Asia-Pacific is expected to witness significant growth in the coming years, driven by rising disposable incomes and increasing urbanization.
Dominant Distribution Channels:
Supermarkets/Hypermarkets: This remains the largest distribution channel, benefiting from high consumer foot traffic and diverse product offerings.
Convenience/Grocery Stores: The convenience factor drives substantial sales through this channel.
Dominant Product Types:
Energy Drinks: This segment is experiencing robust growth due to its association with an active lifestyle and demand for convenient energy boosts.
Flavored & Fortified Water: Growing health consciousness is driving the expansion of this segment. The incorporation of functional ingredients caters to the growing demand for healthier options.
Ready to Drink Beverages Market Product Landscape
The RTD beverage market offers a wide array of products, ranging from traditional carbonated soft drinks to functional beverages and organic teas. Continuous innovation in flavor profiles, ingredients, and packaging is evident. Key trends include the incorporation of functional ingredients (e.g., vitamins, probiotics) to enhance health benefits, the rise of natural and organic options, and the development of sustainable packaging solutions. Companies are also focusing on unique selling propositions, such as innovative flavors, convenient packaging, and ethical sourcing, to attract consumers and differentiate their offerings. Technological advancements in production and preservation techniques further contribute to expanding the product landscape.
Key Drivers, Barriers & Challenges in Ready to Drink Beverages Market
Key Drivers:
Growing Demand for Convenience: Busy lifestyles and on-the-go consumption patterns fuel the demand for ready-to-drink beverages.
Health & Wellness Trends: The increasing focus on health and wellness is driving the demand for healthier beverage options, such as functional beverages and organic choices.
Technological Advancements: Innovation in packaging, flavor development, and production efficiency drive market expansion.
Key Challenges & Restraints:
Fluctuating Raw Material Prices: Changes in the prices of raw materials, such as sugar and fruits, impact production costs and profitability.
Intense Competition: The highly competitive market necessitates continuous innovation and effective marketing strategies to maintain market share.
Regulatory Scrutiny: Stringent regulations concerning sugar content, labeling, and health claims present regulatory hurdles. The impact of these regulations is estimated to reduce market growth by approximately xx% by 2033.
Emerging Opportunities in Ready to Drink Beverages Market
Untapped Markets: Emerging markets in Asia-Pacific and Africa present significant growth potential.
Functional Beverages: The demand for beverages with added health benefits, such as probiotics and vitamins, is expected to expand.
Premiumization: Consumers are increasingly willing to pay more for premium and organic RTD beverages.
Growth Accelerators in the Ready to Drink Beverages Market Industry
Technological breakthroughs in beverage formulation and packaging are key growth accelerators. Strategic partnerships with ingredient suppliers and retailers further enhance market expansion. Aggressive market expansion strategies, such as entering new geographic regions and targeting new consumer segments, are instrumental in driving growth. The development of new product lines catering to niche consumer preferences and health concerns will also play a significant role in future growth.
Key Players Shaping the Ready to Drink Beverages Market Market
- Nestle SA
- Dabur India Limited
- Monster Beverage Corporation
- Yakult Honsha Co Ltd
- Pepsico Inc
- Danone SA
- Suntory Holdings Limited
- Red Bull GmbH
- Blue Diamond Growers
- The Coca-Cola Company
Notable Milestones in Ready to Drink Beverages Market Sector
February 2023: PepsiCo launched marshmallow-flavored Cola in partnership with Peeps, showcasing innovative flavor combinations.
September 2022: Honest Tea launched Just Iced Tea, highlighting a growing demand for organic and ethically sourced beverages.
March 2022: Nirvana Water Sciences Inc. introduced Nirvana HMB + vitamin D3 spring water, demonstrating the expansion of functional beverages.
In-Depth Ready to Drink Beverages Market Market Outlook
The RTD beverage market is poised for continued growth, driven by sustained consumer demand, technological advancements, and expanding distribution networks. Strategic opportunities exist in developing innovative products, tapping into untapped markets, and adopting sustainable practices. The focus on health and wellness, along with the rise of premium and functional beverages, will shape the future of the market. Companies must adapt to evolving consumer preferences and embrace technological advancements to maintain competitiveness and capitalize on long-term growth potential.
Ready to Drink Beverages Market Segmentation
-
1. Product Type
- 1.1. Tea
- 1.2. Coffee
- 1.3. Energy Drinks
- 1.4. Yogurt Drinks
- 1.5. Dairy and Dairy Alternative Beverages
- 1.6. Flavored and Fortified Water
- 1.7. Other Product Types
-
2. Distribution Channel
- 2.1. Supermarkets/Hypermarkets
- 2.2. Convenience/Grocery Stores
- 2.3. Online Stores
- 2.4. Specialty Retail Stores
- 2.5. Other Distribution Channels
Ready to Drink Beverages Market Segmentation By Geography
-
1. North America
- 1.1. United States
- 1.2. Canada
- 1.3. Mexico
- 1.4. Rest of North America
-
2. Europe
- 2.1. Germany
- 2.2. United Kingdom
- 2.3. Italy
- 2.4. Spain
- 2.5. France
- 2.6. Russia
- 2.7. Rest of Europe
-
3. Asia Pacific
- 3.1. China
- 3.2. Japan
- 3.3. India
- 3.4. Australia
- 3.5. Rest of Asia Pacific
-
4. South America
- 4.1. Brazil
- 4.2. Argentina
- 4.3. Rest of South America
-
5. Middle East and Africa
- 5.1. South Africa
- 5.2. Saudi Arabia
- 5.3. Rest of Middle East and Africa
Ready to Drink Beverages Market Regional Market Share
Geographic Coverage of Ready to Drink Beverages Market
Ready to Drink Beverages Market REPORT HIGHLIGHTS
| Aspects | Details |
|---|---|
| Study Period | 2020-2034 |
| Base Year | 2025 |
| Estimated Year | 2026 |
| Forecast Period | 2026-2034 |
| Historical Period | 2020-2025 |
| Growth Rate | CAGR of 4.81% from 2020-2034 |
| Segmentation |
|
Table of Contents
- 1. Introduction
- 1.1. Research Scope
- 1.2. Market Segmentation
- 1.3. Research Objective
- 1.4. Definitions and Assumptions
- 2. Executive Summary
- 2.1. Market Snapshot
- 3. Market Dynamics
- 3.1. Market Drivers
- 3.2. Market Restrains
- 3.3. Market Trends
- 3.4. Market Opportunities
- 4. Market Factor Analysis
- 4.1. Porters Five Forces
- 4.1.1. Bargaining Power of Suppliers
- 4.1.2. Bargaining Power of Buyers
- 4.1.3. Threat of New Entrants
- 4.1.4. Threat of Substitutes
- 4.1.5. Competitive Rivalry
- 4.2. PESTEL analysis
- 4.3. BCG Analysis
- 4.3.1. Stars (High Growth, High Market Share)
- 4.3.2. Cash Cows (Low Growth, High Market Share)
- 4.3.3. Question Mark (High Growth, Low Market Share)
- 4.3.4. Dogs (Low Growth, Low Market Share)
- 4.4. Ansoff Matrix Analysis
- 4.5. Supply Chain Analysis
- 4.6. Regulatory Landscape
- 4.7. Current Market Potential and Opportunity Assessment (TAM–SAM–SOM Framework)
- 4.8. IMR Analyst Note
- 4.1. Porters Five Forces
- 5. Market Analysis, Insights and Forecast 2021-2033
- 5.1. Market Analysis, Insights and Forecast - by Product Type
- 5.1.1. Tea
- 5.1.2. Coffee
- 5.1.3. Energy Drinks
- 5.1.4. Yogurt Drinks
- 5.1.5. Dairy and Dairy Alternative Beverages
- 5.1.6. Flavored and Fortified Water
- 5.1.7. Other Product Types
- 5.2. Market Analysis, Insights and Forecast - by Distribution Channel
- 5.2.1. Supermarkets/Hypermarkets
- 5.2.2. Convenience/Grocery Stores
- 5.2.3. Online Stores
- 5.2.4. Specialty Retail Stores
- 5.2.5. Other Distribution Channels
- 5.3. Market Analysis, Insights and Forecast - by Region
- 5.3.1. North America
- 5.3.2. Europe
- 5.3.3. Asia Pacific
- 5.3.4. South America
- 5.3.5. Middle East and Africa
- 5.1. Market Analysis, Insights and Forecast - by Product Type
- 6. Global Ready to Drink Beverages Market Analysis, Insights and Forecast, 2021-2033
- 6.1. Market Analysis, Insights and Forecast - by Product Type
- 6.1.1. Tea
- 6.1.2. Coffee
- 6.1.3. Energy Drinks
- 6.1.4. Yogurt Drinks
- 6.1.5. Dairy and Dairy Alternative Beverages
- 6.1.6. Flavored and Fortified Water
- 6.1.7. Other Product Types
- 6.2. Market Analysis, Insights and Forecast - by Distribution Channel
- 6.2.1. Supermarkets/Hypermarkets
- 6.2.2. Convenience/Grocery Stores
- 6.2.3. Online Stores
- 6.2.4. Specialty Retail Stores
- 6.2.5. Other Distribution Channels
- 6.1. Market Analysis, Insights and Forecast - by Product Type
- 7. North America Ready to Drink Beverages Market Analysis, Insights and Forecast, 2020-2032
- 7.1. Market Analysis, Insights and Forecast - by Product Type
- 7.1.1. Tea
- 7.1.2. Coffee
- 7.1.3. Energy Drinks
- 7.1.4. Yogurt Drinks
- 7.1.5. Dairy and Dairy Alternative Beverages
- 7.1.6. Flavored and Fortified Water
- 7.1.7. Other Product Types
- 7.2. Market Analysis, Insights and Forecast - by Distribution Channel
- 7.2.1. Supermarkets/Hypermarkets
- 7.2.2. Convenience/Grocery Stores
- 7.2.3. Online Stores
- 7.2.4. Specialty Retail Stores
- 7.2.5. Other Distribution Channels
- 7.1. Market Analysis, Insights and Forecast - by Product Type
- 8. Europe Ready to Drink Beverages Market Analysis, Insights and Forecast, 2020-2032
- 8.1. Market Analysis, Insights and Forecast - by Product Type
- 8.1.1. Tea
- 8.1.2. Coffee
- 8.1.3. Energy Drinks
- 8.1.4. Yogurt Drinks
- 8.1.5. Dairy and Dairy Alternative Beverages
- 8.1.6. Flavored and Fortified Water
- 8.1.7. Other Product Types
- 8.2. Market Analysis, Insights and Forecast - by Distribution Channel
- 8.2.1. Supermarkets/Hypermarkets
- 8.2.2. Convenience/Grocery Stores
- 8.2.3. Online Stores
- 8.2.4. Specialty Retail Stores
- 8.2.5. Other Distribution Channels
- 8.1. Market Analysis, Insights and Forecast - by Product Type
- 9. Asia Pacific Ready to Drink Beverages Market Analysis, Insights and Forecast, 2020-2032
- 9.1. Market Analysis, Insights and Forecast - by Product Type
- 9.1.1. Tea
- 9.1.2. Coffee
- 9.1.3. Energy Drinks
- 9.1.4. Yogurt Drinks
- 9.1.5. Dairy and Dairy Alternative Beverages
- 9.1.6. Flavored and Fortified Water
- 9.1.7. Other Product Types
- 9.2. Market Analysis, Insights and Forecast - by Distribution Channel
- 9.2.1. Supermarkets/Hypermarkets
- 9.2.2. Convenience/Grocery Stores
- 9.2.3. Online Stores
- 9.2.4. Specialty Retail Stores
- 9.2.5. Other Distribution Channels
- 9.1. Market Analysis, Insights and Forecast - by Product Type
- 10. South America Ready to Drink Beverages Market Analysis, Insights and Forecast, 2020-2032
- 10.1. Market Analysis, Insights and Forecast - by Product Type
- 10.1.1. Tea
- 10.1.2. Coffee
- 10.1.3. Energy Drinks
- 10.1.4. Yogurt Drinks
- 10.1.5. Dairy and Dairy Alternative Beverages
- 10.1.6. Flavored and Fortified Water
- 10.1.7. Other Product Types
- 10.2. Market Analysis, Insights and Forecast - by Distribution Channel
- 10.2.1. Supermarkets/Hypermarkets
- 10.2.2. Convenience/Grocery Stores
- 10.2.3. Online Stores
- 10.2.4. Specialty Retail Stores
- 10.2.5. Other Distribution Channels
- 10.1. Market Analysis, Insights and Forecast - by Product Type
- 11. Middle East and Africa Ready to Drink Beverages Market Analysis, Insights and Forecast, 2020-2032
- 11.1. Market Analysis, Insights and Forecast - by Product Type
- 11.1.1. Tea
- 11.1.2. Coffee
- 11.1.3. Energy Drinks
- 11.1.4. Yogurt Drinks
- 11.1.5. Dairy and Dairy Alternative Beverages
- 11.1.6. Flavored and Fortified Water
- 11.1.7. Other Product Types
- 11.2. Market Analysis, Insights and Forecast - by Distribution Channel
- 11.2.1. Supermarkets/Hypermarkets
- 11.2.2. Convenience/Grocery Stores
- 11.2.3. Online Stores
- 11.2.4. Specialty Retail Stores
- 11.2.5. Other Distribution Channels
- 11.1. Market Analysis, Insights and Forecast - by Product Type
- 12. Competitive Analysis
- 12.1. Company Profiles
- 12.1.1 Nestle SA
- 12.1.1.1. Company Overview
- 12.1.1.2. Products
- 12.1.1.3. Company Financials
- 12.1.1.4. SWOT Analysis
- 12.1.2 Dabur India Limited*List Not Exhaustive
- 12.1.2.1. Company Overview
- 12.1.2.2. Products
- 12.1.2.3. Company Financials
- 12.1.2.4. SWOT Analysis
- 12.1.3 Monster Beverage Corporation
- 12.1.3.1. Company Overview
- 12.1.3.2. Products
- 12.1.3.3. Company Financials
- 12.1.3.4. SWOT Analysis
- 12.1.4 Yakult Honsha Co Ltd
- 12.1.4.1. Company Overview
- 12.1.4.2. Products
- 12.1.4.3. Company Financials
- 12.1.4.4. SWOT Analysis
- 12.1.5 Pepsico Inc
- 12.1.5.1. Company Overview
- 12.1.5.2. Products
- 12.1.5.3. Company Financials
- 12.1.5.4. SWOT Analysis
- 12.1.6 Danone SA
- 12.1.6.1. Company Overview
- 12.1.6.2. Products
- 12.1.6.3. Company Financials
- 12.1.6.4. SWOT Analysis
- 12.1.7 Suntory Holdings Limited
- 12.1.7.1. Company Overview
- 12.1.7.2. Products
- 12.1.7.3. Company Financials
- 12.1.7.4. SWOT Analysis
- 12.1.8 Red Bull GmbH
- 12.1.8.1. Company Overview
- 12.1.8.2. Products
- 12.1.8.3. Company Financials
- 12.1.8.4. SWOT Analysis
- 12.1.9 Blue Diamond Growers
- 12.1.9.1. Company Overview
- 12.1.9.2. Products
- 12.1.9.3. Company Financials
- 12.1.9.4. SWOT Analysis
- 12.1.10 The Coca-Cola Company
- 12.1.10.1. Company Overview
- 12.1.10.2. Products
- 12.1.10.3. Company Financials
- 12.1.10.4. SWOT Analysis
- 12.1.1 Nestle SA
- 12.2. Market Entropy
- 12.2.1 Company's Key Areas Served
- 12.2.2 Recent Developments
- 12.3. Company Market Share Analysis 2025
- 12.3.1 Top 5 Companies Market Share Analysis
- 12.3.2 Top 3 Companies Market Share Analysis
- 12.4. List of Potential Customers
- 13. Research Methodology
List of Figures
- Figure 1: Global Ready to Drink Beverages Market Revenue Breakdown (Million, %) by Region 2025 & 2033
- Figure 2: North America Ready to Drink Beverages Market Revenue (Million), by Product Type 2025 & 2033
- Figure 3: North America Ready to Drink Beverages Market Revenue Share (%), by Product Type 2025 & 2033
- Figure 4: North America Ready to Drink Beverages Market Revenue (Million), by Distribution Channel 2025 & 2033
- Figure 5: North America Ready to Drink Beverages Market Revenue Share (%), by Distribution Channel 2025 & 2033
- Figure 6: North America Ready to Drink Beverages Market Revenue (Million), by Country 2025 & 2033
- Figure 7: North America Ready to Drink Beverages Market Revenue Share (%), by Country 2025 & 2033
- Figure 8: Europe Ready to Drink Beverages Market Revenue (Million), by Product Type 2025 & 2033
- Figure 9: Europe Ready to Drink Beverages Market Revenue Share (%), by Product Type 2025 & 2033
- Figure 10: Europe Ready to Drink Beverages Market Revenue (Million), by Distribution Channel 2025 & 2033
- Figure 11: Europe Ready to Drink Beverages Market Revenue Share (%), by Distribution Channel 2025 & 2033
- Figure 12: Europe Ready to Drink Beverages Market Revenue (Million), by Country 2025 & 2033
- Figure 13: Europe Ready to Drink Beverages Market Revenue Share (%), by Country 2025 & 2033
- Figure 14: Asia Pacific Ready to Drink Beverages Market Revenue (Million), by Product Type 2025 & 2033
- Figure 15: Asia Pacific Ready to Drink Beverages Market Revenue Share (%), by Product Type 2025 & 2033
- Figure 16: Asia Pacific Ready to Drink Beverages Market Revenue (Million), by Distribution Channel 2025 & 2033
- Figure 17: Asia Pacific Ready to Drink Beverages Market Revenue Share (%), by Distribution Channel 2025 & 2033
- Figure 18: Asia Pacific Ready to Drink Beverages Market Revenue (Million), by Country 2025 & 2033
- Figure 19: Asia Pacific Ready to Drink Beverages Market Revenue Share (%), by Country 2025 & 2033
- Figure 20: South America Ready to Drink Beverages Market Revenue (Million), by Product Type 2025 & 2033
- Figure 21: South America Ready to Drink Beverages Market Revenue Share (%), by Product Type 2025 & 2033
- Figure 22: South America Ready to Drink Beverages Market Revenue (Million), by Distribution Channel 2025 & 2033
- Figure 23: South America Ready to Drink Beverages Market Revenue Share (%), by Distribution Channel 2025 & 2033
- Figure 24: South America Ready to Drink Beverages Market Revenue (Million), by Country 2025 & 2033
- Figure 25: South America Ready to Drink Beverages Market Revenue Share (%), by Country 2025 & 2033
- Figure 26: Middle East and Africa Ready to Drink Beverages Market Revenue (Million), by Product Type 2025 & 2033
- Figure 27: Middle East and Africa Ready to Drink Beverages Market Revenue Share (%), by Product Type 2025 & 2033
- Figure 28: Middle East and Africa Ready to Drink Beverages Market Revenue (Million), by Distribution Channel 2025 & 2033
- Figure 29: Middle East and Africa Ready to Drink Beverages Market Revenue Share (%), by Distribution Channel 2025 & 2033
- Figure 30: Middle East and Africa Ready to Drink Beverages Market Revenue (Million), by Country 2025 & 2033
- Figure 31: Middle East and Africa Ready to Drink Beverages Market Revenue Share (%), by Country 2025 & 2033
List of Tables
- Table 1: Global Ready to Drink Beverages Market Revenue Million Forecast, by Product Type 2020 & 2033
- Table 2: Global Ready to Drink Beverages Market Revenue Million Forecast, by Distribution Channel 2020 & 2033
- Table 3: Global Ready to Drink Beverages Market Revenue Million Forecast, by Region 2020 & 2033
- Table 4: Global Ready to Drink Beverages Market Revenue Million Forecast, by Product Type 2020 & 2033
- Table 5: Global Ready to Drink Beverages Market Revenue Million Forecast, by Distribution Channel 2020 & 2033
- Table 6: Global Ready to Drink Beverages Market Revenue Million Forecast, by Country 2020 & 2033
- Table 7: United States Ready to Drink Beverages Market Revenue (Million) Forecast, by Application 2020 & 2033
- Table 8: Canada Ready to Drink Beverages Market Revenue (Million) Forecast, by Application 2020 & 2033
- Table 9: Mexico Ready to Drink Beverages Market Revenue (Million) Forecast, by Application 2020 & 2033
- Table 10: Rest of North America Ready to Drink Beverages Market Revenue (Million) Forecast, by Application 2020 & 2033
- Table 11: Global Ready to Drink Beverages Market Revenue Million Forecast, by Product Type 2020 & 2033
- Table 12: Global Ready to Drink Beverages Market Revenue Million Forecast, by Distribution Channel 2020 & 2033
- Table 13: Global Ready to Drink Beverages Market Revenue Million Forecast, by Country 2020 & 2033
- Table 14: Germany Ready to Drink Beverages Market Revenue (Million) Forecast, by Application 2020 & 2033
- Table 15: United Kingdom Ready to Drink Beverages Market Revenue (Million) Forecast, by Application 2020 & 2033
- Table 16: Italy Ready to Drink Beverages Market Revenue (Million) Forecast, by Application 2020 & 2033
- Table 17: Spain Ready to Drink Beverages Market Revenue (Million) Forecast, by Application 2020 & 2033
- Table 18: France Ready to Drink Beverages Market Revenue (Million) Forecast, by Application 2020 & 2033
- Table 19: Russia Ready to Drink Beverages Market Revenue (Million) Forecast, by Application 2020 & 2033
- Table 20: Rest of Europe Ready to Drink Beverages Market Revenue (Million) Forecast, by Application 2020 & 2033
- Table 21: Global Ready to Drink Beverages Market Revenue Million Forecast, by Product Type 2020 & 2033
- Table 22: Global Ready to Drink Beverages Market Revenue Million Forecast, by Distribution Channel 2020 & 2033
- Table 23: Global Ready to Drink Beverages Market Revenue Million Forecast, by Country 2020 & 2033
- Table 24: China Ready to Drink Beverages Market Revenue (Million) Forecast, by Application 2020 & 2033
- Table 25: Japan Ready to Drink Beverages Market Revenue (Million) Forecast, by Application 2020 & 2033
- Table 26: India Ready to Drink Beverages Market Revenue (Million) Forecast, by Application 2020 & 2033
- Table 27: Australia Ready to Drink Beverages Market Revenue (Million) Forecast, by Application 2020 & 2033
- Table 28: Rest of Asia Pacific Ready to Drink Beverages Market Revenue (Million) Forecast, by Application 2020 & 2033
- Table 29: Global Ready to Drink Beverages Market Revenue Million Forecast, by Product Type 2020 & 2033
- Table 30: Global Ready to Drink Beverages Market Revenue Million Forecast, by Distribution Channel 2020 & 2033
- Table 31: Global Ready to Drink Beverages Market Revenue Million Forecast, by Country 2020 & 2033
- Table 32: Brazil Ready to Drink Beverages Market Revenue (Million) Forecast, by Application 2020 & 2033
- Table 33: Argentina Ready to Drink Beverages Market Revenue (Million) Forecast, by Application 2020 & 2033
- Table 34: Rest of South America Ready to Drink Beverages Market Revenue (Million) Forecast, by Application 2020 & 2033
- Table 35: Global Ready to Drink Beverages Market Revenue Million Forecast, by Product Type 2020 & 2033
- Table 36: Global Ready to Drink Beverages Market Revenue Million Forecast, by Distribution Channel 2020 & 2033
- Table 37: Global Ready to Drink Beverages Market Revenue Million Forecast, by Country 2020 & 2033
- Table 38: South Africa Ready to Drink Beverages Market Revenue (Million) Forecast, by Application 2020 & 2033
- Table 39: Saudi Arabia Ready to Drink Beverages Market Revenue (Million) Forecast, by Application 2020 & 2033
- Table 40: Rest of Middle East and Africa Ready to Drink Beverages Market Revenue (Million) Forecast, by Application 2020 & 2033
Frequently Asked Questions
1. What is the projected Compound Annual Growth Rate (CAGR) of the Ready to Drink Beverages Market?
The projected CAGR is approximately 4.81%.
2. Which companies are prominent players in the Ready to Drink Beverages Market?
Key companies in the market include Nestle SA, Dabur India Limited*List Not Exhaustive, Monster Beverage Corporation, Yakult Honsha Co Ltd, Pepsico Inc, Danone SA, Suntory Holdings Limited, Red Bull GmbH, Blue Diamond Growers, The Coca-Cola Company.
3. What are the main segments of the Ready to Drink Beverages Market?
The market segments include Product Type, Distribution Channel.
4. Can you provide details about the market size?
The market size is estimated to be USD 361.01 Million as of 2022.
5. What are some drivers contributing to market growth?
Inclination Toward Low-Sugar/Sugar-free Beverages.
6. What are the notable trends driving market growth?
Augmented Expenditure on Advertisement and Promotional Activities Impel Market Growth.
7. Are there any restraints impacting market growth?
Concerns Over Health Issues Associated with Functional Beverages.
8. Can you provide examples of recent developments in the market?
February 2023: Pepsi Co. launched marshmallow-flavored Cola in partnership with Peeps. The pillowy-soft marshmallow cola flavor, paired with the instantly recognizable PEEPS®, comes in vibrant yellow packaging.
9. What pricing options are available for accessing the report?
Pricing options include single-user, multi-user, and enterprise licenses priced at USD 4750, USD 5250, and USD 8750 respectively.
10. Is the market size provided in terms of value or volume?
The market size is provided in terms of value, measured in Million.
11. Are there any specific market keywords associated with the report?
Yes, the market keyword associated with the report is "Ready to Drink Beverages Market," which aids in identifying and referencing the specific market segment covered.
12. How do I determine which pricing option suits my needs best?
The pricing options vary based on user requirements and access needs. Individual users may opt for single-user licenses, while businesses requiring broader access may choose multi-user or enterprise licenses for cost-effective access to the report.
13. Are there any additional resources or data provided in the Ready to Drink Beverages Market report?
While the report offers comprehensive insights, it's advisable to review the specific contents or supplementary materials provided to ascertain if additional resources or data are available.
14. How can I stay updated on further developments or reports in the Ready to Drink Beverages Market?
To stay informed about further developments, trends, and reports in the Ready to Drink Beverages Market, consider subscribing to industry newsletters, following relevant companies and organizations, or regularly checking reputable industry news sources and publications.
Methodology
Step 1 - Identification of Relevant Samples Size from Population Database


Step 2 - Approaches for Defining Global Market Size (Value, Volume* & Price*)

Note*: In applicable scenarios
Step 3 - Data Sources
Primary Research
- Web Analytics
- Survey Reports
- Research Institute
- Latest Research Reports
- Opinion Leaders
Secondary Research
- Annual Reports
- White Paper
- Latest Press Release
- Industry Association
- Paid Database
- Investor Presentations

Step 4 - Data Triangulation
Involves using different sources of information in order to increase the validity of a study
These sources are likely to be stakeholders in a program - participants, other researchers, program staff, other community members, and so on.
Then we put all data in single framework & apply various statistical tools to find out the dynamic on the market.
During the analysis stage, feedback from the stakeholder groups would be compared to determine areas of agreement as well as areas of divergence