

Key Insights
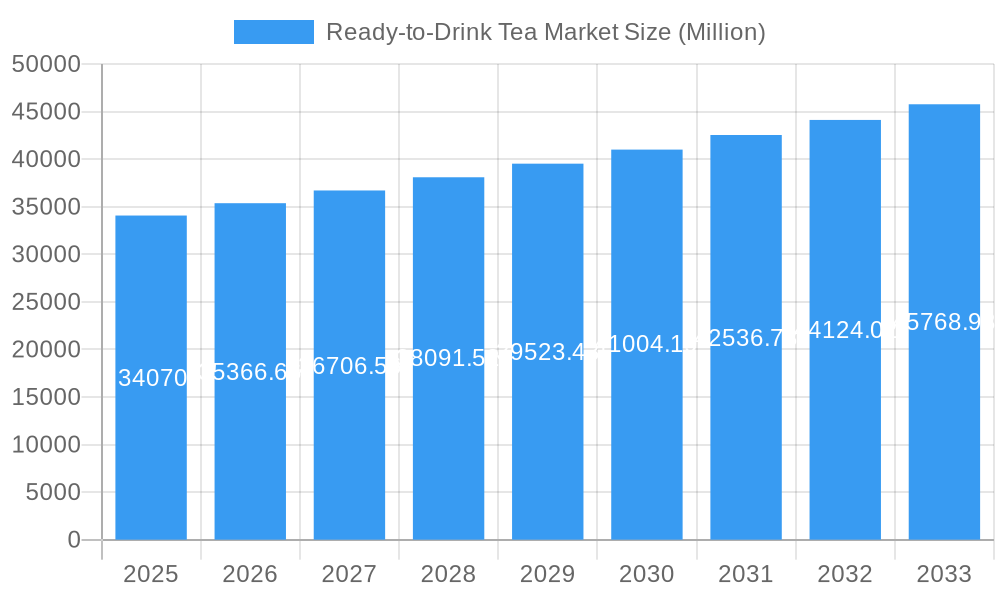
The Ready-to-Drink (RTD) tea market, valued at $34.07 billion in 2025, is projected to experience robust growth, exhibiting a Compound Annual Growth Rate (CAGR) of 3.80% from 2025 to 2033. This expansion is fueled by several key factors. The rising consumer preference for healthier beverage options, driven by increasing health consciousness and wellness trends, significantly boosts RTD tea demand. Convenience also plays a crucial role; RTD tea offers a portable and readily available alternative to other beverages, particularly among busy consumers. Furthermore, innovation within the RTD tea sector, encompassing new flavors, functional ingredients (e.g., added vitamins, antioxidants), and sustainable packaging, caters to evolving consumer preferences and expands market appeal. The market segmentation reveals a diverse landscape, with green tea and herbal tea leading the type segment, and supermarket/hypermarkets dominating the distribution channels. However, online stores are experiencing rapid growth, reflecting the shift towards e-commerce. Major players like Ito En, PepsiCo, and Coca-Cola are strategically investing in product development and marketing to capitalize on this expanding market. Geographic expansion, particularly in emerging economies with growing middle classes and increasing disposable incomes, further contributes to the market's overall growth trajectory.
Ready-to-Drink Tea Market Market Size (In Billion)
The competitive landscape is characterized by both established beverage giants and niche players. Large multinational companies leverage their extensive distribution networks and brand recognition to maintain market share. However, smaller companies are gaining traction by specializing in unique product offerings and catering to specific consumer segments. While factors such as fluctuating tea prices and competition from other beverage categories pose some restraints, the overall market outlook remains positive, driven by sustained consumer demand for healthier, convenient, and innovative beverage choices. The continuous evolution of consumer preferences, technological advancements in production and packaging, and increasing health consciousness suggest a promising future for the RTD tea market in the coming years. The market is expected to see further diversification in flavors, functional benefits, and sustainable packaging options.
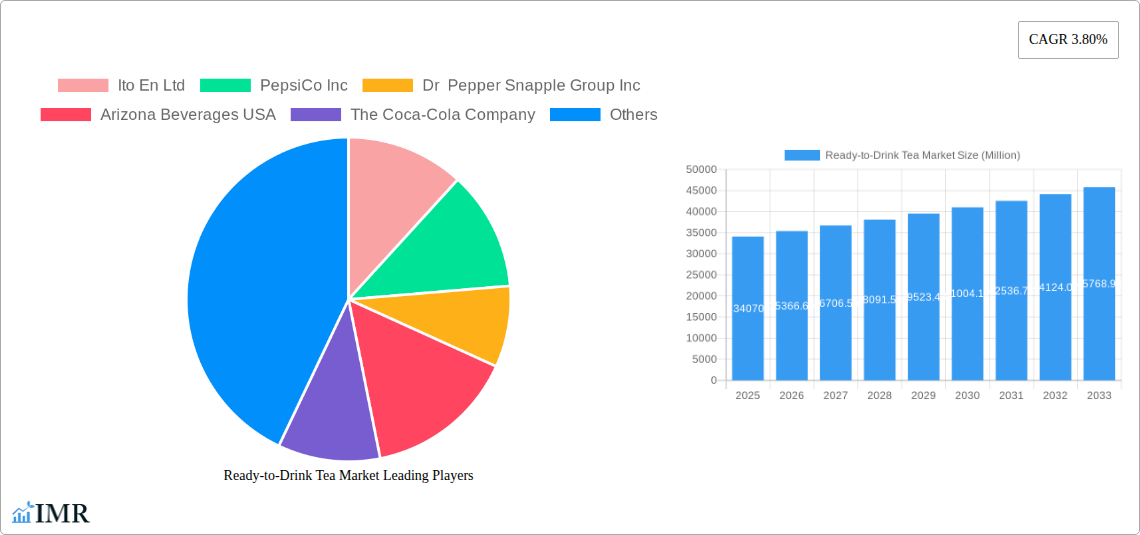
Ready-to-Drink Tea Market Company Market Share
Ready-to-Drink Tea Market: A Comprehensive Market Report (2019-2033)
This in-depth report provides a comprehensive analysis of the Ready-to-Drink (RTD) Tea Market, encompassing market dynamics, growth trends, regional performance, product landscape, and key players. The study covers the historical period (2019-2024), base year (2025), and forecasts the market's trajectory until 2033, offering invaluable insights for industry professionals, investors, and strategic decision-makers. The RTD tea market, a vibrant sub-segment within the larger beverage industry, is segmented by type (Green Tea, Herbal Tea, Others) and distribution channel (Supermarket/Hypermarket, Convenience Stores, Online Stores, Others). The market is projected to reach xx million units by 2033.
Ready-to-Drink Tea Market Market Dynamics & Structure
The RTD tea market exhibits a moderately concentrated structure, with major players like PepsiCo Inc, The Coca-Cola Company, and Ito En Ltd holding significant market share. Technological innovations, such as improved packaging and enhanced flavor profiles, are key drivers. Stringent regulatory frameworks regarding food safety and labeling influence market operations. The market faces competition from other beverage categories, including carbonated soft drinks and fruit juices. Consumer demographics, particularly the growing health-conscious population, significantly impact market demand. M&A activity, illustrated by PepsiCo's acquisition of KeVita in 2023, shapes market consolidation.
- Market Concentration: Moderately concentrated, with top 5 players holding xx% market share in 2024.
- Technological Innovation: Focus on enhanced flavors, functional ingredients (vitamins, probiotics), and sustainable packaging.
- Regulatory Landscape: Stringent food safety and labeling regulations vary by region.
- Competitive Landscape: Intense competition from other beverage categories.
- M&A Activity: Increased consolidation through acquisitions and mergers, with xx deals recorded between 2019-2024.
- End-User Demographics: Growing preference for healthier beverage options among millennials and Gen Z.
Ready-to-Drink Tea Market Growth Trends & Insights
The RTD tea market experienced robust growth during the historical period (2019-2024), with a CAGR of xx%. This growth is attributed to several factors, including rising health consciousness, increased consumer preference for natural and functional beverages, and the expansion of distribution channels. Technological disruptions, such as the introduction of innovative packaging and flavor combinations, have further fueled market expansion. Consumer behavior shifts towards healthier lifestyles and increased convenience also contribute to the market's growth trajectory. Market penetration has increased from xx% in 2019 to xx% in 2024, indicating significant market acceptance. The forecast period (2025-2033) projects continued growth, driven by factors such as increasing disposable incomes, particularly in emerging markets, and the introduction of new product variants.
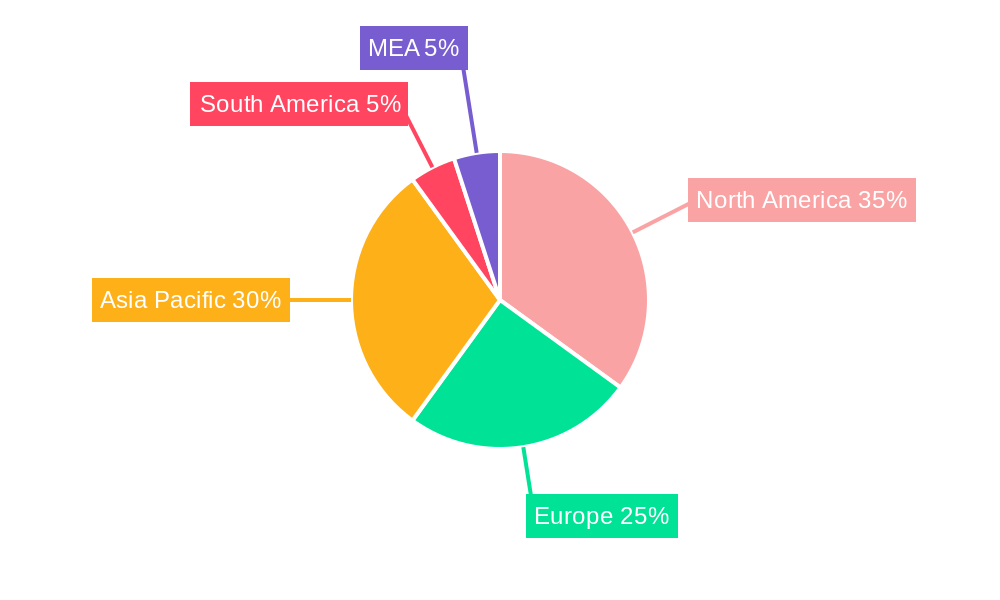
Dominant Regions, Countries, or Segments in Ready-to-Drink Tea Market
North America and Asia-Pacific are the dominant regions in the RTD tea market, driven by high consumption rates and strong consumer preference for tea. Within these regions, specific countries like the US, China, and Japan exhibit significant market share. The Green Tea segment holds the largest share within the "By Type" categorization, attributed to its established health benefits and widespread appeal. Supermarkets/Hypermarkets account for a significant share in the "By Distribution Channel" category, reflecting the established distribution infrastructure and consumer preference for convenient purchasing options.
- Key Drivers in North America: High disposable incomes, strong health and wellness trends, diverse product offerings.
- Key Drivers in Asia-Pacific: Established tea culture, growing middle class, expanding distribution networks.
- Green Tea Segment Dominance: Associated health benefits, wide consumer acceptance, and established market presence.
- Supermarket/Hypermarket Channel: Established distribution networks, wide product availability, and ease of access for consumers.
Ready-to-Drink Tea Market Product Landscape
The RTD tea market showcases a diverse product landscape featuring various types, flavors, and functional additions. Innovations include the incorporation of vitamins, minerals, probiotics, and real fruit juices, catering to diverse consumer preferences. Companies are focusing on unique selling propositions (USPs) like organic certifications, low-sugar options, and sustainable packaging to differentiate their products. Technological advancements in packaging, such as enhanced shelf life and convenient formats, have positively impacted market expansion.
Key Drivers, Barriers & Challenges in Ready-to-Drink Tea Market
Key Drivers: Increasing health consciousness, rising demand for convenient beverages, expansion of distribution channels, product innovation (e.g., functional teas), and growing disposable incomes in emerging markets.
Key Challenges: Intense competition from other beverage segments, fluctuating raw material prices, stringent regulatory compliance, and maintaining consistent supply chain efficiency. Supply chain disruptions can lead to production delays and impact profitability by xx%.
Emerging Opportunities in Ready-to-Drink Tea Market
Untapped markets in developing countries, particularly in Africa and Latin America, present significant growth opportunities. The growing demand for functional beverages, such as those with added health benefits, presents a lucrative avenue for product innovation. Evolving consumer preferences towards sustainable and ethically sourced products can be leveraged through certifications and transparent supply chain management.
Growth Accelerators in the Ready-to-Drink Tea Market Industry
Technological breakthroughs in packaging, such as aseptic processing and enhanced shelf-life technologies, will propel market expansion. Strategic partnerships between tea producers and beverage companies will foster wider market reach and accelerate growth. Expansion into new geographical markets and targeted marketing campaigns can further stimulate market growth.
Key Players Shaping the Ready-to-Drink Tea Market Market
- Ito En Ltd
- PepsiCo Inc
- Dr Pepper Snapple Group Inc
- Arizona Beverages USA
- The Coca-Cola Company
- Monster Beverage
- Nestlé SA
- Suntory Holdings Limited
- Unilever PLC
- Tata Global Beverages
Notable Milestones in Ready-to-Drink Tea Market Sector
- 2022: Ito En Ltd launched a new line of ready-to-drink green teas with added vitamins and minerals.
- 2023: PepsiCo Inc acquired KeVita, a leading producer of fermented probiotic tea drinks.
- 2024: Dr Pepper Snapple Group Inc launched a new line of ready-to-drink teas made with real fruit juice.
In-Depth Ready-to-Drink Tea Market Market Outlook
The RTD tea market is poised for sustained growth over the forecast period (2025-2033), driven by a confluence of factors including rising health consciousness, technological innovations, and expanding distribution channels. Strategic investments in product development, targeted marketing initiatives, and the exploration of untapped markets will be crucial for maximizing market potential. The market is expected to witness continued consolidation, with larger players acquiring smaller companies to expand their product portfolios and market share.
Ready-to-Drink Tea Market Segmentation
-
1. Type
- 1.1. Green Tea
- 1.2. Herbal Tea
- 1.3. Others
-
2. Distribution Channel
- 2.1. Supermarket/Hypermarket
- 2.2. Convenience Stores
- 2.3. Online Stores
- 2.4. Others
-
3. Geography
- 3.1. Brazil
- 3.2. Argentina
- 3.3. Rest of South America
Ready-to-Drink Tea Market Segmentation By Geography
- 1. Brazil
- 2. Argentina
- 3. Rest of South America
Ready-to-Drink Tea Market Regional Market Share
Geographic Coverage of Ready-to-Drink Tea Market
Ready-to-Drink Tea Market REPORT HIGHLIGHTS
| Aspects | Details |
|---|---|
| Study Period | 2020-2034 |
| Base Year | 2025 |
| Estimated Year | 2026 |
| Forecast Period | 2026-2034 |
| Historical Period | 2020-2025 |
| Growth Rate | CAGR of 3.80% from 2020-2034 |
| Segmentation |
|
Table of Contents
- 1. Introduction
- 1.1. Research Scope
- 1.2. Market Segmentation
- 1.3. Research Objective
- 1.4. Definitions and Assumptions
- 2. Executive Summary
- 2.1. Market Snapshot
- 3. Market Dynamics
- 3.1. Market Drivers
- 3.2. Market Restrains
- 3.3. Market Trends
- 3.4. Market Opportunities
- 4. Market Factor Analysis
- 4.1. Porters Five Forces
- 4.1.1. Bargaining Power of Suppliers
- 4.1.2. Bargaining Power of Buyers
- 4.1.3. Threat of New Entrants
- 4.1.4. Threat of Substitutes
- 4.1.5. Competitive Rivalry
- 4.2. PESTEL analysis
- 4.3. BCG Analysis
- 4.3.1. Stars (High Growth, High Market Share)
- 4.3.2. Cash Cows (Low Growth, High Market Share)
- 4.3.3. Question Mark (High Growth, Low Market Share)
- 4.3.4. Dogs (Low Growth, Low Market Share)
- 4.4. Ansoff Matrix Analysis
- 4.5. Supply Chain Analysis
- 4.6. Regulatory Landscape
- 4.7. Current Market Potential and Opportunity Assessment (TAM–SAM–SOM Framework)
- 4.8. IMR Analyst Note
- 4.1. Porters Five Forces
- 5. Market Analysis, Insights and Forecast 2021-2033
- 5.1. Market Analysis, Insights and Forecast - by Type
- 5.1.1. Green Tea
- 5.1.2. Herbal Tea
- 5.1.3. Others
- 5.2. Market Analysis, Insights and Forecast - by Distribution Channel
- 5.2.1. Supermarket/Hypermarket
- 5.2.2. Convenience Stores
- 5.2.3. Online Stores
- 5.2.4. Others
- 5.3. Market Analysis, Insights and Forecast - by Geography
- 5.3.1. Brazil
- 5.3.2. Argentina
- 5.3.3. Rest of South America
- 5.4. Market Analysis, Insights and Forecast - by Region
- 5.4.1. Brazil
- 5.4.2. Argentina
- 5.4.3. Rest of South America
- 5.1. Market Analysis, Insights and Forecast - by Type
- 6. Global Ready-to-Drink Tea Market Analysis, Insights and Forecast, 2021-2033
- 6.1. Market Analysis, Insights and Forecast - by Type
- 6.1.1. Green Tea
- 6.1.2. Herbal Tea
- 6.1.3. Others
- 6.2. Market Analysis, Insights and Forecast - by Distribution Channel
- 6.2.1. Supermarket/Hypermarket
- 6.2.2. Convenience Stores
- 6.2.3. Online Stores
- 6.2.4. Others
- 6.3. Market Analysis, Insights and Forecast - by Geography
- 6.3.1. Brazil
- 6.3.2. Argentina
- 6.3.3. Rest of South America
- 6.1. Market Analysis, Insights and Forecast - by Type
- 7. Brazil Ready-to-Drink Tea Market Analysis, Insights and Forecast, 2020-2032
- 7.1. Market Analysis, Insights and Forecast - by Type
- 7.1.1. Green Tea
- 7.1.2. Herbal Tea
- 7.1.3. Others
- 7.2. Market Analysis, Insights and Forecast - by Distribution Channel
- 7.2.1. Supermarket/Hypermarket
- 7.2.2. Convenience Stores
- 7.2.3. Online Stores
- 7.2.4. Others
- 7.3. Market Analysis, Insights and Forecast - by Geography
- 7.3.1. Brazil
- 7.3.2. Argentina
- 7.3.3. Rest of South America
- 7.1. Market Analysis, Insights and Forecast - by Type
- 8. Argentina Ready-to-Drink Tea Market Analysis, Insights and Forecast, 2020-2032
- 8.1. Market Analysis, Insights and Forecast - by Type
- 8.1.1. Green Tea
- 8.1.2. Herbal Tea
- 8.1.3. Others
- 8.2. Market Analysis, Insights and Forecast - by Distribution Channel
- 8.2.1. Supermarket/Hypermarket
- 8.2.2. Convenience Stores
- 8.2.3. Online Stores
- 8.2.4. Others
- 8.3. Market Analysis, Insights and Forecast - by Geography
- 8.3.1. Brazil
- 8.3.2. Argentina
- 8.3.3. Rest of South America
- 8.1. Market Analysis, Insights and Forecast - by Type
- 9. Rest of South America Ready-to-Drink Tea Market Analysis, Insights and Forecast, 2020-2032
- 9.1. Market Analysis, Insights and Forecast - by Type
- 9.1.1. Green Tea
- 9.1.2. Herbal Tea
- 9.1.3. Others
- 9.2. Market Analysis, Insights and Forecast - by Distribution Channel
- 9.2.1. Supermarket/Hypermarket
- 9.2.2. Convenience Stores
- 9.2.3. Online Stores
- 9.2.4. Others
- 9.3. Market Analysis, Insights and Forecast - by Geography
- 9.3.1. Brazil
- 9.3.2. Argentina
- 9.3.3. Rest of South America
- 9.1. Market Analysis, Insights and Forecast - by Type
- 10. Competitive Analysis
- 10.1. Company Profiles
- 10.1.1 Ito En Ltd
- 10.1.1.1. Company Overview
- 10.1.1.2. Products
- 10.1.1.3. Company Financials
- 10.1.1.4. SWOT Analysis
- 10.1.2 PepsiCo Inc
- 10.1.2.1. Company Overview
- 10.1.2.2. Products
- 10.1.2.3. Company Financials
- 10.1.2.4. SWOT Analysis
- 10.1.3 Dr Pepper Snapple Group Inc
- 10.1.3.1. Company Overview
- 10.1.3.2. Products
- 10.1.3.3. Company Financials
- 10.1.3.4. SWOT Analysis
- 10.1.4 Arizona Beverages USA
- 10.1.4.1. Company Overview
- 10.1.4.2. Products
- 10.1.4.3. Company Financials
- 10.1.4.4. SWOT Analysis
- 10.1.5 The Coca-Cola Company
- 10.1.5.1. Company Overview
- 10.1.5.2. Products
- 10.1.5.3. Company Financials
- 10.1.5.4. SWOT Analysis
- 10.1.6 Monster Beverage*List Not Exhaustive
- 10.1.6.1. Company Overview
- 10.1.6.2. Products
- 10.1.6.3. Company Financials
- 10.1.6.4. SWOT Analysis
- 10.1.7 Nestlé SA
- 10.1.7.1. Company Overview
- 10.1.7.2. Products
- 10.1.7.3. Company Financials
- 10.1.7.4. SWOT Analysis
- 10.1.8 Suntory Holdings Limited
- 10.1.8.1. Company Overview
- 10.1.8.2. Products
- 10.1.8.3. Company Financials
- 10.1.8.4. SWOT Analysis
- 10.1.9 Unilever PLC
- 10.1.9.1. Company Overview
- 10.1.9.2. Products
- 10.1.9.3. Company Financials
- 10.1.9.4. SWOT Analysis
- 10.1.10 Tata Global Beverages
- 10.1.10.1. Company Overview
- 10.1.10.2. Products
- 10.1.10.3. Company Financials
- 10.1.10.4. SWOT Analysis
- 10.1.1 Ito En Ltd
- 10.2. Market Entropy
- 10.2.1 Company's Key Areas Served
- 10.2.2 Recent Developments
- 10.3. Company Market Share Analysis 2025
- 10.3.1 Top 5 Companies Market Share Analysis
- 10.3.2 Top 3 Companies Market Share Analysis
- 10.4. List of Potential Customers
- 11. Research Methodology
List of Figures
- Figure 1: Global Ready-to-Drink Tea Market Revenue Breakdown (Million, %) by Region 2025 & 2033
- Figure 2: Global Ready-to-Drink Tea Market Volume Breakdown (K Tons, %) by Region 2025 & 2033
- Figure 3: Brazil Ready-to-Drink Tea Market Revenue (Million), by Type 2025 & 2033
- Figure 4: Brazil Ready-to-Drink Tea Market Volume (K Tons), by Type 2025 & 2033
- Figure 5: Brazil Ready-to-Drink Tea Market Revenue Share (%), by Type 2025 & 2033
- Figure 6: Brazil Ready-to-Drink Tea Market Volume Share (%), by Type 2025 & 2033
- Figure 7: Brazil Ready-to-Drink Tea Market Revenue (Million), by Distribution Channel 2025 & 2033
- Figure 8: Brazil Ready-to-Drink Tea Market Volume (K Tons), by Distribution Channel 2025 & 2033
- Figure 9: Brazil Ready-to-Drink Tea Market Revenue Share (%), by Distribution Channel 2025 & 2033
- Figure 10: Brazil Ready-to-Drink Tea Market Volume Share (%), by Distribution Channel 2025 & 2033
- Figure 11: Brazil Ready-to-Drink Tea Market Revenue (Million), by Geography 2025 & 2033
- Figure 12: Brazil Ready-to-Drink Tea Market Volume (K Tons), by Geography 2025 & 2033
- Figure 13: Brazil Ready-to-Drink Tea Market Revenue Share (%), by Geography 2025 & 2033
- Figure 14: Brazil Ready-to-Drink Tea Market Volume Share (%), by Geography 2025 & 2033
- Figure 15: Brazil Ready-to-Drink Tea Market Revenue (Million), by Country 2025 & 2033
- Figure 16: Brazil Ready-to-Drink Tea Market Volume (K Tons), by Country 2025 & 2033
- Figure 17: Brazil Ready-to-Drink Tea Market Revenue Share (%), by Country 2025 & 2033
- Figure 18: Brazil Ready-to-Drink Tea Market Volume Share (%), by Country 2025 & 2033
- Figure 19: Argentina Ready-to-Drink Tea Market Revenue (Million), by Type 2025 & 2033
- Figure 20: Argentina Ready-to-Drink Tea Market Volume (K Tons), by Type 2025 & 2033
- Figure 21: Argentina Ready-to-Drink Tea Market Revenue Share (%), by Type 2025 & 2033
- Figure 22: Argentina Ready-to-Drink Tea Market Volume Share (%), by Type 2025 & 2033
- Figure 23: Argentina Ready-to-Drink Tea Market Revenue (Million), by Distribution Channel 2025 & 2033
- Figure 24: Argentina Ready-to-Drink Tea Market Volume (K Tons), by Distribution Channel 2025 & 2033
- Figure 25: Argentina Ready-to-Drink Tea Market Revenue Share (%), by Distribution Channel 2025 & 2033
- Figure 26: Argentina Ready-to-Drink Tea Market Volume Share (%), by Distribution Channel 2025 & 2033
- Figure 27: Argentina Ready-to-Drink Tea Market Revenue (Million), by Geography 2025 & 2033
- Figure 28: Argentina Ready-to-Drink Tea Market Volume (K Tons), by Geography 2025 & 2033
- Figure 29: Argentina Ready-to-Drink Tea Market Revenue Share (%), by Geography 2025 & 2033
- Figure 30: Argentina Ready-to-Drink Tea Market Volume Share (%), by Geography 2025 & 2033
- Figure 31: Argentina Ready-to-Drink Tea Market Revenue (Million), by Country 2025 & 2033
- Figure 32: Argentina Ready-to-Drink Tea Market Volume (K Tons), by Country 2025 & 2033
- Figure 33: Argentina Ready-to-Drink Tea Market Revenue Share (%), by Country 2025 & 2033
- Figure 34: Argentina Ready-to-Drink Tea Market Volume Share (%), by Country 2025 & 2033
- Figure 35: Rest of South America Ready-to-Drink Tea Market Revenue (Million), by Type 2025 & 2033
- Figure 36: Rest of South America Ready-to-Drink Tea Market Volume (K Tons), by Type 2025 & 2033
- Figure 37: Rest of South America Ready-to-Drink Tea Market Revenue Share (%), by Type 2025 & 2033
- Figure 38: Rest of South America Ready-to-Drink Tea Market Volume Share (%), by Type 2025 & 2033
- Figure 39: Rest of South America Ready-to-Drink Tea Market Revenue (Million), by Distribution Channel 2025 & 2033
- Figure 40: Rest of South America Ready-to-Drink Tea Market Volume (K Tons), by Distribution Channel 2025 & 2033
- Figure 41: Rest of South America Ready-to-Drink Tea Market Revenue Share (%), by Distribution Channel 2025 & 2033
- Figure 42: Rest of South America Ready-to-Drink Tea Market Volume Share (%), by Distribution Channel 2025 & 2033
- Figure 43: Rest of South America Ready-to-Drink Tea Market Revenue (Million), by Geography 2025 & 2033
- Figure 44: Rest of South America Ready-to-Drink Tea Market Volume (K Tons), by Geography 2025 & 2033
- Figure 45: Rest of South America Ready-to-Drink Tea Market Revenue Share (%), by Geography 2025 & 2033
- Figure 46: Rest of South America Ready-to-Drink Tea Market Volume Share (%), by Geography 2025 & 2033
- Figure 47: Rest of South America Ready-to-Drink Tea Market Revenue (Million), by Country 2025 & 2033
- Figure 48: Rest of South America Ready-to-Drink Tea Market Volume (K Tons), by Country 2025 & 2033
- Figure 49: Rest of South America Ready-to-Drink Tea Market Revenue Share (%), by Country 2025 & 2033
- Figure 50: Rest of South America Ready-to-Drink Tea Market Volume Share (%), by Country 2025 & 2033
List of Tables
- Table 1: Global Ready-to-Drink Tea Market Revenue Million Forecast, by Type 2020 & 2033
- Table 2: Global Ready-to-Drink Tea Market Volume K Tons Forecast, by Type 2020 & 2033
- Table 3: Global Ready-to-Drink Tea Market Revenue Million Forecast, by Distribution Channel 2020 & 2033
- Table 4: Global Ready-to-Drink Tea Market Volume K Tons Forecast, by Distribution Channel 2020 & 2033
- Table 5: Global Ready-to-Drink Tea Market Revenue Million Forecast, by Geography 2020 & 2033
- Table 6: Global Ready-to-Drink Tea Market Volume K Tons Forecast, by Geography 2020 & 2033
- Table 7: Global Ready-to-Drink Tea Market Revenue Million Forecast, by Region 2020 & 2033
- Table 8: Global Ready-to-Drink Tea Market Volume K Tons Forecast, by Region 2020 & 2033
- Table 9: Global Ready-to-Drink Tea Market Revenue Million Forecast, by Type 2020 & 2033
- Table 10: Global Ready-to-Drink Tea Market Volume K Tons Forecast, by Type 2020 & 2033
- Table 11: Global Ready-to-Drink Tea Market Revenue Million Forecast, by Distribution Channel 2020 & 2033
- Table 12: Global Ready-to-Drink Tea Market Volume K Tons Forecast, by Distribution Channel 2020 & 2033
- Table 13: Global Ready-to-Drink Tea Market Revenue Million Forecast, by Geography 2020 & 2033
- Table 14: Global Ready-to-Drink Tea Market Volume K Tons Forecast, by Geography 2020 & 2033
- Table 15: Global Ready-to-Drink Tea Market Revenue Million Forecast, by Country 2020 & 2033
- Table 16: Global Ready-to-Drink Tea Market Volume K Tons Forecast, by Country 2020 & 2033
- Table 17: Global Ready-to-Drink Tea Market Revenue Million Forecast, by Type 2020 & 2033
- Table 18: Global Ready-to-Drink Tea Market Volume K Tons Forecast, by Type 2020 & 2033
- Table 19: Global Ready-to-Drink Tea Market Revenue Million Forecast, by Distribution Channel 2020 & 2033
- Table 20: Global Ready-to-Drink Tea Market Volume K Tons Forecast, by Distribution Channel 2020 & 2033
- Table 21: Global Ready-to-Drink Tea Market Revenue Million Forecast, by Geography 2020 & 2033
- Table 22: Global Ready-to-Drink Tea Market Volume K Tons Forecast, by Geography 2020 & 2033
- Table 23: Global Ready-to-Drink Tea Market Revenue Million Forecast, by Country 2020 & 2033
- Table 24: Global Ready-to-Drink Tea Market Volume K Tons Forecast, by Country 2020 & 2033
- Table 25: Global Ready-to-Drink Tea Market Revenue Million Forecast, by Type 2020 & 2033
- Table 26: Global Ready-to-Drink Tea Market Volume K Tons Forecast, by Type 2020 & 2033
- Table 27: Global Ready-to-Drink Tea Market Revenue Million Forecast, by Distribution Channel 2020 & 2033
- Table 28: Global Ready-to-Drink Tea Market Volume K Tons Forecast, by Distribution Channel 2020 & 2033
- Table 29: Global Ready-to-Drink Tea Market Revenue Million Forecast, by Geography 2020 & 2033
- Table 30: Global Ready-to-Drink Tea Market Volume K Tons Forecast, by Geography 2020 & 2033
- Table 31: Global Ready-to-Drink Tea Market Revenue Million Forecast, by Country 2020 & 2033
- Table 32: Global Ready-to-Drink Tea Market Volume K Tons Forecast, by Country 2020 & 2033
Frequently Asked Questions
1. What is the projected Compound Annual Growth Rate (CAGR) of the Ready-to-Drink Tea Market?
The projected CAGR is approximately 3.80%.
2. Which companies are prominent players in the Ready-to-Drink Tea Market?
Key companies in the market include Ito En Ltd, PepsiCo Inc, Dr Pepper Snapple Group Inc, Arizona Beverages USA, The Coca-Cola Company, Monster Beverage*List Not Exhaustive, Nestlé SA , Suntory Holdings Limited , Unilever PLC , Tata Global Beverages.
3. What are the main segments of the Ready-to-Drink Tea Market?
The market segments include Type, Distribution Channel, Geography.
4. Can you provide details about the market size?
The market size is estimated to be USD 34070 Million as of 2022.
5. What are some drivers contributing to market growth?
Increasing demand for meat alternatives.
6. What are the notable trends driving market growth?
Supermarket/ Hypermarket is the Most Preferred Sales Channel.
7. Are there any restraints impacting market growth?
Presence of numerous alternatives in the plant proteins.
8. Can you provide examples of recent developments in the market?
In 2022, Ito En Ltd launched a new line of ready-to-drink green teas with added vitamins and minerals.
9. What pricing options are available for accessing the report?
Pricing options include single-user, multi-user, and enterprise licenses priced at USD 4750, USD 5250, and USD 8750 respectively.
10. Is the market size provided in terms of value or volume?
The market size is provided in terms of value, measured in Million and volume, measured in K Tons.
11. Are there any specific market keywords associated with the report?
Yes, the market keyword associated with the report is "Ready-to-Drink Tea Market," which aids in identifying and referencing the specific market segment covered.
12. How do I determine which pricing option suits my needs best?
The pricing options vary based on user requirements and access needs. Individual users may opt for single-user licenses, while businesses requiring broader access may choose multi-user or enterprise licenses for cost-effective access to the report.
13. Are there any additional resources or data provided in the Ready-to-Drink Tea Market report?
While the report offers comprehensive insights, it's advisable to review the specific contents or supplementary materials provided to ascertain if additional resources or data are available.
14. How can I stay updated on further developments or reports in the Ready-to-Drink Tea Market?
To stay informed about further developments, trends, and reports in the Ready-to-Drink Tea Market, consider subscribing to industry newsletters, following relevant companies and organizations, or regularly checking reputable industry news sources and publications.
Methodology
Step 1 - Identification of Relevant Samples Size from Population Database


Step 2 - Approaches for Defining Global Market Size (Value, Volume* & Price*)

Note*: In applicable scenarios
Step 3 - Data Sources
Primary Research
- Web Analytics
- Survey Reports
- Research Institute
- Latest Research Reports
- Opinion Leaders
Secondary Research
- Annual Reports
- White Paper
- Latest Press Release
- Industry Association
- Paid Database
- Investor Presentations

Step 4 - Data Triangulation
Involves using different sources of information in order to increase the validity of a study
These sources are likely to be stakeholders in a program - participants, other researchers, program staff, other community members, and so on.
Then we put all data in single framework & apply various statistical tools to find out the dynamic on the market.
During the analysis stage, feedback from the stakeholder groups would be compared to determine areas of agreement as well as areas of divergence