

Key Insights
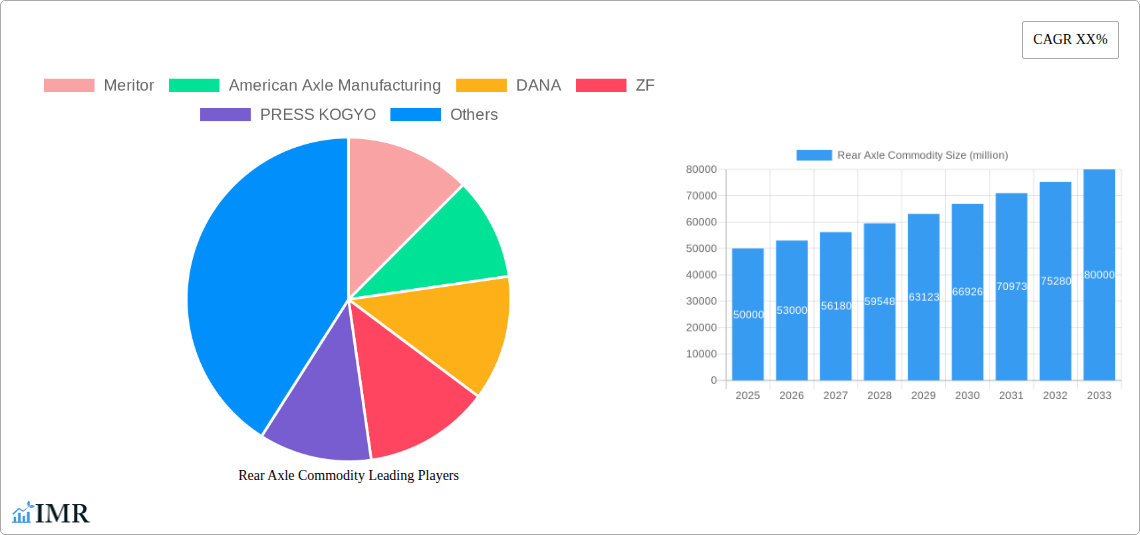
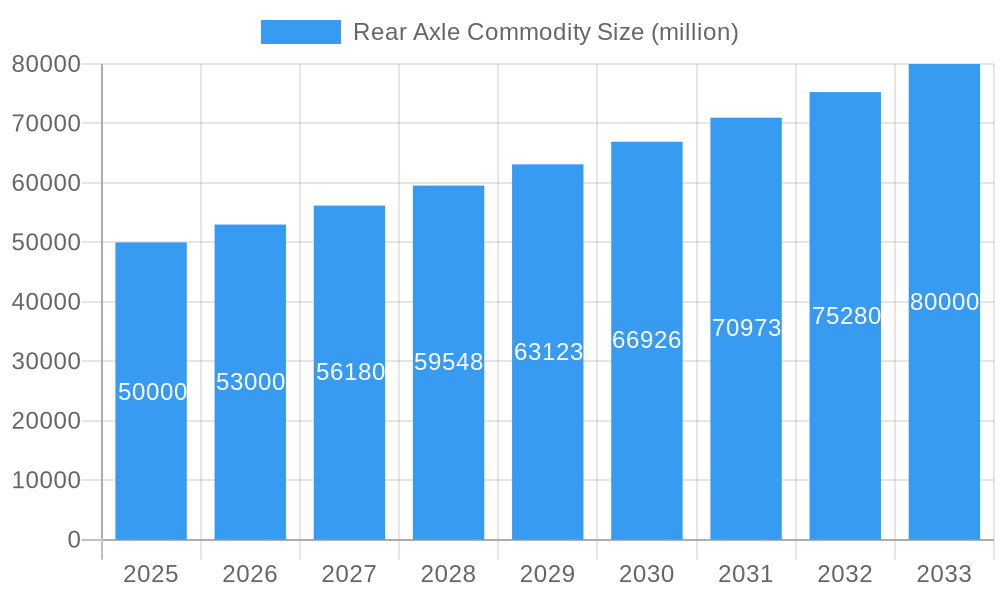
The global rear axle commodity market is projected for significant expansion, propelled by rising demand for commercial and passenger vehicles in emerging economies. The market, valued at $13.05 billion in the base year 2025, is expected to achieve a Compound Annual Growth Rate (CAGR) of 8.18% from 2025 to 2033. This growth is attributed to the increasing integration of Advanced Driver-Assistance Systems (ADAS), a growing preference for fuel-efficient vehicles, and stringent regulations mandating enhanced vehicle safety and emissions control. The automotive industry's transition towards electric vehicles (EVs) presents dynamic opportunities; while EV rear axle requirements may differ, the overall market is set for substantial growth due to the accelerating global adoption of electric mobility. Innovations in materials science, yielding lighter and more robust axle components, further underpin this positive market trajectory.
Rear Axle Commodity Market Size (In Billion)
Leading companies including Meritor, Dana, and ZF are making strategic investments in R&D to drive innovation in axle design, manufacturing, and material selection, aiming to secure a greater market share. Potential market constraints include volatility in raw material costs, economic downturns, and geopolitical uncertainties. The market is segmented by vehicle type (passenger, commercial), axle type (drive, non-drive), and geographical region. Intense competition exists between established global players and emerging regional manufacturers. Sustained growth in the rear axle commodity market hinges on continued efforts to optimize fuel efficiency, improve vehicle safety, and adapt to the rapidly evolving automotive technology landscape.
Rear Axle Commodity Company Market Share
Rear Axle Commodity Market Report: 2019-2033
This comprehensive report provides an in-depth analysis of the global rear axle commodity market, encompassing historical data (2019-2024), current estimates (2025), and future forecasts (2025-2033). The study covers key market segments, leading players, and emerging trends, offering valuable insights for industry professionals, investors, and strategic decision-makers. With a focus on parent markets (automotive, heavy-duty vehicles) and child markets (passenger cars, trucks, buses), this report delivers a granular understanding of market dynamics and growth potential.
Rear Axle Commodity Market Dynamics & Structure
This section analyzes the competitive landscape of the rear axle commodity market, focusing on market concentration, technological innovation, regulatory influences, and competitive dynamics. The report examines the impact of mergers and acquisitions (M&A) activity, end-user demographics, and the presence of substitute products. Quantitative data, including market share percentages and M&A deal volumes (in million USD) are presented alongside qualitative assessments of innovation barriers and market trends. The analysis considers the interplay between technological advancements and regulatory compliance in shaping market structure and competitive strategies.
- Market Concentration: xx% controlled by top 5 players in 2025.
- Technological Innovation Drivers: Focus on lightweighting, electrification, and improved fuel efficiency.
- Regulatory Frameworks: Emission standards and safety regulations impacting design and material choices.
- Competitive Product Substitutes: Limited direct substitutes; focus on comparative analysis with alternative drivetrain technologies.
- M&A Trends: xx number of significant M&A deals recorded between 2019-2024, with an estimated xx million USD in total value.
- End-User Demographics: Growth driven by increasing demand in emerging markets and the commercial vehicle sector.
Rear Axle Commodity Growth Trends & Insights
This in-depth analysis details the historical, current, and projected growth trajectory of the rear axle commodity market, using robust data analysis methods. Key performance indicators (KPIs) such as Compound Annual Growth Rate (CAGR), market penetration rates, and adoption trends are provided, supported by detailed explanations. Technological disruptions and shifts in consumer preferences are examined to provide comprehensive insights into market evolution and future growth potential. The report utilizes a blend of quantitative and qualitative analysis to offer a holistic view of growth drivers and potential challenges.
- Market Size Evolution: The market size is estimated at xx million units in 2025, projected to reach xx million units by 2033, exhibiting a CAGR of xx%.
- Adoption Rates: High adoption rates in developed markets, with significant growth potential in emerging economies.
- Technological Disruptions: Impact of electric vehicles (EVs) and autonomous driving technologies on rear axle design and functionality.
- Consumer Behavior Shifts: Demand for higher fuel efficiency, enhanced safety features, and improved durability.
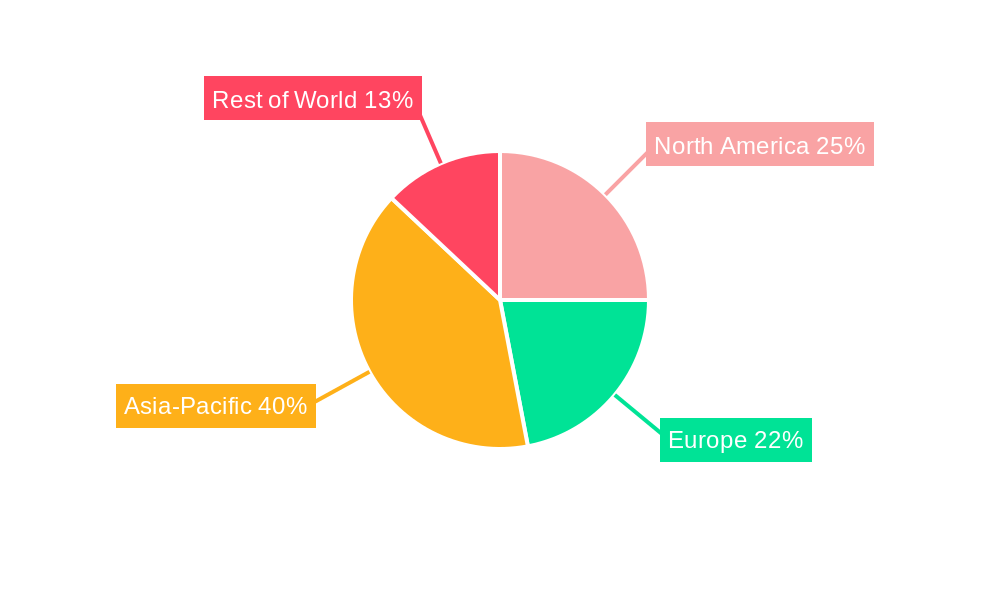
Dominant Regions, Countries, or Segments in Rear Axle Commodity
This section identifies the leading geographical regions, countries, or market segments driving rear axle commodity growth. A detailed analysis is provided of market dominance factors, including market share, growth potential, and key drivers in each region or segment. Economic policies, infrastructure development, and industry-specific regulations are examined to pinpoint the forces contributing to regional variations in market performance.
- Leading Region/Country: Asia Pacific is projected to dominate the market, with China and India as key contributors.
- Key Drivers:
- Economic growth: Rapid industrialization and infrastructure development in emerging economies.
- Government initiatives: Supportive policies promoting automotive production and infrastructure development.
- Infrastructure expansion: Growing demand for commercial vehicles to support expanding logistics and transportation networks.
- Market Share and Growth Potential: Detailed breakdown of market share by region and segment, including projections for future growth.
Rear Axle Commodity Product Landscape
This section provides an overview of rear axle commodity products, highlighting innovations, applications, and key performance indicators (KPIs). The analysis covers technological advancements, unique selling propositions (USPs), and the impact of new product features on market competitiveness.
The market features a range of rear axles tailored to diverse vehicle types and applications, emphasizing advancements in materials (e.g., lightweight alloys), design optimization for fuel efficiency, and integration of advanced technologies for enhanced performance and safety. Key KPIs include weight reduction, torque capacity, and durability.
Key Drivers, Barriers & Challenges in Rear Axle Commodity
This section presents a balanced perspective on the factors driving market growth and the challenges hindering its expansion. Technological advancements, economic conditions, and policy changes are assessed for their influence on market dynamics. Supply chain disruptions, regulatory hurdles, and competitive pressures are analyzed, incorporating quantifiable data on their impact.
Key Drivers:
- Technological advancements leading to lighter, stronger, and more efficient axles.
- Growing demand for commercial vehicles due to increased global trade and urbanization.
Challenges:
- Fluctuations in raw material prices impacting production costs.
- Stringent emission regulations requiring ongoing technological innovation.
- Intense competition from established and emerging players.
Emerging Opportunities in Rear Axle Commodity
This section spotlights emerging trends and opportunities in the rear axle commodity market. Untapped markets, innovative applications, and evolving consumer preferences are highlighted, identifying avenues for future growth. The analysis includes potential market expansion strategies and the identification of niche segments with high growth potential.
- Untapped markets in developing economies.
- Integration of advanced technologies such as electric motors and intelligent braking systems.
Growth Accelerators in the Rear Axle Commodity Industry
This section examines the catalysts driving long-term growth in the rear axle commodity industry. Technological breakthroughs, strategic partnerships, and expansion strategies are assessed for their potential to accelerate market expansion. The analysis identifies key factors that will shape the industry's future trajectory and unlock its full growth potential.
Technological breakthroughs in materials science, design optimization, and manufacturing processes are key drivers of innovation, along with strategic partnerships fostering collaboration and resource sharing. Expansion into new markets and segments presents significant growth opportunities.
Key Players Shaping the Rear Axle Commodity Market
- Meritor
- American Axle Manufacturing
- DANA
- ZF
- PRESS KOGYO
- HANDE Axle
- BENTELER
- Sichuan Jian’an
- KOFCO
- Gestamp
- Shandong Heavy Industry
- Hyundai
- Magneti Marelli
- SINOTRUK
- SAF-HOLLAND
- SG Automotive
- IJT Technology
- ROCKWELL
Notable Milestones in Rear Axle Commodity Sector
- 2020-Q4: Meritor launches a new lightweight rear axle for commercial vehicles.
- 2022-Q2: American Axle Manufacturing announces a strategic partnership with an EV component supplier.
- 2023-Q1: ZF unveils its next-generation electric rear axle system. (Further milestones will be added based on data availability.)
In-Depth Rear Axle Commodity Market Outlook
The rear axle commodity market is poised for sustained growth, driven by the continued expansion of the global automotive industry and the increasing demand for commercial vehicles. Technological advancements, strategic partnerships, and market expansion into new geographies will be key drivers of future growth. Companies that invest in innovation, optimize their supply chains, and adapt to evolving regulatory landscapes will be best positioned to capture significant market share in the years to come.
Rear Axle Commodity Segmentation
-
1. Application
- 1.1. Passenger Vehicles
- 1.2. Light Commercial Vehicles
- 1.3. Heavy Commercial Vehicles
-
2. Types
- 2.1. Lift Axle
- 2.2. Dead Axle
- 2.3. Drive Axle
Rear Axle Commodity Segmentation By Geography
-
1. North America
- 1.1. United States
- 1.2. Canada
- 1.3. Mexico
-
2. South America
- 2.1. Brazil
- 2.2. Argentina
- 2.3. Rest of South America
-
3. Europe
- 3.1. United Kingdom
- 3.2. Germany
- 3.3. France
- 3.4. Italy
- 3.5. Spain
- 3.6. Russia
- 3.7. Benelux
- 3.8. Nordics
- 3.9. Rest of Europe
-
4. Middle East & Africa
- 4.1. Turkey
- 4.2. Israel
- 4.3. GCC
- 4.4. North Africa
- 4.5. South Africa
- 4.6. Rest of Middle East & Africa
-
5. Asia Pacific
- 5.1. China
- 5.2. India
- 5.3. Japan
- 5.4. South Korea
- 5.5. ASEAN
- 5.6. Oceania
- 5.7. Rest of Asia Pacific
Rear Axle Commodity Regional Market Share
Geographic Coverage of Rear Axle Commodity
Rear Axle Commodity REPORT HIGHLIGHTS
| Aspects | Details |
|---|---|
| Study Period | 2020-2034 |
| Base Year | 2025 |
| Estimated Year | 2026 |
| Forecast Period | 2026-2034 |
| Historical Period | 2020-2025 |
| Growth Rate | CAGR of 8.18% from 2020-2034 |
| Segmentation |
|
Table of Contents
- 1. Introduction
- 1.1. Research Scope
- 1.2. Market Segmentation
- 1.3. Research Objective
- 1.4. Definitions and Assumptions
- 2. Executive Summary
- 2.1. Market Snapshot
- 3. Market Dynamics
- 3.1. Market Drivers
- 3.2. Market Restrains
- 3.3. Market Trends
- 3.4. Market Opportunities
- 4. Market Factor Analysis
- 4.1. Porters Five Forces
- 4.1.1. Bargaining Power of Suppliers
- 4.1.2. Bargaining Power of Buyers
- 4.1.3. Threat of New Entrants
- 4.1.4. Threat of Substitutes
- 4.1.5. Competitive Rivalry
- 4.2. PESTEL analysis
- 4.3. BCG Analysis
- 4.3.1. Stars (High Growth, High Market Share)
- 4.3.2. Cash Cows (Low Growth, High Market Share)
- 4.3.3. Question Mark (High Growth, Low Market Share)
- 4.3.4. Dogs (Low Growth, Low Market Share)
- 4.4. Ansoff Matrix Analysis
- 4.5. Supply Chain Analysis
- 4.6. Regulatory Landscape
- 4.7. Current Market Potential and Opportunity Assessment (TAM–SAM–SOM Framework)
- 4.8. IMR Analyst Note
- 4.1. Porters Five Forces
- 5. Market Analysis, Insights and Forecast 2021-2033
- 5.1. Market Analysis, Insights and Forecast - by Application
- 5.1.1. Passenger Vehicles
- 5.1.2. Light Commercial Vehicles
- 5.1.3. Heavy Commercial Vehicles
- 5.2. Market Analysis, Insights and Forecast - by Types
- 5.2.1. Lift Axle
- 5.2.2. Dead Axle
- 5.2.3. Drive Axle
- 5.3. Market Analysis, Insights and Forecast - by Region
- 5.3.1. North America
- 5.3.2. South America
- 5.3.3. Europe
- 5.3.4. Middle East & Africa
- 5.3.5. Asia Pacific
- 5.1. Market Analysis, Insights and Forecast - by Application
- 6. Global Rear Axle Commodity Analysis, Insights and Forecast, 2021-2033
- 6.1. Market Analysis, Insights and Forecast - by Application
- 6.1.1. Passenger Vehicles
- 6.1.2. Light Commercial Vehicles
- 6.1.3. Heavy Commercial Vehicles
- 6.2. Market Analysis, Insights and Forecast - by Types
- 6.2.1. Lift Axle
- 6.2.2. Dead Axle
- 6.2.3. Drive Axle
- 6.1. Market Analysis, Insights and Forecast - by Application
- 7. North America Rear Axle Commodity Analysis, Insights and Forecast, 2020-2032
- 7.1. Market Analysis, Insights and Forecast - by Application
- 7.1.1. Passenger Vehicles
- 7.1.2. Light Commercial Vehicles
- 7.1.3. Heavy Commercial Vehicles
- 7.2. Market Analysis, Insights and Forecast - by Types
- 7.2.1. Lift Axle
- 7.2.2. Dead Axle
- 7.2.3. Drive Axle
- 7.1. Market Analysis, Insights and Forecast - by Application
- 8. South America Rear Axle Commodity Analysis, Insights and Forecast, 2020-2032
- 8.1. Market Analysis, Insights and Forecast - by Application
- 8.1.1. Passenger Vehicles
- 8.1.2. Light Commercial Vehicles
- 8.1.3. Heavy Commercial Vehicles
- 8.2. Market Analysis, Insights and Forecast - by Types
- 8.2.1. Lift Axle
- 8.2.2. Dead Axle
- 8.2.3. Drive Axle
- 8.1. Market Analysis, Insights and Forecast - by Application
- 9. Europe Rear Axle Commodity Analysis, Insights and Forecast, 2020-2032
- 9.1. Market Analysis, Insights and Forecast - by Application
- 9.1.1. Passenger Vehicles
- 9.1.2. Light Commercial Vehicles
- 9.1.3. Heavy Commercial Vehicles
- 9.2. Market Analysis, Insights and Forecast - by Types
- 9.2.1. Lift Axle
- 9.2.2. Dead Axle
- 9.2.3. Drive Axle
- 9.1. Market Analysis, Insights and Forecast - by Application
- 10. Middle East & Africa Rear Axle Commodity Analysis, Insights and Forecast, 2020-2032
- 10.1. Market Analysis, Insights and Forecast - by Application
- 10.1.1. Passenger Vehicles
- 10.1.2. Light Commercial Vehicles
- 10.1.3. Heavy Commercial Vehicles
- 10.2. Market Analysis, Insights and Forecast - by Types
- 10.2.1. Lift Axle
- 10.2.2. Dead Axle
- 10.2.3. Drive Axle
- 10.1. Market Analysis, Insights and Forecast - by Application
- 11. Asia Pacific Rear Axle Commodity Analysis, Insights and Forecast, 2020-2032
- 11.1. Market Analysis, Insights and Forecast - by Application
- 11.1.1. Passenger Vehicles
- 11.1.2. Light Commercial Vehicles
- 11.1.3. Heavy Commercial Vehicles
- 11.2. Market Analysis, Insights and Forecast - by Types
- 11.2.1. Lift Axle
- 11.2.2. Dead Axle
- 11.2.3. Drive Axle
- 11.1. Market Analysis, Insights and Forecast - by Application
- 12. Competitive Analysis
- 12.1. Company Profiles
- 12.1.1 Meritor
- 12.1.1.1. Company Overview
- 12.1.1.2. Products
- 12.1.1.3. Company Financials
- 12.1.1.4. SWOT Analysis
- 12.1.2 American Axle Manufacturing
- 12.1.2.1. Company Overview
- 12.1.2.2. Products
- 12.1.2.3. Company Financials
- 12.1.2.4. SWOT Analysis
- 12.1.3 DANA
- 12.1.3.1. Company Overview
- 12.1.3.2. Products
- 12.1.3.3. Company Financials
- 12.1.3.4. SWOT Analysis
- 12.1.4 ZF
- 12.1.4.1. Company Overview
- 12.1.4.2. Products
- 12.1.4.3. Company Financials
- 12.1.4.4. SWOT Analysis
- 12.1.5 PRESS KOGYO
- 12.1.5.1. Company Overview
- 12.1.5.2. Products
- 12.1.5.3. Company Financials
- 12.1.5.4. SWOT Analysis
- 12.1.6 HANDE Axle
- 12.1.6.1. Company Overview
- 12.1.6.2. Products
- 12.1.6.3. Company Financials
- 12.1.6.4. SWOT Analysis
- 12.1.7 BENTELER
- 12.1.7.1. Company Overview
- 12.1.7.2. Products
- 12.1.7.3. Company Financials
- 12.1.7.4. SWOT Analysis
- 12.1.8 Sichuan Jian’an
- 12.1.8.1. Company Overview
- 12.1.8.2. Products
- 12.1.8.3. Company Financials
- 12.1.8.4. SWOT Analysis
- 12.1.9 KOFCO
- 12.1.9.1. Company Overview
- 12.1.9.2. Products
- 12.1.9.3. Company Financials
- 12.1.9.4. SWOT Analysis
- 12.1.10 Gestamp
- 12.1.10.1. Company Overview
- 12.1.10.2. Products
- 12.1.10.3. Company Financials
- 12.1.10.4. SWOT Analysis
- 12.1.11 Shandong Heavy Industry
- 12.1.11.1. Company Overview
- 12.1.11.2. Products
- 12.1.11.3. Company Financials
- 12.1.11.4. SWOT Analysis
- 12.1.12 Hyundai
- 12.1.12.1. Company Overview
- 12.1.12.2. Products
- 12.1.12.3. Company Financials
- 12.1.12.4. SWOT Analysis
- 12.1.13 Magneti Marelli
- 12.1.13.1. Company Overview
- 12.1.13.2. Products
- 12.1.13.3. Company Financials
- 12.1.13.4. SWOT Analysis
- 12.1.14 SINOTRUK
- 12.1.14.1. Company Overview
- 12.1.14.2. Products
- 12.1.14.3. Company Financials
- 12.1.14.4. SWOT Analysis
- 12.1.15 SAF-HOLLAND
- 12.1.15.1. Company Overview
- 12.1.15.2. Products
- 12.1.15.3. Company Financials
- 12.1.15.4. SWOT Analysis
- 12.1.16 SG Automotive
- 12.1.16.1. Company Overview
- 12.1.16.2. Products
- 12.1.16.3. Company Financials
- 12.1.16.4. SWOT Analysis
- 12.1.17 IJT Technology
- 12.1.17.1. Company Overview
- 12.1.17.2. Products
- 12.1.17.3. Company Financials
- 12.1.17.4. SWOT Analysis
- 12.1.18 ROCKWELL
- 12.1.18.1. Company Overview
- 12.1.18.2. Products
- 12.1.18.3. Company Financials
- 12.1.18.4. SWOT Analysis
- 12.1.1 Meritor
- 12.2. Market Entropy
- 12.2.1 Company's Key Areas Served
- 12.2.2 Recent Developments
- 12.3. Company Market Share Analysis 2025
- 12.3.1 Top 5 Companies Market Share Analysis
- 12.3.2 Top 3 Companies Market Share Analysis
- 12.4. List of Potential Customers
- 13. Research Methodology
List of Figures
- Figure 1: Global Rear Axle Commodity Revenue Breakdown (billion, %) by Region 2025 & 2033
- Figure 2: North America Rear Axle Commodity Revenue (billion), by Application 2025 & 2033
- Figure 3: North America Rear Axle Commodity Revenue Share (%), by Application 2025 & 2033
- Figure 4: North America Rear Axle Commodity Revenue (billion), by Types 2025 & 2033
- Figure 5: North America Rear Axle Commodity Revenue Share (%), by Types 2025 & 2033
- Figure 6: North America Rear Axle Commodity Revenue (billion), by Country 2025 & 2033
- Figure 7: North America Rear Axle Commodity Revenue Share (%), by Country 2025 & 2033
- Figure 8: South America Rear Axle Commodity Revenue (billion), by Application 2025 & 2033
- Figure 9: South America Rear Axle Commodity Revenue Share (%), by Application 2025 & 2033
- Figure 10: South America Rear Axle Commodity Revenue (billion), by Types 2025 & 2033
- Figure 11: South America Rear Axle Commodity Revenue Share (%), by Types 2025 & 2033
- Figure 12: South America Rear Axle Commodity Revenue (billion), by Country 2025 & 2033
- Figure 13: South America Rear Axle Commodity Revenue Share (%), by Country 2025 & 2033
- Figure 14: Europe Rear Axle Commodity Revenue (billion), by Application 2025 & 2033
- Figure 15: Europe Rear Axle Commodity Revenue Share (%), by Application 2025 & 2033
- Figure 16: Europe Rear Axle Commodity Revenue (billion), by Types 2025 & 2033
- Figure 17: Europe Rear Axle Commodity Revenue Share (%), by Types 2025 & 2033
- Figure 18: Europe Rear Axle Commodity Revenue (billion), by Country 2025 & 2033
- Figure 19: Europe Rear Axle Commodity Revenue Share (%), by Country 2025 & 2033
- Figure 20: Middle East & Africa Rear Axle Commodity Revenue (billion), by Application 2025 & 2033
- Figure 21: Middle East & Africa Rear Axle Commodity Revenue Share (%), by Application 2025 & 2033
- Figure 22: Middle East & Africa Rear Axle Commodity Revenue (billion), by Types 2025 & 2033
- Figure 23: Middle East & Africa Rear Axle Commodity Revenue Share (%), by Types 2025 & 2033
- Figure 24: Middle East & Africa Rear Axle Commodity Revenue (billion), by Country 2025 & 2033
- Figure 25: Middle East & Africa Rear Axle Commodity Revenue Share (%), by Country 2025 & 2033
- Figure 26: Asia Pacific Rear Axle Commodity Revenue (billion), by Application 2025 & 2033
- Figure 27: Asia Pacific Rear Axle Commodity Revenue Share (%), by Application 2025 & 2033
- Figure 28: Asia Pacific Rear Axle Commodity Revenue (billion), by Types 2025 & 2033
- Figure 29: Asia Pacific Rear Axle Commodity Revenue Share (%), by Types 2025 & 2033
- Figure 30: Asia Pacific Rear Axle Commodity Revenue (billion), by Country 2025 & 2033
- Figure 31: Asia Pacific Rear Axle Commodity Revenue Share (%), by Country 2025 & 2033
List of Tables
- Table 1: Global Rear Axle Commodity Revenue billion Forecast, by Application 2020 & 2033
- Table 2: Global Rear Axle Commodity Revenue billion Forecast, by Types 2020 & 2033
- Table 3: Global Rear Axle Commodity Revenue billion Forecast, by Region 2020 & 2033
- Table 4: Global Rear Axle Commodity Revenue billion Forecast, by Application 2020 & 2033
- Table 5: Global Rear Axle Commodity Revenue billion Forecast, by Types 2020 & 2033
- Table 6: Global Rear Axle Commodity Revenue billion Forecast, by Country 2020 & 2033
- Table 7: United States Rear Axle Commodity Revenue (billion) Forecast, by Application 2020 & 2033
- Table 8: Canada Rear Axle Commodity Revenue (billion) Forecast, by Application 2020 & 2033
- Table 9: Mexico Rear Axle Commodity Revenue (billion) Forecast, by Application 2020 & 2033
- Table 10: Global Rear Axle Commodity Revenue billion Forecast, by Application 2020 & 2033
- Table 11: Global Rear Axle Commodity Revenue billion Forecast, by Types 2020 & 2033
- Table 12: Global Rear Axle Commodity Revenue billion Forecast, by Country 2020 & 2033
- Table 13: Brazil Rear Axle Commodity Revenue (billion) Forecast, by Application 2020 & 2033
- Table 14: Argentina Rear Axle Commodity Revenue (billion) Forecast, by Application 2020 & 2033
- Table 15: Rest of South America Rear Axle Commodity Revenue (billion) Forecast, by Application 2020 & 2033
- Table 16: Global Rear Axle Commodity Revenue billion Forecast, by Application 2020 & 2033
- Table 17: Global Rear Axle Commodity Revenue billion Forecast, by Types 2020 & 2033
- Table 18: Global Rear Axle Commodity Revenue billion Forecast, by Country 2020 & 2033
- Table 19: United Kingdom Rear Axle Commodity Revenue (billion) Forecast, by Application 2020 & 2033
- Table 20: Germany Rear Axle Commodity Revenue (billion) Forecast, by Application 2020 & 2033
- Table 21: France Rear Axle Commodity Revenue (billion) Forecast, by Application 2020 & 2033
- Table 22: Italy Rear Axle Commodity Revenue (billion) Forecast, by Application 2020 & 2033
- Table 23: Spain Rear Axle Commodity Revenue (billion) Forecast, by Application 2020 & 2033
- Table 24: Russia Rear Axle Commodity Revenue (billion) Forecast, by Application 2020 & 2033
- Table 25: Benelux Rear Axle Commodity Revenue (billion) Forecast, by Application 2020 & 2033
- Table 26: Nordics Rear Axle Commodity Revenue (billion) Forecast, by Application 2020 & 2033
- Table 27: Rest of Europe Rear Axle Commodity Revenue (billion) Forecast, by Application 2020 & 2033
- Table 28: Global Rear Axle Commodity Revenue billion Forecast, by Application 2020 & 2033
- Table 29: Global Rear Axle Commodity Revenue billion Forecast, by Types 2020 & 2033
- Table 30: Global Rear Axle Commodity Revenue billion Forecast, by Country 2020 & 2033
- Table 31: Turkey Rear Axle Commodity Revenue (billion) Forecast, by Application 2020 & 2033
- Table 32: Israel Rear Axle Commodity Revenue (billion) Forecast, by Application 2020 & 2033
- Table 33: GCC Rear Axle Commodity Revenue (billion) Forecast, by Application 2020 & 2033
- Table 34: North Africa Rear Axle Commodity Revenue (billion) Forecast, by Application 2020 & 2033
- Table 35: South Africa Rear Axle Commodity Revenue (billion) Forecast, by Application 2020 & 2033
- Table 36: Rest of Middle East & Africa Rear Axle Commodity Revenue (billion) Forecast, by Application 2020 & 2033
- Table 37: Global Rear Axle Commodity Revenue billion Forecast, by Application 2020 & 2033
- Table 38: Global Rear Axle Commodity Revenue billion Forecast, by Types 2020 & 2033
- Table 39: Global Rear Axle Commodity Revenue billion Forecast, by Country 2020 & 2033
- Table 40: China Rear Axle Commodity Revenue (billion) Forecast, by Application 2020 & 2033
- Table 41: India Rear Axle Commodity Revenue (billion) Forecast, by Application 2020 & 2033
- Table 42: Japan Rear Axle Commodity Revenue (billion) Forecast, by Application 2020 & 2033
- Table 43: South Korea Rear Axle Commodity Revenue (billion) Forecast, by Application 2020 & 2033
- Table 44: ASEAN Rear Axle Commodity Revenue (billion) Forecast, by Application 2020 & 2033
- Table 45: Oceania Rear Axle Commodity Revenue (billion) Forecast, by Application 2020 & 2033
- Table 46: Rest of Asia Pacific Rear Axle Commodity Revenue (billion) Forecast, by Application 2020 & 2033
Frequently Asked Questions
1. What is the projected Compound Annual Growth Rate (CAGR) of the Rear Axle Commodity?
The projected CAGR is approximately 8.18%.
2. Which companies are prominent players in the Rear Axle Commodity?
Key companies in the market include Meritor, American Axle Manufacturing, DANA, ZF, PRESS KOGYO, HANDE Axle, BENTELER, Sichuan Jian’an, KOFCO, Gestamp, Shandong Heavy Industry, Hyundai, Magneti Marelli, SINOTRUK, SAF-HOLLAND, SG Automotive, IJT Technology, ROCKWELL.
3. What are the main segments of the Rear Axle Commodity?
The market segments include Application, Types.
4. Can you provide details about the market size?
The market size is estimated to be USD 13.05 billion as of 2022.
5. What are some drivers contributing to market growth?
N/A
6. What are the notable trends driving market growth?
N/A
7. Are there any restraints impacting market growth?
N/A
8. Can you provide examples of recent developments in the market?
N/A
9. What pricing options are available for accessing the report?
Pricing options include single-user, multi-user, and enterprise licenses priced at USD 2900.00, USD 4350.00, and USD 5800.00 respectively.
10. Is the market size provided in terms of value or volume?
The market size is provided in terms of value, measured in billion.
11. Are there any specific market keywords associated with the report?
Yes, the market keyword associated with the report is "Rear Axle Commodity," which aids in identifying and referencing the specific market segment covered.
12. How do I determine which pricing option suits my needs best?
The pricing options vary based on user requirements and access needs. Individual users may opt for single-user licenses, while businesses requiring broader access may choose multi-user or enterprise licenses for cost-effective access to the report.
13. Are there any additional resources or data provided in the Rear Axle Commodity report?
While the report offers comprehensive insights, it's advisable to review the specific contents or supplementary materials provided to ascertain if additional resources or data are available.
14. How can I stay updated on further developments or reports in the Rear Axle Commodity?
To stay informed about further developments, trends, and reports in the Rear Axle Commodity, consider subscribing to industry newsletters, following relevant companies and organizations, or regularly checking reputable industry news sources and publications.
Methodology
Step 1 - Identification of Relevant Samples Size from Population Database


Step 2 - Approaches for Defining Global Market Size (Value, Volume* & Price*)

Note*: In applicable scenarios
Step 3 - Data Sources
Primary Research
- Web Analytics
- Survey Reports
- Research Institute
- Latest Research Reports
- Opinion Leaders
Secondary Research
- Annual Reports
- White Paper
- Latest Press Release
- Industry Association
- Paid Database
- Investor Presentations

Step 4 - Data Triangulation
Involves using different sources of information in order to increase the validity of a study
These sources are likely to be stakeholders in a program - participants, other researchers, program staff, other community members, and so on.
Then we put all data in single framework & apply various statistical tools to find out the dynamic on the market.
During the analysis stage, feedback from the stakeholder groups would be compared to determine areas of agreement as well as areas of divergence