

Key Insights
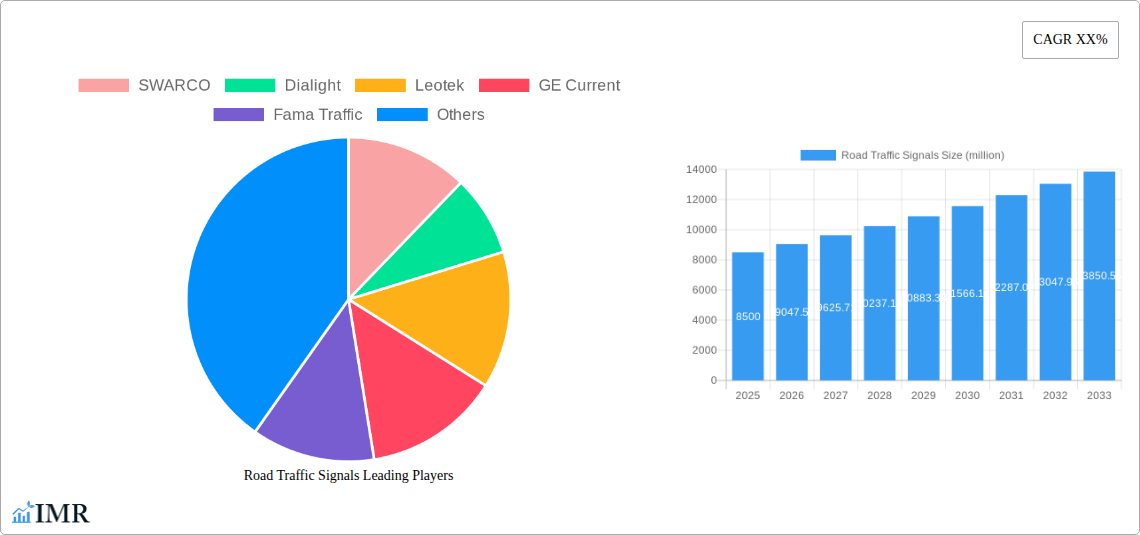
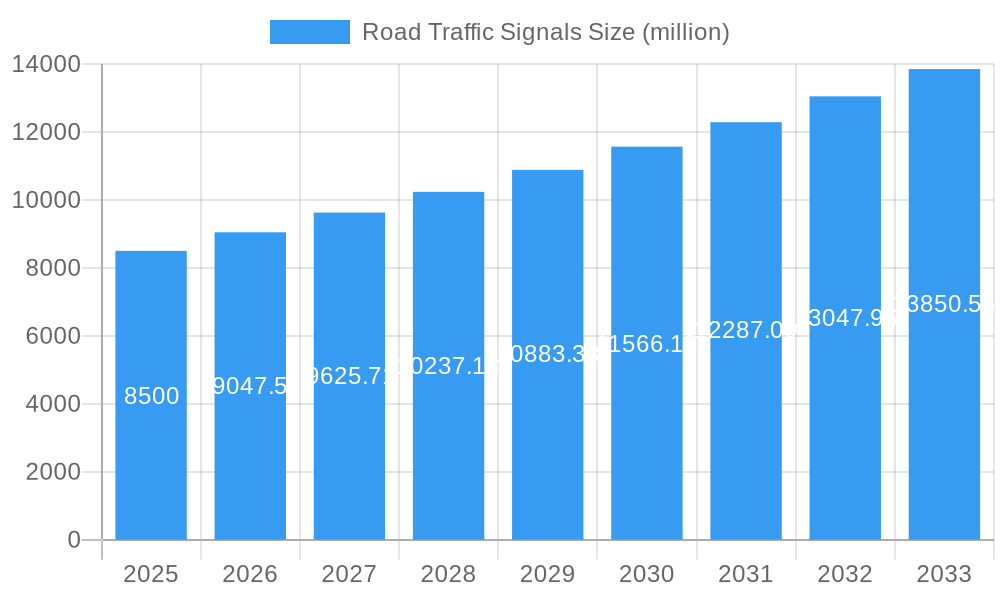
The global road traffic signals market is poised for significant expansion, projected to reach a substantial market size of approximately $8,500 million by 2025. This growth is fueled by a Compound Annual Growth Rate (CAGR) of around 6.5% during the forecast period of 2025-2033. The increasing demand for enhanced road safety, coupled with the ongoing urbanization and infrastructure development worldwide, are the primary drivers. Governments and municipalities are actively investing in smart city initiatives and modernizing traffic management systems to alleviate congestion and reduce accidents. The transition from traditional incandescent signals to energy-efficient and more durable LED signals is a dominant trend, offering better visibility, lower maintenance costs, and longer lifespans. This technological shift is a key factor in the market's upward trajectory.
Road Traffic Signals Market Size (In Billion)
Despite the robust growth, certain restraints exist, including the initial high cost of implementing advanced smart traffic signal systems and potential challenges in integrating new technologies with existing legacy infrastructure. However, the long-term benefits of improved traffic flow, reduced emissions, and enhanced public safety are expected to outweigh these short-term hurdles. The market is segmented by application into Urban Roads, Rural Roads, and Others, with Urban Roads currently dominating due to higher traffic density and the imperative for efficient management. By type, Ordinary Signals and LED Signals are the main categories, with LED Signals experiencing rapid adoption. Geographically, Asia Pacific is expected to be a leading region, driven by rapid industrialization and massive infrastructure projects in countries like China and India. North America and Europe also represent significant markets, driven by smart city investments and stringent road safety regulations.
Road Traffic Signals Company Market Share
This in-depth report offers a detailed examination of the global Road Traffic Signals market, providing critical insights into market dynamics, growth trends, regional dominance, product innovations, key drivers, barriers, opportunities, and the competitive landscape. With a study period spanning from 2019 to 2033, and a base year of 2025, this report is an essential resource for industry stakeholders seeking to understand and capitalize on the evolving road traffic signal ecosystem.
Road Traffic Signals Market Dynamics & Structure
The global Road Traffic Signals market is characterized by a moderate concentration, with a few key players holding significant market share. Technological innovation is a primary driver, fueled by the increasing demand for smart city infrastructure and enhanced traffic management systems. Regulatory frameworks, often driven by public safety and environmental concerns, play a crucial role in shaping product development and deployment. Competitive product substitutes are emerging, particularly with the integration of advanced sensors and AI-powered traffic management solutions, though traditional signals remain dominant. End-user demographics are diverse, ranging from municipal transportation authorities to private infrastructure developers. Mergers and acquisitions (M&A) are becoming more prevalent as companies seek to expand their technological capabilities and geographical reach.
- Market Concentration: Top 5 players hold an estimated 60% of the market share.
- Technological Innovation Drivers:
- Development of energy-efficient LED signals.
- Integration of connectivity and IoT for real-time traffic monitoring.
- Advancements in adaptive traffic control systems.
- Regulatory Frameworks: Mandates for energy efficiency and safety compliance.
- Competitive Product Substitutes: Advanced sensor networks, AI-driven traffic optimization platforms.
- End-User Demographics: Government transportation agencies, urban planners, construction firms.
- M&A Trends: Companies are acquiring technology startups to enhance smart city offerings. The number of M&A deals in the past three years is projected at 25 million units.
Road Traffic Signals Growth Trends & Insights
The global Road Traffic Signals market is poised for robust growth, driven by an escalating need for efficient traffic management solutions in rapidly urbanizing areas. The market size is projected to reach $15,500 million by 2033, exhibiting a Compound Annual Growth Rate (CAGR) of approximately 7.8% during the forecast period. Adoption rates for advanced LED signals are soaring due to their superior energy efficiency, longer lifespan, and enhanced visibility compared to traditional incandescent signals. Technological disruptions, including the rise of connected and autonomous vehicles, are compelling traffic authorities to upgrade existing signal infrastructure to support Vehicle-to-Everything (V2X) communication. Consumer behavior is shifting towards prioritizing road safety and seamless traffic flow, further stimulating investment in modern traffic signal systems. The market penetration of smart traffic signals is expected to double by 2030. The transition from older signal technologies to more advanced, data-driven solutions is a significant trend.
Dominant Regions, Countries, or Segments in Road Traffic Signals
The Urban Road application segment is the leading driver of growth in the global Road Traffic Signals market, accounting for an estimated 70% of the total market share. This dominance is primarily attributed to the increasing urbanization worldwide, leading to higher traffic congestion and a greater demand for sophisticated traffic management solutions. Asia Pacific, particularly China and India, represents a significant growth hub due to substantial government investments in infrastructure development and smart city initiatives. North America and Europe also remain mature markets with a continuous focus on upgrading existing infrastructure and implementing intelligent transportation systems.
Dominant Segment: Urban Road Application
- Key Drivers:
- Rapid urbanization and population density.
- Government initiatives for smart city development and traffic decongestion.
- Increasing investments in public transportation and traffic management infrastructure.
- Higher accident rates in urban areas necessitate improved safety signaling.
- Market Share: Urban Road application segment is estimated to hold $10,850 million in 2025.
- Growth Potential: Expected to witness sustained high growth due to ongoing urban expansion and technological advancements.
- Key Drivers:
Dominant Type: LED Signals
- Key Drivers:
- Significant energy savings compared to ordinary signals.
- Extended lifespan reducing maintenance costs.
- Superior visibility in various weather conditions and at different times of day.
- Compliance with environmental regulations and sustainability goals.
- Market Share: LED Signals are projected to capture 85% of the market by 2033.
- Growth Potential: Continuous innovation in LED technology, including dynamic signaling and integrated sensors, will fuel further growth.
- Key Drivers:
Road Traffic Signals Product Landscape
The Road Traffic Signals product landscape is defined by increasing integration of smart technologies and a focus on energy efficiency. Innovations include the development of LED signals with enhanced brightness, durability, and wider viewing angles. Advanced features such as integrated countdown timers, pedestrian push buttons with accessibility features, and dynamic signal phasing based on real-time traffic data are becoming standard. The market is witnessing a trend towards modular and scalable signal systems that can be easily upgraded and maintained. Unique selling propositions often revolve around reduced power consumption, extended product life, and sophisticated control capabilities, driving significant improvements in traffic flow and safety.
Key Drivers, Barriers & Challenges in Road Traffic Signals
Key Drivers: The Road Traffic Signals market is propelled by a confluence of factors. Smart city initiatives worldwide are a primary catalyst, demanding integrated traffic management solutions. Increasing global vehicle populations and the resulting congestion necessitate efficient signaling systems. Government mandates for road safety and energy efficiency are also driving adoption of advanced LED and intelligent signals. Technological advancements in IoT, AI, and V2X communication are creating new opportunities for sophisticated traffic control.
Barriers & Challenges: Despite its growth potential, the market faces significant challenges. High initial investment costs for advanced signal systems can be a barrier for smaller municipalities. Regulatory hurdles and slow adoption rates by some government bodies can impede deployment. Cybersecurity concerns associated with connected traffic systems pose a risk. Supply chain disruptions, particularly for electronic components, can impact manufacturing and delivery. Furthermore, legacy infrastructure that requires extensive retrofitting presents a considerable challenge. The estimated impact of supply chain issues on the market in the past two years is $300 million.
Emerging Opportunities in Road Traffic Signals
Emerging opportunities lie in the integration of AI-powered predictive traffic management that can anticipate congestion and optimize signal timings proactively. The growing demand for autonomous vehicle infrastructure presents a significant avenue, requiring signals capable of seamless V2X communication. Smart pedestrian and cyclist detection systems embedded within signals offer enhanced safety. Furthermore, the expansion of digital signage and variable message signs integrated with traffic signal networks provides real-time traveler information. Untapped markets in developing economies with rapidly expanding urban areas also represent substantial growth potential.
Growth Accelerators in the Road Traffic Signals Industry
Growth in the Road Traffic Signals industry is significantly accelerated by strategic partnerships between technology providers and municipal authorities. Technological breakthroughs in sensor integration and data analytics are enabling more dynamic and responsive traffic management. Government investments in smart city infrastructure and the drive for sustainable transportation solutions are creating a fertile ground for innovation and market expansion. The increasing awareness and demand for improved road safety and reduced travel times further fuel this growth.
Key Players Shaping the Road Traffic Signals Market
- SWARCO
- Dialight
- Leotek
- GE Current
- Fama Traffic
- Traffic Technologies
- Anbang Electric
- Sinowatcher Technology
- Econolite Group
- WERMA
- Jingan
- Trafitronics India
Notable Milestones in Road Traffic Signals Sector
- 2019: Introduction of advanced AI algorithms for adaptive traffic control by leading companies.
- 2020: Increased adoption of energy-efficient LED signals driven by environmental regulations.
- 2021: Significant investments in smart city infrastructure projects globally, boosting demand for connected traffic signals.
- 2022: Development of V2X-enabled traffic signals to support autonomous vehicle integration.
- 2023: Growing focus on cybersecurity solutions for traffic signal networks.
- 2024: Enhanced integration of pedestrian and cyclist safety features within traffic signal units.
In-Depth Road Traffic Signals Market Outlook
The future of the Road Traffic Signals market is exceptionally promising, driven by an unstoppable momentum towards smarter, safer, and more sustainable urban mobility. The ongoing expansion of smart city ecosystems, coupled with increasing global vehicle density, will continue to fuel demand for advanced traffic management solutions. The critical role of these signals in supporting the integration of autonomous vehicles and enhancing overall road safety positions them as indispensable components of future transportation networks. Strategic market expansion into developing economies and continuous innovation in areas like AI-driven predictive control will be key to unlocking further growth potential.
Road Traffic Signals Segmentation
-
1. Application
- 1.1. Urban Road
- 1.2. Rural Road
- 1.3. Others
-
2. Types
- 2.1. Ordinary Signals
- 2.2. LED Signals
Road Traffic Signals Segmentation By Geography
-
1. North America
- 1.1. United States
- 1.2. Canada
- 1.3. Mexico
-
2. South America
- 2.1. Brazil
- 2.2. Argentina
- 2.3. Rest of South America
-
3. Europe
- 3.1. United Kingdom
- 3.2. Germany
- 3.3. France
- 3.4. Italy
- 3.5. Spain
- 3.6. Russia
- 3.7. Benelux
- 3.8. Nordics
- 3.9. Rest of Europe
-
4. Middle East & Africa
- 4.1. Turkey
- 4.2. Israel
- 4.3. GCC
- 4.4. North Africa
- 4.5. South Africa
- 4.6. Rest of Middle East & Africa
-
5. Asia Pacific
- 5.1. China
- 5.2. India
- 5.3. Japan
- 5.4. South Korea
- 5.5. ASEAN
- 5.6. Oceania
- 5.7. Rest of Asia Pacific
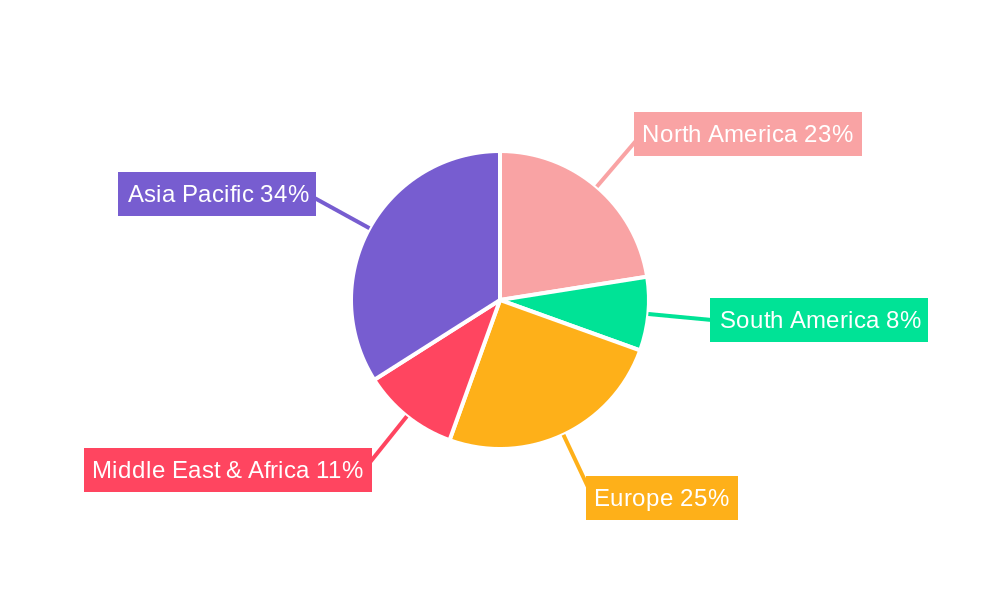
Road Traffic Signals Regional Market Share
Geographic Coverage of Road Traffic Signals
Road Traffic Signals REPORT HIGHLIGHTS
| Aspects | Details |
|---|---|
| Study Period | 2020-2034 |
| Base Year | 2025 |
| Estimated Year | 2026 |
| Forecast Period | 2026-2034 |
| Historical Period | 2020-2025 |
| Growth Rate | CAGR of 6.5% from 2020-2034 |
| Segmentation |
|
Table of Contents
- 1. Introduction
- 1.1. Research Scope
- 1.2. Market Segmentation
- 1.3. Research Objective
- 1.4. Definitions and Assumptions
- 2. Executive Summary
- 2.1. Market Snapshot
- 3. Market Dynamics
- 3.1. Market Drivers
- 3.2. Market Restrains
- 3.3. Market Trends
- 3.4. Market Opportunities
- 4. Market Factor Analysis
- 4.1. Porters Five Forces
- 4.1.1. Bargaining Power of Suppliers
- 4.1.2. Bargaining Power of Buyers
- 4.1.3. Threat of New Entrants
- 4.1.4. Threat of Substitutes
- 4.1.5. Competitive Rivalry
- 4.2. PESTEL analysis
- 4.3. BCG Analysis
- 4.3.1. Stars (High Growth, High Market Share)
- 4.3.2. Cash Cows (Low Growth, High Market Share)
- 4.3.3. Question Mark (High Growth, Low Market Share)
- 4.3.4. Dogs (Low Growth, Low Market Share)
- 4.4. Ansoff Matrix Analysis
- 4.5. Supply Chain Analysis
- 4.6. Regulatory Landscape
- 4.7. Current Market Potential and Opportunity Assessment (TAM–SAM–SOM Framework)
- 4.8. IMR Analyst Note
- 4.1. Porters Five Forces
- 5. Market Analysis, Insights and Forecast 2021-2033
- 5.1. Market Analysis, Insights and Forecast - by Application
- 5.1.1. Urban Road
- 5.1.2. Rural Road
- 5.1.3. Others
- 5.2. Market Analysis, Insights and Forecast - by Types
- 5.2.1. Ordinary Signals
- 5.2.2. LED Signals
- 5.3. Market Analysis, Insights and Forecast - by Region
- 5.3.1. North America
- 5.3.2. South America
- 5.3.3. Europe
- 5.3.4. Middle East & Africa
- 5.3.5. Asia Pacific
- 5.1. Market Analysis, Insights and Forecast - by Application
- 6. Global Road Traffic Signals Analysis, Insights and Forecast, 2021-2033
- 6.1. Market Analysis, Insights and Forecast - by Application
- 6.1.1. Urban Road
- 6.1.2. Rural Road
- 6.1.3. Others
- 6.2. Market Analysis, Insights and Forecast - by Types
- 6.2.1. Ordinary Signals
- 6.2.2. LED Signals
- 6.1. Market Analysis, Insights and Forecast - by Application
- 7. North America Road Traffic Signals Analysis, Insights and Forecast, 2020-2032
- 7.1. Market Analysis, Insights and Forecast - by Application
- 7.1.1. Urban Road
- 7.1.2. Rural Road
- 7.1.3. Others
- 7.2. Market Analysis, Insights and Forecast - by Types
- 7.2.1. Ordinary Signals
- 7.2.2. LED Signals
- 7.1. Market Analysis, Insights and Forecast - by Application
- 8. South America Road Traffic Signals Analysis, Insights and Forecast, 2020-2032
- 8.1. Market Analysis, Insights and Forecast - by Application
- 8.1.1. Urban Road
- 8.1.2. Rural Road
- 8.1.3. Others
- 8.2. Market Analysis, Insights and Forecast - by Types
- 8.2.1. Ordinary Signals
- 8.2.2. LED Signals
- 8.1. Market Analysis, Insights and Forecast - by Application
- 9. Europe Road Traffic Signals Analysis, Insights and Forecast, 2020-2032
- 9.1. Market Analysis, Insights and Forecast - by Application
- 9.1.1. Urban Road
- 9.1.2. Rural Road
- 9.1.3. Others
- 9.2. Market Analysis, Insights and Forecast - by Types
- 9.2.1. Ordinary Signals
- 9.2.2. LED Signals
- 9.1. Market Analysis, Insights and Forecast - by Application
- 10. Middle East & Africa Road Traffic Signals Analysis, Insights and Forecast, 2020-2032
- 10.1. Market Analysis, Insights and Forecast - by Application
- 10.1.1. Urban Road
- 10.1.2. Rural Road
- 10.1.3. Others
- 10.2. Market Analysis, Insights and Forecast - by Types
- 10.2.1. Ordinary Signals
- 10.2.2. LED Signals
- 10.1. Market Analysis, Insights and Forecast - by Application
- 11. Asia Pacific Road Traffic Signals Analysis, Insights and Forecast, 2020-2032
- 11.1. Market Analysis, Insights and Forecast - by Application
- 11.1.1. Urban Road
- 11.1.2. Rural Road
- 11.1.3. Others
- 11.2. Market Analysis, Insights and Forecast - by Types
- 11.2.1. Ordinary Signals
- 11.2.2. LED Signals
- 11.1. Market Analysis, Insights and Forecast - by Application
- 12. Competitive Analysis
- 12.1. Company Profiles
- 12.1.1 SWARCO
- 12.1.1.1. Company Overview
- 12.1.1.2. Products
- 12.1.1.3. Company Financials
- 12.1.1.4. SWOT Analysis
- 12.1.2 Dialight
- 12.1.2.1. Company Overview
- 12.1.2.2. Products
- 12.1.2.3. Company Financials
- 12.1.2.4. SWOT Analysis
- 12.1.3 Leotek
- 12.1.3.1. Company Overview
- 12.1.3.2. Products
- 12.1.3.3. Company Financials
- 12.1.3.4. SWOT Analysis
- 12.1.4 GE Current
- 12.1.4.1. Company Overview
- 12.1.4.2. Products
- 12.1.4.3. Company Financials
- 12.1.4.4. SWOT Analysis
- 12.1.5 Fama Traffic
- 12.1.5.1. Company Overview
- 12.1.5.2. Products
- 12.1.5.3. Company Financials
- 12.1.5.4. SWOT Analysis
- 12.1.6 Traffic Technologies
- 12.1.6.1. Company Overview
- 12.1.6.2. Products
- 12.1.6.3. Company Financials
- 12.1.6.4. SWOT Analysis
- 12.1.7 Anbang Electric
- 12.1.7.1. Company Overview
- 12.1.7.2. Products
- 12.1.7.3. Company Financials
- 12.1.7.4. SWOT Analysis
- 12.1.8 Sinowatcher Technology
- 12.1.8.1. Company Overview
- 12.1.8.2. Products
- 12.1.8.3. Company Financials
- 12.1.8.4. SWOT Analysis
- 12.1.9 Econolite Group
- 12.1.9.1. Company Overview
- 12.1.9.2. Products
- 12.1.9.3. Company Financials
- 12.1.9.4. SWOT Analysis
- 12.1.10 WERMA
- 12.1.10.1. Company Overview
- 12.1.10.2. Products
- 12.1.10.3. Company Financials
- 12.1.10.4. SWOT Analysis
- 12.1.11 Jingan
- 12.1.11.1. Company Overview
- 12.1.11.2. Products
- 12.1.11.3. Company Financials
- 12.1.11.4. SWOT Analysis
- 12.1.12 Trafitronics India
- 12.1.12.1. Company Overview
- 12.1.12.2. Products
- 12.1.12.3. Company Financials
- 12.1.12.4. SWOT Analysis
- 12.1.1 SWARCO
- 12.2. Market Entropy
- 12.2.1 Company's Key Areas Served
- 12.2.2 Recent Developments
- 12.3. Company Market Share Analysis 2025
- 12.3.1 Top 5 Companies Market Share Analysis
- 12.3.2 Top 3 Companies Market Share Analysis
- 12.4. List of Potential Customers
- 13. Research Methodology
List of Figures
- Figure 1: Global Road Traffic Signals Revenue Breakdown (undefined, %) by Region 2025 & 2033
- Figure 2: Global Road Traffic Signals Volume Breakdown (K, %) by Region 2025 & 2033
- Figure 3: North America Road Traffic Signals Revenue (undefined), by Application 2025 & 2033
- Figure 4: North America Road Traffic Signals Volume (K), by Application 2025 & 2033
- Figure 5: North America Road Traffic Signals Revenue Share (%), by Application 2025 & 2033
- Figure 6: North America Road Traffic Signals Volume Share (%), by Application 2025 & 2033
- Figure 7: North America Road Traffic Signals Revenue (undefined), by Types 2025 & 2033
- Figure 8: North America Road Traffic Signals Volume (K), by Types 2025 & 2033
- Figure 9: North America Road Traffic Signals Revenue Share (%), by Types 2025 & 2033
- Figure 10: North America Road Traffic Signals Volume Share (%), by Types 2025 & 2033
- Figure 11: North America Road Traffic Signals Revenue (undefined), by Country 2025 & 2033
- Figure 12: North America Road Traffic Signals Volume (K), by Country 2025 & 2033
- Figure 13: North America Road Traffic Signals Revenue Share (%), by Country 2025 & 2033
- Figure 14: North America Road Traffic Signals Volume Share (%), by Country 2025 & 2033
- Figure 15: South America Road Traffic Signals Revenue (undefined), by Application 2025 & 2033
- Figure 16: South America Road Traffic Signals Volume (K), by Application 2025 & 2033
- Figure 17: South America Road Traffic Signals Revenue Share (%), by Application 2025 & 2033
- Figure 18: South America Road Traffic Signals Volume Share (%), by Application 2025 & 2033
- Figure 19: South America Road Traffic Signals Revenue (undefined), by Types 2025 & 2033
- Figure 20: South America Road Traffic Signals Volume (K), by Types 2025 & 2033
- Figure 21: South America Road Traffic Signals Revenue Share (%), by Types 2025 & 2033
- Figure 22: South America Road Traffic Signals Volume Share (%), by Types 2025 & 2033
- Figure 23: South America Road Traffic Signals Revenue (undefined), by Country 2025 & 2033
- Figure 24: South America Road Traffic Signals Volume (K), by Country 2025 & 2033
- Figure 25: South America Road Traffic Signals Revenue Share (%), by Country 2025 & 2033
- Figure 26: South America Road Traffic Signals Volume Share (%), by Country 2025 & 2033
- Figure 27: Europe Road Traffic Signals Revenue (undefined), by Application 2025 & 2033
- Figure 28: Europe Road Traffic Signals Volume (K), by Application 2025 & 2033
- Figure 29: Europe Road Traffic Signals Revenue Share (%), by Application 2025 & 2033
- Figure 30: Europe Road Traffic Signals Volume Share (%), by Application 2025 & 2033
- Figure 31: Europe Road Traffic Signals Revenue (undefined), by Types 2025 & 2033
- Figure 32: Europe Road Traffic Signals Volume (K), by Types 2025 & 2033
- Figure 33: Europe Road Traffic Signals Revenue Share (%), by Types 2025 & 2033
- Figure 34: Europe Road Traffic Signals Volume Share (%), by Types 2025 & 2033
- Figure 35: Europe Road Traffic Signals Revenue (undefined), by Country 2025 & 2033
- Figure 36: Europe Road Traffic Signals Volume (K), by Country 2025 & 2033
- Figure 37: Europe Road Traffic Signals Revenue Share (%), by Country 2025 & 2033
- Figure 38: Europe Road Traffic Signals Volume Share (%), by Country 2025 & 2033
- Figure 39: Middle East & Africa Road Traffic Signals Revenue (undefined), by Application 2025 & 2033
- Figure 40: Middle East & Africa Road Traffic Signals Volume (K), by Application 2025 & 2033
- Figure 41: Middle East & Africa Road Traffic Signals Revenue Share (%), by Application 2025 & 2033
- Figure 42: Middle East & Africa Road Traffic Signals Volume Share (%), by Application 2025 & 2033
- Figure 43: Middle East & Africa Road Traffic Signals Revenue (undefined), by Types 2025 & 2033
- Figure 44: Middle East & Africa Road Traffic Signals Volume (K), by Types 2025 & 2033
- Figure 45: Middle East & Africa Road Traffic Signals Revenue Share (%), by Types 2025 & 2033
- Figure 46: Middle East & Africa Road Traffic Signals Volume Share (%), by Types 2025 & 2033
- Figure 47: Middle East & Africa Road Traffic Signals Revenue (undefined), by Country 2025 & 2033
- Figure 48: Middle East & Africa Road Traffic Signals Volume (K), by Country 2025 & 2033
- Figure 49: Middle East & Africa Road Traffic Signals Revenue Share (%), by Country 2025 & 2033
- Figure 50: Middle East & Africa Road Traffic Signals Volume Share (%), by Country 2025 & 2033
- Figure 51: Asia Pacific Road Traffic Signals Revenue (undefined), by Application 2025 & 2033
- Figure 52: Asia Pacific Road Traffic Signals Volume (K), by Application 2025 & 2033
- Figure 53: Asia Pacific Road Traffic Signals Revenue Share (%), by Application 2025 & 2033
- Figure 54: Asia Pacific Road Traffic Signals Volume Share (%), by Application 2025 & 2033
- Figure 55: Asia Pacific Road Traffic Signals Revenue (undefined), by Types 2025 & 2033
- Figure 56: Asia Pacific Road Traffic Signals Volume (K), by Types 2025 & 2033
- Figure 57: Asia Pacific Road Traffic Signals Revenue Share (%), by Types 2025 & 2033
- Figure 58: Asia Pacific Road Traffic Signals Volume Share (%), by Types 2025 & 2033
- Figure 59: Asia Pacific Road Traffic Signals Revenue (undefined), by Country 2025 & 2033
- Figure 60: Asia Pacific Road Traffic Signals Volume (K), by Country 2025 & 2033
- Figure 61: Asia Pacific Road Traffic Signals Revenue Share (%), by Country 2025 & 2033
- Figure 62: Asia Pacific Road Traffic Signals Volume Share (%), by Country 2025 & 2033
List of Tables
- Table 1: Global Road Traffic Signals Revenue undefined Forecast, by Application 2020 & 2033
- Table 2: Global Road Traffic Signals Volume K Forecast, by Application 2020 & 2033
- Table 3: Global Road Traffic Signals Revenue undefined Forecast, by Types 2020 & 2033
- Table 4: Global Road Traffic Signals Volume K Forecast, by Types 2020 & 2033
- Table 5: Global Road Traffic Signals Revenue undefined Forecast, by Region 2020 & 2033
- Table 6: Global Road Traffic Signals Volume K Forecast, by Region 2020 & 2033
- Table 7: Global Road Traffic Signals Revenue undefined Forecast, by Application 2020 & 2033
- Table 8: Global Road Traffic Signals Volume K Forecast, by Application 2020 & 2033
- Table 9: Global Road Traffic Signals Revenue undefined Forecast, by Types 2020 & 2033
- Table 10: Global Road Traffic Signals Volume K Forecast, by Types 2020 & 2033
- Table 11: Global Road Traffic Signals Revenue undefined Forecast, by Country 2020 & 2033
- Table 12: Global Road Traffic Signals Volume K Forecast, by Country 2020 & 2033
- Table 13: United States Road Traffic Signals Revenue (undefined) Forecast, by Application 2020 & 2033
- Table 14: United States Road Traffic Signals Volume (K) Forecast, by Application 2020 & 2033
- Table 15: Canada Road Traffic Signals Revenue (undefined) Forecast, by Application 2020 & 2033
- Table 16: Canada Road Traffic Signals Volume (K) Forecast, by Application 2020 & 2033
- Table 17: Mexico Road Traffic Signals Revenue (undefined) Forecast, by Application 2020 & 2033
- Table 18: Mexico Road Traffic Signals Volume (K) Forecast, by Application 2020 & 2033
- Table 19: Global Road Traffic Signals Revenue undefined Forecast, by Application 2020 & 2033
- Table 20: Global Road Traffic Signals Volume K Forecast, by Application 2020 & 2033
- Table 21: Global Road Traffic Signals Revenue undefined Forecast, by Types 2020 & 2033
- Table 22: Global Road Traffic Signals Volume K Forecast, by Types 2020 & 2033
- Table 23: Global Road Traffic Signals Revenue undefined Forecast, by Country 2020 & 2033
- Table 24: Global Road Traffic Signals Volume K Forecast, by Country 2020 & 2033
- Table 25: Brazil Road Traffic Signals Revenue (undefined) Forecast, by Application 2020 & 2033
- Table 26: Brazil Road Traffic Signals Volume (K) Forecast, by Application 2020 & 2033
- Table 27: Argentina Road Traffic Signals Revenue (undefined) Forecast, by Application 2020 & 2033
- Table 28: Argentina Road Traffic Signals Volume (K) Forecast, by Application 2020 & 2033
- Table 29: Rest of South America Road Traffic Signals Revenue (undefined) Forecast, by Application 2020 & 2033
- Table 30: Rest of South America Road Traffic Signals Volume (K) Forecast, by Application 2020 & 2033
- Table 31: Global Road Traffic Signals Revenue undefined Forecast, by Application 2020 & 2033
- Table 32: Global Road Traffic Signals Volume K Forecast, by Application 2020 & 2033
- Table 33: Global Road Traffic Signals Revenue undefined Forecast, by Types 2020 & 2033
- Table 34: Global Road Traffic Signals Volume K Forecast, by Types 2020 & 2033
- Table 35: Global Road Traffic Signals Revenue undefined Forecast, by Country 2020 & 2033
- Table 36: Global Road Traffic Signals Volume K Forecast, by Country 2020 & 2033
- Table 37: United Kingdom Road Traffic Signals Revenue (undefined) Forecast, by Application 2020 & 2033
- Table 38: United Kingdom Road Traffic Signals Volume (K) Forecast, by Application 2020 & 2033
- Table 39: Germany Road Traffic Signals Revenue (undefined) Forecast, by Application 2020 & 2033
- Table 40: Germany Road Traffic Signals Volume (K) Forecast, by Application 2020 & 2033
- Table 41: France Road Traffic Signals Revenue (undefined) Forecast, by Application 2020 & 2033
- Table 42: France Road Traffic Signals Volume (K) Forecast, by Application 2020 & 2033
- Table 43: Italy Road Traffic Signals Revenue (undefined) Forecast, by Application 2020 & 2033
- Table 44: Italy Road Traffic Signals Volume (K) Forecast, by Application 2020 & 2033
- Table 45: Spain Road Traffic Signals Revenue (undefined) Forecast, by Application 2020 & 2033
- Table 46: Spain Road Traffic Signals Volume (K) Forecast, by Application 2020 & 2033
- Table 47: Russia Road Traffic Signals Revenue (undefined) Forecast, by Application 2020 & 2033
- Table 48: Russia Road Traffic Signals Volume (K) Forecast, by Application 2020 & 2033
- Table 49: Benelux Road Traffic Signals Revenue (undefined) Forecast, by Application 2020 & 2033
- Table 50: Benelux Road Traffic Signals Volume (K) Forecast, by Application 2020 & 2033
- Table 51: Nordics Road Traffic Signals Revenue (undefined) Forecast, by Application 2020 & 2033
- Table 52: Nordics Road Traffic Signals Volume (K) Forecast, by Application 2020 & 2033
- Table 53: Rest of Europe Road Traffic Signals Revenue (undefined) Forecast, by Application 2020 & 2033
- Table 54: Rest of Europe Road Traffic Signals Volume (K) Forecast, by Application 2020 & 2033
- Table 55: Global Road Traffic Signals Revenue undefined Forecast, by Application 2020 & 2033
- Table 56: Global Road Traffic Signals Volume K Forecast, by Application 2020 & 2033
- Table 57: Global Road Traffic Signals Revenue undefined Forecast, by Types 2020 & 2033
- Table 58: Global Road Traffic Signals Volume K Forecast, by Types 2020 & 2033
- Table 59: Global Road Traffic Signals Revenue undefined Forecast, by Country 2020 & 2033
- Table 60: Global Road Traffic Signals Volume K Forecast, by Country 2020 & 2033
- Table 61: Turkey Road Traffic Signals Revenue (undefined) Forecast, by Application 2020 & 2033
- Table 62: Turkey Road Traffic Signals Volume (K) Forecast, by Application 2020 & 2033
- Table 63: Israel Road Traffic Signals Revenue (undefined) Forecast, by Application 2020 & 2033
- Table 64: Israel Road Traffic Signals Volume (K) Forecast, by Application 2020 & 2033
- Table 65: GCC Road Traffic Signals Revenue (undefined) Forecast, by Application 2020 & 2033
- Table 66: GCC Road Traffic Signals Volume (K) Forecast, by Application 2020 & 2033
- Table 67: North Africa Road Traffic Signals Revenue (undefined) Forecast, by Application 2020 & 2033
- Table 68: North Africa Road Traffic Signals Volume (K) Forecast, by Application 2020 & 2033
- Table 69: South Africa Road Traffic Signals Revenue (undefined) Forecast, by Application 2020 & 2033
- Table 70: South Africa Road Traffic Signals Volume (K) Forecast, by Application 2020 & 2033
- Table 71: Rest of Middle East & Africa Road Traffic Signals Revenue (undefined) Forecast, by Application 2020 & 2033
- Table 72: Rest of Middle East & Africa Road Traffic Signals Volume (K) Forecast, by Application 2020 & 2033
- Table 73: Global Road Traffic Signals Revenue undefined Forecast, by Application 2020 & 2033
- Table 74: Global Road Traffic Signals Volume K Forecast, by Application 2020 & 2033
- Table 75: Global Road Traffic Signals Revenue undefined Forecast, by Types 2020 & 2033
- Table 76: Global Road Traffic Signals Volume K Forecast, by Types 2020 & 2033
- Table 77: Global Road Traffic Signals Revenue undefined Forecast, by Country 2020 & 2033
- Table 78: Global Road Traffic Signals Volume K Forecast, by Country 2020 & 2033
- Table 79: China Road Traffic Signals Revenue (undefined) Forecast, by Application 2020 & 2033
- Table 80: China Road Traffic Signals Volume (K) Forecast, by Application 2020 & 2033
- Table 81: India Road Traffic Signals Revenue (undefined) Forecast, by Application 2020 & 2033
- Table 82: India Road Traffic Signals Volume (K) Forecast, by Application 2020 & 2033
- Table 83: Japan Road Traffic Signals Revenue (undefined) Forecast, by Application 2020 & 2033
- Table 84: Japan Road Traffic Signals Volume (K) Forecast, by Application 2020 & 2033
- Table 85: South Korea Road Traffic Signals Revenue (undefined) Forecast, by Application 2020 & 2033
- Table 86: South Korea Road Traffic Signals Volume (K) Forecast, by Application 2020 & 2033
- Table 87: ASEAN Road Traffic Signals Revenue (undefined) Forecast, by Application 2020 & 2033
- Table 88: ASEAN Road Traffic Signals Volume (K) Forecast, by Application 2020 & 2033
- Table 89: Oceania Road Traffic Signals Revenue (undefined) Forecast, by Application 2020 & 2033
- Table 90: Oceania Road Traffic Signals Volume (K) Forecast, by Application 2020 & 2033
- Table 91: Rest of Asia Pacific Road Traffic Signals Revenue (undefined) Forecast, by Application 2020 & 2033
- Table 92: Rest of Asia Pacific Road Traffic Signals Volume (K) Forecast, by Application 2020 & 2033
Frequently Asked Questions
1. What is the projected Compound Annual Growth Rate (CAGR) of the Road Traffic Signals?
The projected CAGR is approximately 6.5%.
2. Which companies are prominent players in the Road Traffic Signals?
Key companies in the market include SWARCO, Dialight, Leotek, GE Current, Fama Traffic, Traffic Technologies, Anbang Electric, Sinowatcher Technology, Econolite Group, WERMA, Jingan, Trafitronics India.
3. What are the main segments of the Road Traffic Signals?
The market segments include Application, Types.
4. Can you provide details about the market size?
The market size is estimated to be USD XXX N/A as of 2022.
5. What are some drivers contributing to market growth?
N/A
6. What are the notable trends driving market growth?
N/A
7. Are there any restraints impacting market growth?
N/A
8. Can you provide examples of recent developments in the market?
N/A
9. What pricing options are available for accessing the report?
Pricing options include single-user, multi-user, and enterprise licenses priced at USD 3350.00, USD 5025.00, and USD 6700.00 respectively.
10. Is the market size provided in terms of value or volume?
The market size is provided in terms of value, measured in N/A and volume, measured in K.
11. Are there any specific market keywords associated with the report?
Yes, the market keyword associated with the report is "Road Traffic Signals," which aids in identifying and referencing the specific market segment covered.
12. How do I determine which pricing option suits my needs best?
The pricing options vary based on user requirements and access needs. Individual users may opt for single-user licenses, while businesses requiring broader access may choose multi-user or enterprise licenses for cost-effective access to the report.
13. Are there any additional resources or data provided in the Road Traffic Signals report?
While the report offers comprehensive insights, it's advisable to review the specific contents or supplementary materials provided to ascertain if additional resources or data are available.
14. How can I stay updated on further developments or reports in the Road Traffic Signals?
To stay informed about further developments, trends, and reports in the Road Traffic Signals, consider subscribing to industry newsletters, following relevant companies and organizations, or regularly checking reputable industry news sources and publications.
Methodology
Step 1 - Identification of Relevant Samples Size from Population Database


Step 2 - Approaches for Defining Global Market Size (Value, Volume* & Price*)

Note*: In applicable scenarios
Step 3 - Data Sources
Primary Research
- Web Analytics
- Survey Reports
- Research Institute
- Latest Research Reports
- Opinion Leaders
Secondary Research
- Annual Reports
- White Paper
- Latest Press Release
- Industry Association
- Paid Database
- Investor Presentations

Step 4 - Data Triangulation
Involves using different sources of information in order to increase the validity of a study
These sources are likely to be stakeholders in a program - participants, other researchers, program staff, other community members, and so on.
Then we put all data in single framework & apply various statistical tools to find out the dynamic on the market.
During the analysis stage, feedback from the stakeholder groups would be compared to determine areas of agreement as well as areas of divergence