

Key Insights
The simulated driving simulator market is experiencing robust growth, driven by the increasing demand for advanced driver-assistance systems (ADAS) and autonomous vehicle (AV) development. The automotive industry's relentless pursuit of enhanced safety features and improved vehicle performance fuels the adoption of these simulators for testing and validation purposes. Furthermore, the rising need for cost-effective and efficient training programs for professional drivers, such as truck drivers and race car drivers, contributes significantly to market expansion. The market is segmented by type (hardware-in-the-loop, software-in-the-loop, and others), application (vehicle dynamics, ADAS testing, driver training, and others), and region. Leading players are continually investing in research and development to enhance simulator capabilities, focusing on features like realistic environments, haptic feedback, and advanced simulation software. This innovation is crucial for meeting the growing sophistication of autonomous driving technologies and regulatory requirements.
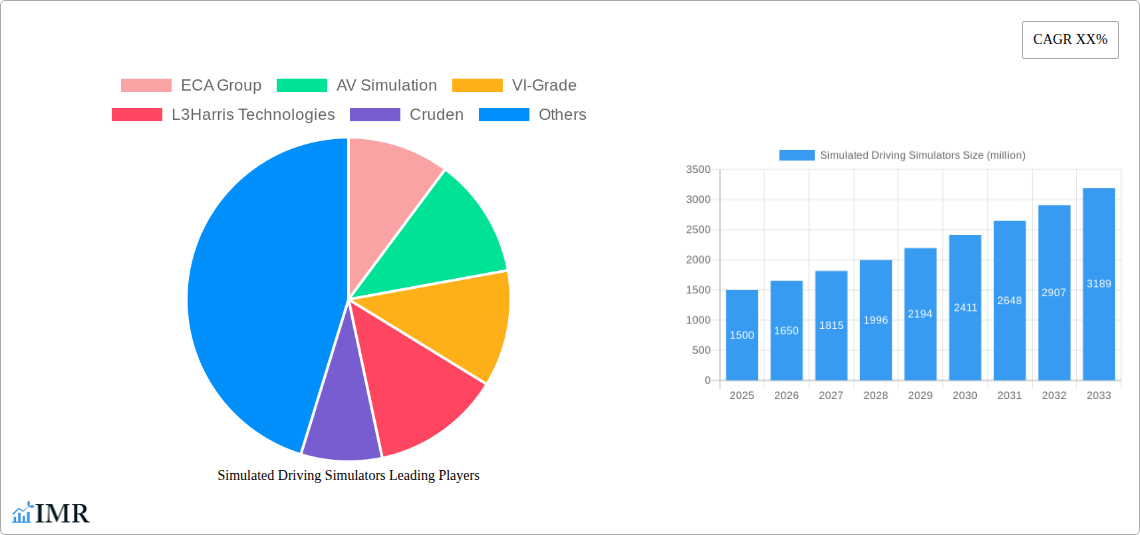
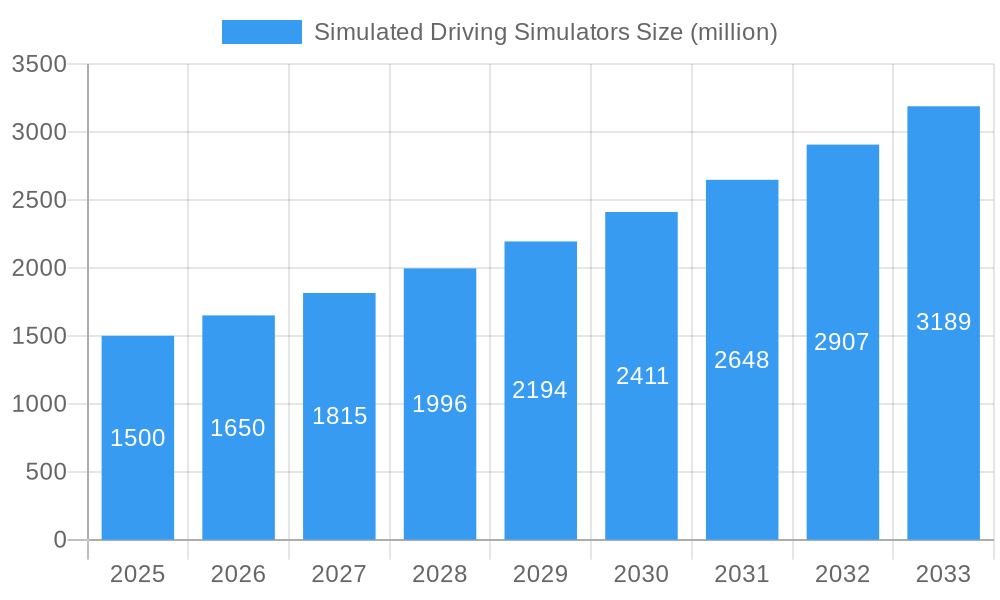
Simulated Driving Simulators Market Size (In Billion)
The market's growth trajectory is projected to remain positive throughout the forecast period (2025-2033), although the pace of expansion may fluctuate depending on economic conditions and technological advancements. Factors such as high initial investment costs for advanced simulators and the need for specialized technical expertise could potentially restrain market growth. However, the continuous evolution of simulation technologies and the increasing adoption of cloud-based solutions are expected to mitigate these challenges. The competitive landscape is characterized by a mix of established players and emerging companies, leading to a dynamic environment with ongoing innovation and consolidation. The geographical distribution of the market is expected to see significant growth in Asia-Pacific, driven by the rapid expansion of the automotive industry in this region.
Simulated Driving Simulators Company Market Share
Simulated Driving Simulators Market Report: 2019-2033
This comprehensive report provides a detailed analysis of the Simulated Driving Simulators market, encompassing market dynamics, growth trends, regional dominance, product landscape, and key players. The study period covers 2019-2033, with 2025 serving as the base and estimated year. The forecast period spans 2025-2033, and the historical period covers 2019-2024. This report is crucial for industry professionals, investors, and stakeholders seeking to understand the current market landscape and future trajectory of this rapidly evolving sector. The market is segmented by product type (fixed-base simulators, motion-platform simulators, driving simulators for specific purposes like military, etc.) and end-users (automotive manufacturers, driving schools, research institutes, etc.). The parent market is the broader simulator market while the child market is focused on the driving simulator applications. The global market size was valued at $xx million in 2024 and is projected to reach $xx million by 2033, exhibiting a CAGR of xx%.
Simulated Driving Simulators Market Dynamics & Structure
The simulated driving simulators market is characterized by moderate concentration, with several key players holding significant market share. Technological innovation, particularly in areas like haptic feedback, AI-driven scenarios, and VR integration, is a major driver. Stringent safety regulations and standardization efforts across regions influence market growth. Competitive substitutes include real-world driving tests and other training methods, but simulators offer significant cost and safety advantages. The end-user demographic encompasses automotive manufacturers, driving schools, research institutions, and military organizations. M&A activity has been relatively moderate in recent years, with xx major deals recorded between 2019 and 2024.
- Market Concentration: Moderately concentrated, with top 5 players holding approximately xx% market share in 2024.
- Technological Innovation: Advancements in graphics, haptic feedback, and AI-driven scenarios are key drivers.
- Regulatory Framework: Stringent safety and performance standards influence market dynamics.
- Competitive Substitutes: Real-world driving remains a substitute but simulators offer cost and safety benefits.
- End-User Demographics: Automotive, driving schools, research, and military sectors are major end-users.
- M&A Trends: xx major mergers and acquisitions between 2019 and 2024, indicating consolidation.
Simulated Driving Simulators Growth Trends & Insights
The simulated driving simulators market experienced robust growth during the historical period (2019-2024), driven by increasing demand from automotive manufacturers for advanced driver-assistance systems (ADAS) testing and training. The adoption rate has accelerated significantly in recent years, particularly among driving schools seeking to improve training efficiency and safety. Technological disruptions, such as the integration of virtual reality (VR) and augmented reality (AR) technologies, have expanded the capabilities and appeal of driving simulators. Shifts in consumer behavior, with an increased focus on safety and technological advancements, further fuel market growth. The market size is projected to reach $xx million by 2033, demonstrating a significant increase. This growth is driven by increasing demand for autonomous vehicle testing and a broader adoption of simulator-based training across multiple sectors.
Dominant Regions, Countries, or Segments in Simulated Driving Simulators
North America currently holds the largest market share, driven by strong demand from automotive manufacturers and a well-established automotive testing infrastructure. Europe follows closely, benefiting from similar factors and a focus on safety standards. The Asia-Pacific region is expected to witness the fastest growth rate over the forecast period due to rapid industrialization and the expansion of the automotive industry. Specific countries within these regions, such as Germany, the United States, Japan, and China, display significant market potential.
- North America: Dominant due to strong automotive sector and advanced testing infrastructure.
- Europe: High adoption rates driven by safety regulations and robust automotive industry.
- Asia-Pacific: Fastest-growing region, fueled by rapid industrialization and automotive expansion.
- Key Drivers: Government support for technological advancement and investment in infrastructure.
Simulated Driving Simulators Product Landscape
The product landscape is diverse, ranging from basic fixed-base simulators to sophisticated motion-platform systems offering highly realistic driving experiences. Simulators are tailored for specific applications, including ADAS testing, driver training, and research purposes. Key performance metrics include visual fidelity, haptic feedback accuracy, and the range of driving scenarios simulated. Unique selling propositions often focus on realism, customization options, and integrated data analysis capabilities. Recent advancements involve integrating AI for more dynamic and realistic simulations.
Key Drivers, Barriers & Challenges in Simulated Driving Simulators
Key Drivers: The rising demand for advanced driver-assistance systems (ADAS) testing, increasing adoption in driver training programs, and growth in autonomous vehicle development are key market drivers. Government regulations mandating simulator-based training also contribute significantly.
Challenges & Restraints: High initial investment costs, the need for specialized technical expertise for operation and maintenance, and the potential for simulator sickness limit adoption in certain segments. Competition from established players and the emergence of new technologies present further challenges. Supply chain disruptions can impact production and delivery timelines.
Emerging Opportunities in Simulated Driving Simulators
The integration of advanced AI algorithms is generating new opportunities for realistic and adaptive simulations. The expansion into new applications, such as virtual reality-based driving experiences for entertainment and the growing demand for customized and specialized simulators, are untapped avenues.
Growth Accelerators in the Simulated Driving Simulators Industry
Technological advancements, such as the incorporation of high-fidelity graphics, realistic haptic feedback, and AI-powered scenario generation, are accelerating market growth. Strategic partnerships between simulator manufacturers and automotive companies are enabling development of tailored solutions. Expanding into emerging markets, particularly in developing economies with growing automotive industries, presents significant opportunities.
Key Players Shaping the Simulated Driving Simulators Market
- ECA Group
- AV Simulation
- VI-Grade
- L3Harris Technologies
- Cruden
- Zen Technologies
- Ansible Motion
- XPI Simulation
- Virage Simulation
- AB Dynamics
- IPG Automotive
- AutoSim
- Tecknotrove System
- Tianjin Zhonggong Intelligent
- Beijing Ziguang Legacy Science and Education
- Beijing KingFar
- Fujian Couder Technology
- Shenzhen Zhongzhi Simulation
Notable Milestones in Simulated Driving Simulators Sector
- 2020: Introduction of high-fidelity haptic feedback systems by XPI Simulation.
- 2021: Partnership between VI-Grade and a major automotive manufacturer for ADAS testing.
- 2022: Launch of a new generation of motion-platform simulators by Cruden.
- 2023: Acquisition of a smaller simulator company by L3Harris Technologies.
- 2024: Development of advanced AI-powered scenario generation technology by IPG Automotive.
In-Depth Simulated Driving Simulators Market Outlook
The future of the simulated driving simulators market is promising, driven by continuous technological innovation, increasing adoption across various sectors, and the expanding demand for autonomous vehicle testing. Strategic partnerships and market expansion initiatives will play key roles in shaping the market's future trajectory. The market is poised for strong growth, with substantial opportunities for both established players and new entrants.
Simulated Driving Simulators Segmentation
-
1. Application
- 1.1. Testing
- 1.2. Entertainment
- 1.3. Education
- 1.4. Others
-
2. Types
- 2.1. Truck Simulator
- 2.2. Bus Simulator
- 2.3. Others
Simulated Driving Simulators Segmentation By Geography
-
1. North America
- 1.1. United States
- 1.2. Canada
- 1.3. Mexico
-
2. South America
- 2.1. Brazil
- 2.2. Argentina
- 2.3. Rest of South America
-
3. Europe
- 3.1. United Kingdom
- 3.2. Germany
- 3.3. France
- 3.4. Italy
- 3.5. Spain
- 3.6. Russia
- 3.7. Benelux
- 3.8. Nordics
- 3.9. Rest of Europe
-
4. Middle East & Africa
- 4.1. Turkey
- 4.2. Israel
- 4.3. GCC
- 4.4. North Africa
- 4.5. South Africa
- 4.6. Rest of Middle East & Africa
-
5. Asia Pacific
- 5.1. China
- 5.2. India
- 5.3. Japan
- 5.4. South Korea
- 5.5. ASEAN
- 5.6. Oceania
- 5.7. Rest of Asia Pacific

Simulated Driving Simulators Regional Market Share
Geographic Coverage of Simulated Driving Simulators
Simulated Driving Simulators REPORT HIGHLIGHTS
| Aspects | Details |
|---|---|
| Study Period | 2020-2034 |
| Base Year | 2025 |
| Estimated Year | 2026 |
| Forecast Period | 2026-2034 |
| Historical Period | 2020-2025 |
| Growth Rate | CAGR of 7.3% from 2020-2034 |
| Segmentation |
|
Table of Contents
- 1. Introduction
- 1.1. Research Scope
- 1.2. Market Segmentation
- 1.3. Research Objective
- 1.4. Definitions and Assumptions
- 2. Executive Summary
- 2.1. Market Snapshot
- 3. Market Dynamics
- 3.1. Market Drivers
- 3.2. Market Restrains
- 3.3. Market Trends
- 3.4. Market Opportunities
- 4. Market Factor Analysis
- 4.1. Porters Five Forces
- 4.1.1. Bargaining Power of Suppliers
- 4.1.2. Bargaining Power of Buyers
- 4.1.3. Threat of New Entrants
- 4.1.4. Threat of Substitutes
- 4.1.5. Competitive Rivalry
- 4.2. PESTEL analysis
- 4.3. BCG Analysis
- 4.3.1. Stars (High Growth, High Market Share)
- 4.3.2. Cash Cows (Low Growth, High Market Share)
- 4.3.3. Question Mark (High Growth, Low Market Share)
- 4.3.4. Dogs (Low Growth, Low Market Share)
- 4.4. Ansoff Matrix Analysis
- 4.5. Supply Chain Analysis
- 4.6. Regulatory Landscape
- 4.7. Current Market Potential and Opportunity Assessment (TAM–SAM–SOM Framework)
- 4.8. IMR Analyst Note
- 4.1. Porters Five Forces
- 5. Market Analysis, Insights and Forecast 2021-2033
- 5.1. Market Analysis, Insights and Forecast - by Application
- 5.1.1. Testing
- 5.1.2. Entertainment
- 5.1.3. Education
- 5.1.4. Others
- 5.2. Market Analysis, Insights and Forecast - by Types
- 5.2.1. Truck Simulator
- 5.2.2. Bus Simulator
- 5.2.3. Others
- 5.3. Market Analysis, Insights and Forecast - by Region
- 5.3.1. North America
- 5.3.2. South America
- 5.3.3. Europe
- 5.3.4. Middle East & Africa
- 5.3.5. Asia Pacific
- 5.1. Market Analysis, Insights and Forecast - by Application
- 6. Global Simulated Driving Simulators Analysis, Insights and Forecast, 2021-2033
- 6.1. Market Analysis, Insights and Forecast - by Application
- 6.1.1. Testing
- 6.1.2. Entertainment
- 6.1.3. Education
- 6.1.4. Others
- 6.2. Market Analysis, Insights and Forecast - by Types
- 6.2.1. Truck Simulator
- 6.2.2. Bus Simulator
- 6.2.3. Others
- 6.1. Market Analysis, Insights and Forecast - by Application
- 7. North America Simulated Driving Simulators Analysis, Insights and Forecast, 2020-2032
- 7.1. Market Analysis, Insights and Forecast - by Application
- 7.1.1. Testing
- 7.1.2. Entertainment
- 7.1.3. Education
- 7.1.4. Others
- 7.2. Market Analysis, Insights and Forecast - by Types
- 7.2.1. Truck Simulator
- 7.2.2. Bus Simulator
- 7.2.3. Others
- 7.1. Market Analysis, Insights and Forecast - by Application
- 8. South America Simulated Driving Simulators Analysis, Insights and Forecast, 2020-2032
- 8.1. Market Analysis, Insights and Forecast - by Application
- 8.1.1. Testing
- 8.1.2. Entertainment
- 8.1.3. Education
- 8.1.4. Others
- 8.2. Market Analysis, Insights and Forecast - by Types
- 8.2.1. Truck Simulator
- 8.2.2. Bus Simulator
- 8.2.3. Others
- 8.1. Market Analysis, Insights and Forecast - by Application
- 9. Europe Simulated Driving Simulators Analysis, Insights and Forecast, 2020-2032
- 9.1. Market Analysis, Insights and Forecast - by Application
- 9.1.1. Testing
- 9.1.2. Entertainment
- 9.1.3. Education
- 9.1.4. Others
- 9.2. Market Analysis, Insights and Forecast - by Types
- 9.2.1. Truck Simulator
- 9.2.2. Bus Simulator
- 9.2.3. Others
- 9.1. Market Analysis, Insights and Forecast - by Application
- 10. Middle East & Africa Simulated Driving Simulators Analysis, Insights and Forecast, 2020-2032
- 10.1. Market Analysis, Insights and Forecast - by Application
- 10.1.1. Testing
- 10.1.2. Entertainment
- 10.1.3. Education
- 10.1.4. Others
- 10.2. Market Analysis, Insights and Forecast - by Types
- 10.2.1. Truck Simulator
- 10.2.2. Bus Simulator
- 10.2.3. Others
- 10.1. Market Analysis, Insights and Forecast - by Application
- 11. Asia Pacific Simulated Driving Simulators Analysis, Insights and Forecast, 2020-2032
- 11.1. Market Analysis, Insights and Forecast - by Application
- 11.1.1. Testing
- 11.1.2. Entertainment
- 11.1.3. Education
- 11.1.4. Others
- 11.2. Market Analysis, Insights and Forecast - by Types
- 11.2.1. Truck Simulator
- 11.2.2. Bus Simulator
- 11.2.3. Others
- 11.1. Market Analysis, Insights and Forecast - by Application
- 12. Competitive Analysis
- 12.1. Company Profiles
- 12.1.1 ECA Group
- 12.1.1.1. Company Overview
- 12.1.1.2. Products
- 12.1.1.3. Company Financials
- 12.1.1.4. SWOT Analysis
- 12.1.2 AV Simulation
- 12.1.2.1. Company Overview
- 12.1.2.2. Products
- 12.1.2.3. Company Financials
- 12.1.2.4. SWOT Analysis
- 12.1.3 VI-Grade
- 12.1.3.1. Company Overview
- 12.1.3.2. Products
- 12.1.3.3. Company Financials
- 12.1.3.4. SWOT Analysis
- 12.1.4 L3Harris Technologies
- 12.1.4.1. Company Overview
- 12.1.4.2. Products
- 12.1.4.3. Company Financials
- 12.1.4.4. SWOT Analysis
- 12.1.5 Cruden
- 12.1.5.1. Company Overview
- 12.1.5.2. Products
- 12.1.5.3. Company Financials
- 12.1.5.4. SWOT Analysis
- 12.1.6 Zen Technologies
- 12.1.6.1. Company Overview
- 12.1.6.2. Products
- 12.1.6.3. Company Financials
- 12.1.6.4. SWOT Analysis
- 12.1.7 Ansible Motion
- 12.1.7.1. Company Overview
- 12.1.7.2. Products
- 12.1.7.3. Company Financials
- 12.1.7.4. SWOT Analysis
- 12.1.8 XPI Simulation
- 12.1.8.1. Company Overview
- 12.1.8.2. Products
- 12.1.8.3. Company Financials
- 12.1.8.4. SWOT Analysis
- 12.1.9 Virage Simulation
- 12.1.9.1. Company Overview
- 12.1.9.2. Products
- 12.1.9.3. Company Financials
- 12.1.9.4. SWOT Analysis
- 12.1.10 AB Dynamics
- 12.1.10.1. Company Overview
- 12.1.10.2. Products
- 12.1.10.3. Company Financials
- 12.1.10.4. SWOT Analysis
- 12.1.11 IPG Automotive
- 12.1.11.1. Company Overview
- 12.1.11.2. Products
- 12.1.11.3. Company Financials
- 12.1.11.4. SWOT Analysis
- 12.1.12 AutoSim
- 12.1.12.1. Company Overview
- 12.1.12.2. Products
- 12.1.12.3. Company Financials
- 12.1.12.4. SWOT Analysis
- 12.1.13 Tecknotrove System
- 12.1.13.1. Company Overview
- 12.1.13.2. Products
- 12.1.13.3. Company Financials
- 12.1.13.4. SWOT Analysis
- 12.1.14 Tianjin Zhonggong Intelligent
- 12.1.14.1. Company Overview
- 12.1.14.2. Products
- 12.1.14.3. Company Financials
- 12.1.14.4. SWOT Analysis
- 12.1.15 Beijing Ziguang Legacy Science and Education
- 12.1.15.1. Company Overview
- 12.1.15.2. Products
- 12.1.15.3. Company Financials
- 12.1.15.4. SWOT Analysis
- 12.1.16 Beijing KingFar
- 12.1.16.1. Company Overview
- 12.1.16.2. Products
- 12.1.16.3. Company Financials
- 12.1.16.4. SWOT Analysis
- 12.1.17 Fujian Couder Technology
- 12.1.17.1. Company Overview
- 12.1.17.2. Products
- 12.1.17.3. Company Financials
- 12.1.17.4. SWOT Analysis
- 12.1.18 Shenzhen Zhongzhi Simulation
- 12.1.18.1. Company Overview
- 12.1.18.2. Products
- 12.1.18.3. Company Financials
- 12.1.18.4. SWOT Analysis
- 12.1.1 ECA Group
- 12.2. Market Entropy
- 12.2.1 Company's Key Areas Served
- 12.2.2 Recent Developments
- 12.3. Company Market Share Analysis 2025
- 12.3.1 Top 5 Companies Market Share Analysis
- 12.3.2 Top 3 Companies Market Share Analysis
- 12.4. List of Potential Customers
- 13. Research Methodology
List of Figures
- Figure 1: Global Simulated Driving Simulators Revenue Breakdown (undefined, %) by Region 2025 & 2033
- Figure 2: North America Simulated Driving Simulators Revenue (undefined), by Application 2025 & 2033
- Figure 3: North America Simulated Driving Simulators Revenue Share (%), by Application 2025 & 2033
- Figure 4: North America Simulated Driving Simulators Revenue (undefined), by Types 2025 & 2033
- Figure 5: North America Simulated Driving Simulators Revenue Share (%), by Types 2025 & 2033
- Figure 6: North America Simulated Driving Simulators Revenue (undefined), by Country 2025 & 2033
- Figure 7: North America Simulated Driving Simulators Revenue Share (%), by Country 2025 & 2033
- Figure 8: South America Simulated Driving Simulators Revenue (undefined), by Application 2025 & 2033
- Figure 9: South America Simulated Driving Simulators Revenue Share (%), by Application 2025 & 2033
- Figure 10: South America Simulated Driving Simulators Revenue (undefined), by Types 2025 & 2033
- Figure 11: South America Simulated Driving Simulators Revenue Share (%), by Types 2025 & 2033
- Figure 12: South America Simulated Driving Simulators Revenue (undefined), by Country 2025 & 2033
- Figure 13: South America Simulated Driving Simulators Revenue Share (%), by Country 2025 & 2033
- Figure 14: Europe Simulated Driving Simulators Revenue (undefined), by Application 2025 & 2033
- Figure 15: Europe Simulated Driving Simulators Revenue Share (%), by Application 2025 & 2033
- Figure 16: Europe Simulated Driving Simulators Revenue (undefined), by Types 2025 & 2033
- Figure 17: Europe Simulated Driving Simulators Revenue Share (%), by Types 2025 & 2033
- Figure 18: Europe Simulated Driving Simulators Revenue (undefined), by Country 2025 & 2033
- Figure 19: Europe Simulated Driving Simulators Revenue Share (%), by Country 2025 & 2033
- Figure 20: Middle East & Africa Simulated Driving Simulators Revenue (undefined), by Application 2025 & 2033
- Figure 21: Middle East & Africa Simulated Driving Simulators Revenue Share (%), by Application 2025 & 2033
- Figure 22: Middle East & Africa Simulated Driving Simulators Revenue (undefined), by Types 2025 & 2033
- Figure 23: Middle East & Africa Simulated Driving Simulators Revenue Share (%), by Types 2025 & 2033
- Figure 24: Middle East & Africa Simulated Driving Simulators Revenue (undefined), by Country 2025 & 2033
- Figure 25: Middle East & Africa Simulated Driving Simulators Revenue Share (%), by Country 2025 & 2033
- Figure 26: Asia Pacific Simulated Driving Simulators Revenue (undefined), by Application 2025 & 2033
- Figure 27: Asia Pacific Simulated Driving Simulators Revenue Share (%), by Application 2025 & 2033
- Figure 28: Asia Pacific Simulated Driving Simulators Revenue (undefined), by Types 2025 & 2033
- Figure 29: Asia Pacific Simulated Driving Simulators Revenue Share (%), by Types 2025 & 2033
- Figure 30: Asia Pacific Simulated Driving Simulators Revenue (undefined), by Country 2025 & 2033
- Figure 31: Asia Pacific Simulated Driving Simulators Revenue Share (%), by Country 2025 & 2033
List of Tables
- Table 1: Global Simulated Driving Simulators Revenue undefined Forecast, by Application 2020 & 2033
- Table 2: Global Simulated Driving Simulators Revenue undefined Forecast, by Types 2020 & 2033
- Table 3: Global Simulated Driving Simulators Revenue undefined Forecast, by Region 2020 & 2033
- Table 4: Global Simulated Driving Simulators Revenue undefined Forecast, by Application 2020 & 2033
- Table 5: Global Simulated Driving Simulators Revenue undefined Forecast, by Types 2020 & 2033
- Table 6: Global Simulated Driving Simulators Revenue undefined Forecast, by Country 2020 & 2033
- Table 7: United States Simulated Driving Simulators Revenue (undefined) Forecast, by Application 2020 & 2033
- Table 8: Canada Simulated Driving Simulators Revenue (undefined) Forecast, by Application 2020 & 2033
- Table 9: Mexico Simulated Driving Simulators Revenue (undefined) Forecast, by Application 2020 & 2033
- Table 10: Global Simulated Driving Simulators Revenue undefined Forecast, by Application 2020 & 2033
- Table 11: Global Simulated Driving Simulators Revenue undefined Forecast, by Types 2020 & 2033
- Table 12: Global Simulated Driving Simulators Revenue undefined Forecast, by Country 2020 & 2033
- Table 13: Brazil Simulated Driving Simulators Revenue (undefined) Forecast, by Application 2020 & 2033
- Table 14: Argentina Simulated Driving Simulators Revenue (undefined) Forecast, by Application 2020 & 2033
- Table 15: Rest of South America Simulated Driving Simulators Revenue (undefined) Forecast, by Application 2020 & 2033
- Table 16: Global Simulated Driving Simulators Revenue undefined Forecast, by Application 2020 & 2033
- Table 17: Global Simulated Driving Simulators Revenue undefined Forecast, by Types 2020 & 2033
- Table 18: Global Simulated Driving Simulators Revenue undefined Forecast, by Country 2020 & 2033
- Table 19: United Kingdom Simulated Driving Simulators Revenue (undefined) Forecast, by Application 2020 & 2033
- Table 20: Germany Simulated Driving Simulators Revenue (undefined) Forecast, by Application 2020 & 2033
- Table 21: France Simulated Driving Simulators Revenue (undefined) Forecast, by Application 2020 & 2033
- Table 22: Italy Simulated Driving Simulators Revenue (undefined) Forecast, by Application 2020 & 2033
- Table 23: Spain Simulated Driving Simulators Revenue (undefined) Forecast, by Application 2020 & 2033
- Table 24: Russia Simulated Driving Simulators Revenue (undefined) Forecast, by Application 2020 & 2033
- Table 25: Benelux Simulated Driving Simulators Revenue (undefined) Forecast, by Application 2020 & 2033
- Table 26: Nordics Simulated Driving Simulators Revenue (undefined) Forecast, by Application 2020 & 2033
- Table 27: Rest of Europe Simulated Driving Simulators Revenue (undefined) Forecast, by Application 2020 & 2033
- Table 28: Global Simulated Driving Simulators Revenue undefined Forecast, by Application 2020 & 2033
- Table 29: Global Simulated Driving Simulators Revenue undefined Forecast, by Types 2020 & 2033
- Table 30: Global Simulated Driving Simulators Revenue undefined Forecast, by Country 2020 & 2033
- Table 31: Turkey Simulated Driving Simulators Revenue (undefined) Forecast, by Application 2020 & 2033
- Table 32: Israel Simulated Driving Simulators Revenue (undefined) Forecast, by Application 2020 & 2033
- Table 33: GCC Simulated Driving Simulators Revenue (undefined) Forecast, by Application 2020 & 2033
- Table 34: North Africa Simulated Driving Simulators Revenue (undefined) Forecast, by Application 2020 & 2033
- Table 35: South Africa Simulated Driving Simulators Revenue (undefined) Forecast, by Application 2020 & 2033
- Table 36: Rest of Middle East & Africa Simulated Driving Simulators Revenue (undefined) Forecast, by Application 2020 & 2033
- Table 37: Global Simulated Driving Simulators Revenue undefined Forecast, by Application 2020 & 2033
- Table 38: Global Simulated Driving Simulators Revenue undefined Forecast, by Types 2020 & 2033
- Table 39: Global Simulated Driving Simulators Revenue undefined Forecast, by Country 2020 & 2033
- Table 40: China Simulated Driving Simulators Revenue (undefined) Forecast, by Application 2020 & 2033
- Table 41: India Simulated Driving Simulators Revenue (undefined) Forecast, by Application 2020 & 2033
- Table 42: Japan Simulated Driving Simulators Revenue (undefined) Forecast, by Application 2020 & 2033
- Table 43: South Korea Simulated Driving Simulators Revenue (undefined) Forecast, by Application 2020 & 2033
- Table 44: ASEAN Simulated Driving Simulators Revenue (undefined) Forecast, by Application 2020 & 2033
- Table 45: Oceania Simulated Driving Simulators Revenue (undefined) Forecast, by Application 2020 & 2033
- Table 46: Rest of Asia Pacific Simulated Driving Simulators Revenue (undefined) Forecast, by Application 2020 & 2033
Frequently Asked Questions
1. What is the projected Compound Annual Growth Rate (CAGR) of the Simulated Driving Simulators?
The projected CAGR is approximately 7.3%.
2. Which companies are prominent players in the Simulated Driving Simulators?
Key companies in the market include ECA Group, AV Simulation, VI-Grade, L3Harris Technologies, Cruden, Zen Technologies, Ansible Motion, XPI Simulation, Virage Simulation, AB Dynamics, IPG Automotive, AutoSim, Tecknotrove System, Tianjin Zhonggong Intelligent, Beijing Ziguang Legacy Science and Education, Beijing KingFar, Fujian Couder Technology, Shenzhen Zhongzhi Simulation.
3. What are the main segments of the Simulated Driving Simulators?
The market segments include Application, Types.
4. Can you provide details about the market size?
The market size is estimated to be USD XXX N/A as of 2022.
5. What are some drivers contributing to market growth?
N/A
6. What are the notable trends driving market growth?
N/A
7. Are there any restraints impacting market growth?
N/A
8. Can you provide examples of recent developments in the market?
N/A
9. What pricing options are available for accessing the report?
Pricing options include single-user, multi-user, and enterprise licenses priced at USD 2900.00, USD 4350.00, and USD 5800.00 respectively.
10. Is the market size provided in terms of value or volume?
The market size is provided in terms of value, measured in N/A.
11. Are there any specific market keywords associated with the report?
Yes, the market keyword associated with the report is "Simulated Driving Simulators," which aids in identifying and referencing the specific market segment covered.
12. How do I determine which pricing option suits my needs best?
The pricing options vary based on user requirements and access needs. Individual users may opt for single-user licenses, while businesses requiring broader access may choose multi-user or enterprise licenses for cost-effective access to the report.
13. Are there any additional resources or data provided in the Simulated Driving Simulators report?
While the report offers comprehensive insights, it's advisable to review the specific contents or supplementary materials provided to ascertain if additional resources or data are available.
14. How can I stay updated on further developments or reports in the Simulated Driving Simulators?
To stay informed about further developments, trends, and reports in the Simulated Driving Simulators, consider subscribing to industry newsletters, following relevant companies and organizations, or regularly checking reputable industry news sources and publications.
Methodology
Step 1 - Identification of Relevant Samples Size from Population Database


Step 2 - Approaches for Defining Global Market Size (Value, Volume* & Price*)

Note*: In applicable scenarios
Step 3 - Data Sources
Primary Research
- Web Analytics
- Survey Reports
- Research Institute
- Latest Research Reports
- Opinion Leaders
Secondary Research
- Annual Reports
- White Paper
- Latest Press Release
- Industry Association
- Paid Database
- Investor Presentations

Step 4 - Data Triangulation
Involves using different sources of information in order to increase the validity of a study
These sources are likely to be stakeholders in a program - participants, other researchers, program staff, other community members, and so on.
Then we put all data in single framework & apply various statistical tools to find out the dynamic on the market.
During the analysis stage, feedback from the stakeholder groups would be compared to determine areas of agreement as well as areas of divergence