

Key Insights
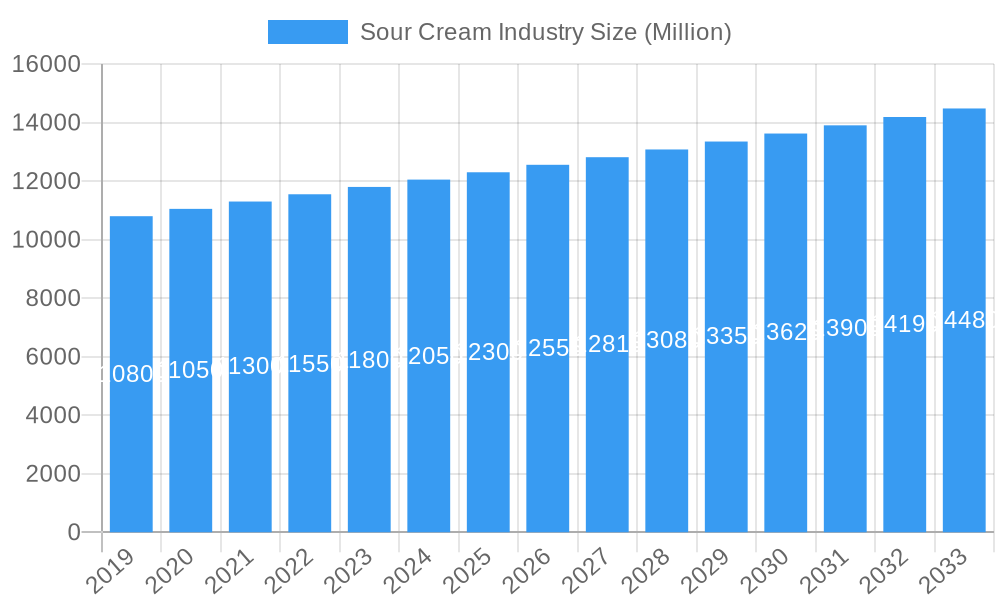
The global sour cream market is set for robust expansion, projected to reach $12.50 billion by 2025, with a Compound Annual Growth Rate (CAGR) of 6.5% through 2033. This growth is fueled by evolving consumer demand for healthier, convenient food options and sour cream's increasing culinary versatility. Key drivers include rising demand for nutrient-rich dairy products and the popularity of dips, sauces, and baked goods. Innovations in processing and product development, such as low-fat and lactose-free options, are broadening market appeal. The competitive landscape features established global and regional players focused on differentiation, partnerships, and marketing.
Sour Cream Industry Market Size (In Billion)
Distribution channels are vital, with supermarkets and hypermarkets leading sales. Online retail offers significant expansion opportunities for wider reach and convenience. Emerging markets in Asia Pacific, especially China and India, are poised for strong growth due to rising disposable incomes and the adoption of Western diets. Mature markets in North America and Europe are emphasizing premiumization and specialized products. Market growth may be constrained by fluctuating milk prices and competition from dairy alternatives. However, sour cream's inherent versatility and broad consumer acceptance ensure sustained market relevance and expansion.
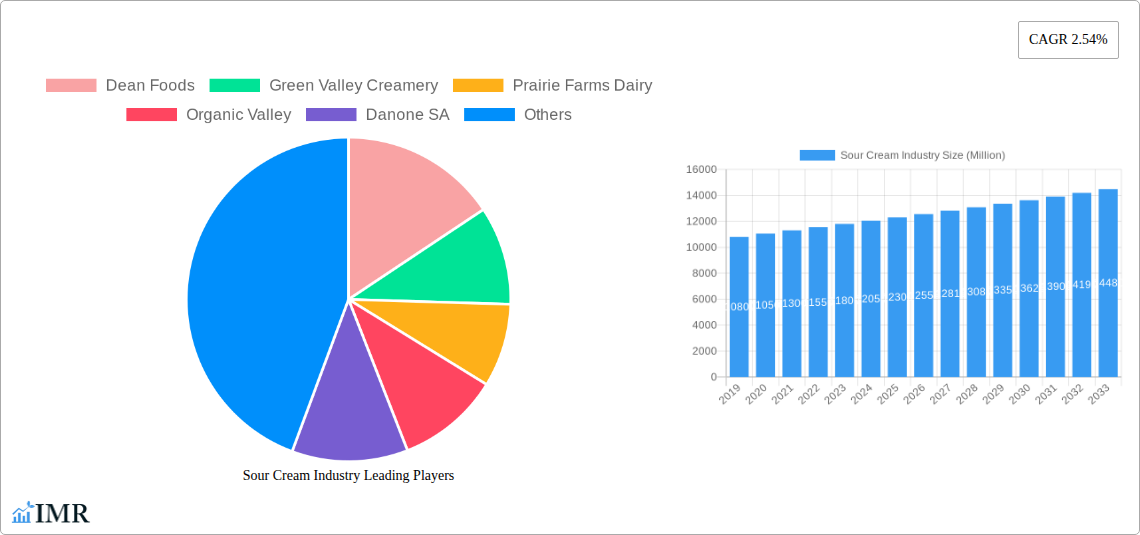
Sour Cream Industry Company Market Share
Comprehensive Sour Cream Industry Report: Market Dynamics, Growth Trends, and Future Outlook (2019-2033)
This in-depth report provides a thorough analysis of the global sour cream market, offering critical insights for stakeholders across the entire value chain. With a study period spanning from 2019 to 2033, including a base year of 2025 and a forecast period of 2025-2033, this report leverages granular data to illuminate market dynamics, growth drivers, regional dominance, and future opportunities. We delve into the parent and child market segments, providing actionable intelligence for businesses seeking to capitalize on evolving consumer preferences and industry advancements. All values are presented in million units, ensuring clarity and comparability.
Sour Cream Industry Market Dynamics & Structure
The global sour cream market exhibits a moderately consolidated structure, with key players like Danone SA, The Kraft Heinz Company, Nestle SA, and Fonterra Co-operative Group Limited holding significant market shares. However, the increasing presence of specialized brands and private labels contributes to a dynamic competitive landscape. Technological innovation is primarily driven by product diversification and packaging advancements, focusing on convenience and extended shelf life. Regulatory frameworks, particularly concerning food safety and labeling, play a crucial role in shaping market entry and operational strategies. Competitive product substitutes, notably plant-based alternatives and other dairy-based dips, present a continuous challenge and drive innovation in taste and texture. End-user demographics are increasingly skewed towards health-conscious consumers and convenience-seeking millennials and Gen Z, influencing product development and marketing approaches. Mergers and acquisitions (M&A) trends indicate a strategic focus on expanding product portfolios and geographic reach, particularly in emerging markets.
- Market Concentration: Moderately consolidated with a few dominant players and a growing number of niche competitors.
- Technological Innovation Drivers: Product diversification (e.g., flavored sour creams, low-fat options), innovative packaging solutions for extended shelf life and convenience.
- Regulatory Frameworks: Strict adherence to food safety standards, evolving labeling requirements for allergens and nutritional information.
- Competitive Product Substitutes: Plant-based sour cream alternatives, yogurt-based dips, other creamy condiments.
- End-User Demographics: Growing demand from health-conscious consumers, convenience-driven younger demographics, and households seeking versatile ingredients.
- M&A Trends: Strategic acquisitions to broaden product offerings, enhance market penetration, and gain access to new technologies.
Sour Cream Industry Growth Trends & Insights
The global sour cream market is poised for robust expansion, projected to achieve a Compound Annual Growth Rate (CAGR) of approximately 4.5% between 2025 and 2033. This growth is fueled by a confluence of factors including increasing consumer demand for versatile and flavorful dairy products, expanding applications in both culinary and convenience food sectors, and a burgeoning interest in premium and specialty sour cream offerings. The market size, estimated at USD 6,200 million in 2025, is anticipated to reach USD 8,800 million by 2033. Adoption rates for both conventional and organic sour cream are steadily rising, with organic variants experiencing a slightly higher CAGR due to growing consumer preference for natural and sustainably sourced products.
Technological disruptions, while not revolutionary, are focused on enhancing production efficiency, improving product consistency, and developing extended shelf-life formulations. Innovations in fermentation processes and ingredient sourcing are contributing to a more diverse product landscape. Consumer behavior shifts are a significant market influencer. There is a discernible trend towards increased usage of sour cream as a cooking ingredient, a base for dips and sauces, and even as a healthier substitute for mayonnaise in various recipes. The "treat yourself" culture and the rise of home cooking, exacerbated by recent global events, have further bolstered demand for comfort food ingredients like sour cream. Moreover, the growing awareness of probiotics and gut health benefits associated with fermented dairy products is indirectly contributing to the sour cream market's appeal. Online retail channels are also playing an increasingly important role in market penetration, offering greater accessibility to consumers in both urban and rural areas. The market penetration for sour cream, currently at around 75% in developed economies, is expected to climb further with increased product availability and targeted marketing campaigns.
- Market Size Evolution: Projected to grow from USD 6,200 million in 2025 to USD 8,800 million by 2033.
- CAGR: Approximately 4.5% from 2025 to 2033.
- Adoption Rates: Steady increase in both conventional and organic segments, with organic showing higher growth.
- Technological Disruptions: Focus on production efficiency, product consistency, and extended shelf-life formulations.
- Consumer Behavior Shifts: Increased use in cooking and as a dip base, growing preference for natural and sustainably sourced products, and adoption of online retail channels.
- Market Penetration: Expected to rise from 75% in developed economies to higher levels.
Dominant Regions, Countries, or Segments in Sour Cream Industry
The North America region stands as the dominant force in the global sour cream market, driven by established consumer habits, a well-developed dairy industry, and significant per capita consumption. The United States, in particular, accounts for a substantial portion of the regional and global market share. Key drivers for this dominance include widespread availability through extensive distribution channels, strong brand loyalty, and the pervasive use of sour cream in a variety of popular dishes and snacks. Economic policies that support dairy farming and food processing infrastructure further bolster North America's leading position.
Within North America, the Supermarkets/Hypermarkets distribution channel holds the largest market share, reflecting consumer purchasing patterns that favor one-stop shopping for groceries. These outlets offer a wide variety of brands, sizes, and types of sour cream, catering to diverse consumer needs. The convenience offered by these large retail formats, coupled with competitive pricing and promotional activities, solidifies their importance.
The Conventional segment represents the largest share within the product type category. This is primarily due to its long-standing presence in the market, affordability, and broad consumer acceptance. However, the Organic segment is exhibiting a higher growth rate, fueled by an increasing consumer consciousness regarding health, environmental sustainability, and ethical sourcing. This growth is particularly pronounced in urban centers and among younger demographics.
The United States emerges as the leading country, boasting a market size estimated at USD 2,800 million in 2025. The country's large population, diverse culinary landscape, and strong presence of major dairy companies like Dean Foods and Daisy Brand LLC contribute to this leadership. Continuous product innovation and aggressive marketing campaigns by these companies further entrench their market dominance.
- Dominant Region: North America.
- Leading Country: United States.
- Dominant Distribution Channel: Supermarkets/Hypermarkets.
- Dominant Product Type Segment: Conventional.
- High-Growth Product Type Segment: Organic.
- Key Drivers for Dominance: Established consumer habits, robust dairy industry, widespread availability, strong brand loyalty, economic support for dairy.
- Market Share (Estimated for US, 2025): Approximately 45% of the North American market.
Sour Cream Industry Product Landscape
The sour cream product landscape is characterized by continuous innovation focused on enhancing consumer experience and expanding applications. Beyond the traditional full-fat and low-fat variants, manufacturers are introducing flavored sour creams (e.g., chive, dill, garlic) to cater to evolving taste preferences and create convenient, ready-to-use dips. Organic and plant-based alternatives are gaining significant traction, appealing to health-conscious and environmentally aware consumers. Packaging innovations, including smaller, single-serving tubs and resealable options, address convenience needs and reduce food waste. Performance metrics are centered on taste profiles, texture consistency, and shelf-life longevity, with ongoing research into improved cultures for enhanced flavor and probiotic benefits.
Key Drivers, Barriers & Challenges in Sour Cream Industry
Key Drivers:
- Growing Demand for Versatile Ingredients: Sour cream's adaptability in cooking, baking, and as a condiment fuels consistent demand.
- Health and Wellness Trends: The rise of organic and low-fat options caters to health-conscious consumers.
- Convenience Food Culture: Pre-made dips and convenient packaging align with busy lifestyles.
- Expanding Applications: Increasing use in ethnic cuisines and innovative recipes.
- Population Growth: A larger global population directly translates to increased food consumption.
Barriers & Challenges:
- Competition from Substitutes: Plant-based alternatives and other dairy products pose a significant competitive threat.
- Volatile Raw Material Prices: Fluctuations in milk prices can impact production costs and profitability.
- Supply Chain Disruptions: Issues related to logistics, transportation, and ingredient sourcing can affect availability and costs.
- Regulatory Compliance: Adhering to evolving food safety and labeling standards requires ongoing investment.
- Consumer Perception of Dairy Fat: Some consumers are actively reducing dairy fat intake due to health concerns.
Emerging Opportunities in Sour Cream Industry
Emerging opportunities in the sour cream industry lie in the expansion of the plant-based segment, driven by growing vegan and flexitarian consumer bases. Development of premium, artisanal sour creams with unique flavor profiles and specialized cultures can capture niche markets willing to pay a premium. Furthermore, innovative functional sour creams fortified with probiotics or prebiotics for enhanced gut health present a significant growth avenue. Expanding into emerging economies with increasing disposable incomes and Westernized dietary habits offers substantial untapped market potential. The development of sustainable packaging solutions and transparent sourcing practices will also resonate with environmentally conscious consumers.
Growth Accelerators in the Sour Cream Industry Industry
Several catalysts are propelling the long-term growth of the sour cream industry. Technological breakthroughs in fermentation science are enabling the creation of novel flavor profiles and enhanced nutritional benefits, making sour cream more appealing. Strategic partnerships between dairy producers and food manufacturers can lead to co-branded products and wider market reach. Market expansion strategies, particularly into Asia-Pacific and Latin America, where dairy consumption is on the rise, represent significant growth opportunities. Furthermore, investments in R&D for plant-based alternatives are crucial for capturing a growing segment of the market and mitigating potential declines in traditional dairy consumption. Targeted marketing campaigns emphasizing the versatility and health benefits of sour cream will also act as significant growth accelerators.
Key Players Shaping the Sour Cream Industry Market
- Dean Foods
- Green Valley Creamery
- Prairie Farms Dairy
- Organic Valley
- Danone SA
- The Kraft Heinz Company
- Nestle SA
- Fonterra Co-operative Group Limited
- Laiterie Chalifoux
- Daisy Brand LLC
Notable Milestones in Sour Cream Industry Sector
- January 2023: Violife launched its new dairy-free sour cream in the United States, aiming to expand its dairy-free market presence. The product became available in approximately 883 Walmart stores.
- October 2022: PA Dairy Processor expanded their production capacity of sour cream in response to increasing market demand.
- September 2021: Only Plant Based, a plant-based condiment company, launched vegan mayo, sour cream, and dressings across the United States, utilizing rapeseed oil, spirit vinegar, vegetables, and spices.
In-Depth Sour Cream Industry Market Outlook
The future outlook for the sour cream industry is characterized by sustained growth, driven by evolving consumer preferences and strategic market expansion. The increasing demand for organic and plant-based alternatives, coupled with innovations in functional ingredients, presents significant avenues for market penetration. Manufacturers are expected to capitalize on emerging markets by adapting product offerings to local tastes and increasing distribution networks. Investments in sustainable practices and transparent supply chains will be crucial for attracting environmentally conscious consumers. The industry's ability to innovate, embrace new technologies, and respond to health and wellness trends will be paramount in shaping its trajectory and unlocking its full market potential in the coming years.
Sour Cream Industry Segmentation
-
1. Type
- 1.1. Organic
- 1.2. Conventional
-
2. Distribution Channel
- 2.1. Supermarkets/Hypermarkets
- 2.2. Convenience Stores
- 2.3. Online Retail Stores
- 2.4. Other Distribution Channels
Sour Cream Industry Segmentation By Geography
-
1. North America
- 1.1. United States
- 1.2. Canada
- 1.3. Mexico
- 1.4. Rest of North America
-
2. Europe
- 2.1. Spain
- 2.2. United Kingdom
- 2.3. France
- 2.4. Germany
- 2.5. Russia
- 2.6. Italy
- 2.7. Rest of Europe
-
3. Asia Pacific
- 3.1. China
- 3.2. Japan
- 3.3. India
- 3.4. Australia
- 3.5. Rest of Asia Pacific
-
4. South America
- 4.1. Brazil
- 4.2. Argentina
- 4.3. Rest of South America
-
5. Middle East and Africa
- 5.1. South Africa
- 5.2. United Arab Emirates
- 5.3. Rest of Middle East and Africa
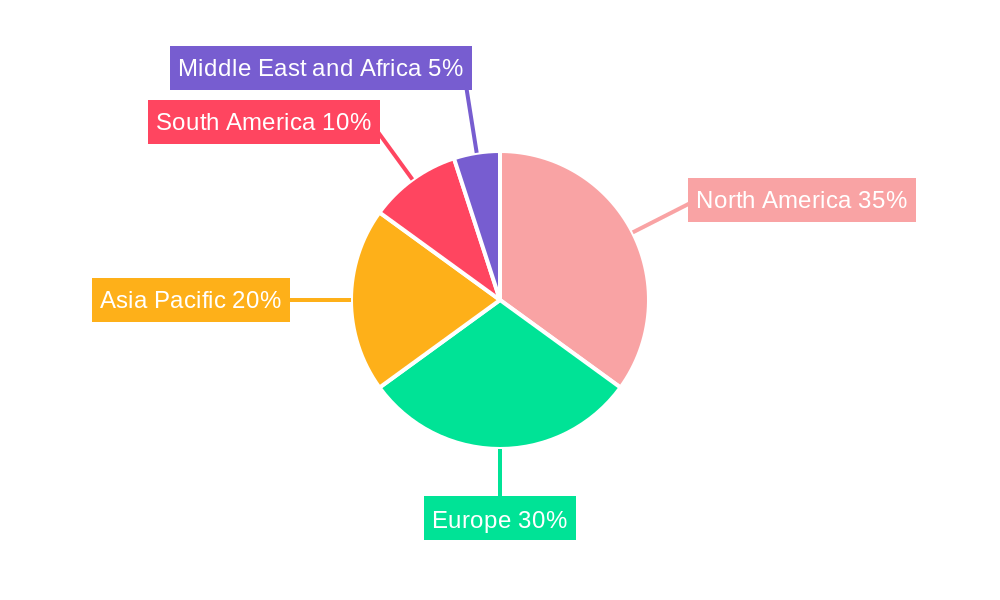
Sour Cream Industry Regional Market Share
Geographic Coverage of Sour Cream Industry
Sour Cream Industry REPORT HIGHLIGHTS
| Aspects | Details |
|---|---|
| Study Period | 2020-2034 |
| Base Year | 2025 |
| Estimated Year | 2026 |
| Forecast Period | 2026-2034 |
| Historical Period | 2020-2025 |
| Growth Rate | CAGR of 6.5% from 2020-2034 |
| Segmentation |
|
Table of Contents
- 1. Introduction
- 1.1. Research Scope
- 1.2. Market Segmentation
- 1.3. Research Methodology
- 1.4. Definitions and Assumptions
- 2. Executive Summary
- 2.1. Introduction
- 3. Market Dynamics
- 3.1. Introduction
- 3.2. Market Drivers
- 3.2.1. Increasing Sports Participation; Increasing Awareness about Health and Fitness
- 3.3. Market Restrains
- 3.3.1. Adverse Effects of Overconsumption of Products
- 3.4. Market Trends
- 3.4.1. Growing Demand for Lactose-free Sour Cream Products
- 4. Market Factor Analysis
- 4.1. Porters Five Forces
- 4.2. Supply/Value Chain
- 4.3. PESTEL analysis
- 4.4. Market Entropy
- 4.5. Patent/Trademark Analysis
- 5. Global Sour Cream Industry Analysis, Insights and Forecast, 2020-2032
- 5.1. Market Analysis, Insights and Forecast - by Type
- 5.1.1. Organic
- 5.1.2. Conventional
- 5.2. Market Analysis, Insights and Forecast - by Distribution Channel
- 5.2.1. Supermarkets/Hypermarkets
- 5.2.2. Convenience Stores
- 5.2.3. Online Retail Stores
- 5.2.4. Other Distribution Channels
- 5.3. Market Analysis, Insights and Forecast - by Region
- 5.3.1. North America
- 5.3.2. Europe
- 5.3.3. Asia Pacific
- 5.3.4. South America
- 5.3.5. Middle East and Africa
- 5.1. Market Analysis, Insights and Forecast - by Type
- 6. North America Sour Cream Industry Analysis, Insights and Forecast, 2020-2032
- 6.1. Market Analysis, Insights and Forecast - by Type
- 6.1.1. Organic
- 6.1.2. Conventional
- 6.2. Market Analysis, Insights and Forecast - by Distribution Channel
- 6.2.1. Supermarkets/Hypermarkets
- 6.2.2. Convenience Stores
- 6.2.3. Online Retail Stores
- 6.2.4. Other Distribution Channels
- 6.1. Market Analysis, Insights and Forecast - by Type
- 7. Europe Sour Cream Industry Analysis, Insights and Forecast, 2020-2032
- 7.1. Market Analysis, Insights and Forecast - by Type
- 7.1.1. Organic
- 7.1.2. Conventional
- 7.2. Market Analysis, Insights and Forecast - by Distribution Channel
- 7.2.1. Supermarkets/Hypermarkets
- 7.2.2. Convenience Stores
- 7.2.3. Online Retail Stores
- 7.2.4. Other Distribution Channels
- 7.1. Market Analysis, Insights and Forecast - by Type
- 8. Asia Pacific Sour Cream Industry Analysis, Insights and Forecast, 2020-2032
- 8.1. Market Analysis, Insights and Forecast - by Type
- 8.1.1. Organic
- 8.1.2. Conventional
- 8.2. Market Analysis, Insights and Forecast - by Distribution Channel
- 8.2.1. Supermarkets/Hypermarkets
- 8.2.2. Convenience Stores
- 8.2.3. Online Retail Stores
- 8.2.4. Other Distribution Channels
- 8.1. Market Analysis, Insights and Forecast - by Type
- 9. South America Sour Cream Industry Analysis, Insights and Forecast, 2020-2032
- 9.1. Market Analysis, Insights and Forecast - by Type
- 9.1.1. Organic
- 9.1.2. Conventional
- 9.2. Market Analysis, Insights and Forecast - by Distribution Channel
- 9.2.1. Supermarkets/Hypermarkets
- 9.2.2. Convenience Stores
- 9.2.3. Online Retail Stores
- 9.2.4. Other Distribution Channels
- 9.1. Market Analysis, Insights and Forecast - by Type
- 10. Middle East and Africa Sour Cream Industry Analysis, Insights and Forecast, 2020-2032
- 10.1. Market Analysis, Insights and Forecast - by Type
- 10.1.1. Organic
- 10.1.2. Conventional
- 10.2. Market Analysis, Insights and Forecast - by Distribution Channel
- 10.2.1. Supermarkets/Hypermarkets
- 10.2.2. Convenience Stores
- 10.2.3. Online Retail Stores
- 10.2.4. Other Distribution Channels
- 10.1. Market Analysis, Insights and Forecast - by Type
- 11. Competitive Analysis
- 11.1. Global Market Share Analysis 2025
- 11.2. Company Profiles
- 11.2.1 Dean Foods
- 11.2.1.1. Overview
- 11.2.1.2. Products
- 11.2.1.3. SWOT Analysis
- 11.2.1.4. Recent Developments
- 11.2.1.5. Financials (Based on Availability)
- 11.2.2 Green Valley Creamery
- 11.2.2.1. Overview
- 11.2.2.2. Products
- 11.2.2.3. SWOT Analysis
- 11.2.2.4. Recent Developments
- 11.2.2.5. Financials (Based on Availability)
- 11.2.3 Prairie Farms Dairy
- 11.2.3.1. Overview
- 11.2.3.2. Products
- 11.2.3.3. SWOT Analysis
- 11.2.3.4. Recent Developments
- 11.2.3.5. Financials (Based on Availability)
- 11.2.4 Organic Valley
- 11.2.4.1. Overview
- 11.2.4.2. Products
- 11.2.4.3. SWOT Analysis
- 11.2.4.4. Recent Developments
- 11.2.4.5. Financials (Based on Availability)
- 11.2.5 Danone SA
- 11.2.5.1. Overview
- 11.2.5.2. Products
- 11.2.5.3. SWOT Analysis
- 11.2.5.4. Recent Developments
- 11.2.5.5. Financials (Based on Availability)
- 11.2.6 The Kraft Heinz Company
- 11.2.6.1. Overview
- 11.2.6.2. Products
- 11.2.6.3. SWOT Analysis
- 11.2.6.4. Recent Developments
- 11.2.6.5. Financials (Based on Availability)
- 11.2.7 Nestle SA
- 11.2.7.1. Overview
- 11.2.7.2. Products
- 11.2.7.3. SWOT Analysis
- 11.2.7.4. Recent Developments
- 11.2.7.5. Financials (Based on Availability)
- 11.2.8 Fonterra Co-operative Group Limited
- 11.2.8.1. Overview
- 11.2.8.2. Products
- 11.2.8.3. SWOT Analysis
- 11.2.8.4. Recent Developments
- 11.2.8.5. Financials (Based on Availability)
- 11.2.9 Laiterie Chalifoux
- 11.2.9.1. Overview
- 11.2.9.2. Products
- 11.2.9.3. SWOT Analysis
- 11.2.9.4. Recent Developments
- 11.2.9.5. Financials (Based on Availability)
- 11.2.10 Daisy Brand LLC
- 11.2.10.1. Overview
- 11.2.10.2. Products
- 11.2.10.3. SWOT Analysis
- 11.2.10.4. Recent Developments
- 11.2.10.5. Financials (Based on Availability)
- 11.2.1 Dean Foods
List of Figures
- Figure 1: Global Sour Cream Industry Revenue Breakdown (billion, %) by Region 2025 & 2033
- Figure 2: Global Sour Cream Industry Volume Breakdown (K Ton, %) by Region 2025 & 2033
- Figure 3: North America Sour Cream Industry Revenue (billion), by Type 2025 & 2033
- Figure 4: North America Sour Cream Industry Volume (K Ton), by Type 2025 & 2033
- Figure 5: North America Sour Cream Industry Revenue Share (%), by Type 2025 & 2033
- Figure 6: North America Sour Cream Industry Volume Share (%), by Type 2025 & 2033
- Figure 7: North America Sour Cream Industry Revenue (billion), by Distribution Channel 2025 & 2033
- Figure 8: North America Sour Cream Industry Volume (K Ton), by Distribution Channel 2025 & 2033
- Figure 9: North America Sour Cream Industry Revenue Share (%), by Distribution Channel 2025 & 2033
- Figure 10: North America Sour Cream Industry Volume Share (%), by Distribution Channel 2025 & 2033
- Figure 11: North America Sour Cream Industry Revenue (billion), by Country 2025 & 2033
- Figure 12: North America Sour Cream Industry Volume (K Ton), by Country 2025 & 2033
- Figure 13: North America Sour Cream Industry Revenue Share (%), by Country 2025 & 2033
- Figure 14: North America Sour Cream Industry Volume Share (%), by Country 2025 & 2033
- Figure 15: Europe Sour Cream Industry Revenue (billion), by Type 2025 & 2033
- Figure 16: Europe Sour Cream Industry Volume (K Ton), by Type 2025 & 2033
- Figure 17: Europe Sour Cream Industry Revenue Share (%), by Type 2025 & 2033
- Figure 18: Europe Sour Cream Industry Volume Share (%), by Type 2025 & 2033
- Figure 19: Europe Sour Cream Industry Revenue (billion), by Distribution Channel 2025 & 2033
- Figure 20: Europe Sour Cream Industry Volume (K Ton), by Distribution Channel 2025 & 2033
- Figure 21: Europe Sour Cream Industry Revenue Share (%), by Distribution Channel 2025 & 2033
- Figure 22: Europe Sour Cream Industry Volume Share (%), by Distribution Channel 2025 & 2033
- Figure 23: Europe Sour Cream Industry Revenue (billion), by Country 2025 & 2033
- Figure 24: Europe Sour Cream Industry Volume (K Ton), by Country 2025 & 2033
- Figure 25: Europe Sour Cream Industry Revenue Share (%), by Country 2025 & 2033
- Figure 26: Europe Sour Cream Industry Volume Share (%), by Country 2025 & 2033
- Figure 27: Asia Pacific Sour Cream Industry Revenue (billion), by Type 2025 & 2033
- Figure 28: Asia Pacific Sour Cream Industry Volume (K Ton), by Type 2025 & 2033
- Figure 29: Asia Pacific Sour Cream Industry Revenue Share (%), by Type 2025 & 2033
- Figure 30: Asia Pacific Sour Cream Industry Volume Share (%), by Type 2025 & 2033
- Figure 31: Asia Pacific Sour Cream Industry Revenue (billion), by Distribution Channel 2025 & 2033
- Figure 32: Asia Pacific Sour Cream Industry Volume (K Ton), by Distribution Channel 2025 & 2033
- Figure 33: Asia Pacific Sour Cream Industry Revenue Share (%), by Distribution Channel 2025 & 2033
- Figure 34: Asia Pacific Sour Cream Industry Volume Share (%), by Distribution Channel 2025 & 2033
- Figure 35: Asia Pacific Sour Cream Industry Revenue (billion), by Country 2025 & 2033
- Figure 36: Asia Pacific Sour Cream Industry Volume (K Ton), by Country 2025 & 2033
- Figure 37: Asia Pacific Sour Cream Industry Revenue Share (%), by Country 2025 & 2033
- Figure 38: Asia Pacific Sour Cream Industry Volume Share (%), by Country 2025 & 2033
- Figure 39: South America Sour Cream Industry Revenue (billion), by Type 2025 & 2033
- Figure 40: South America Sour Cream Industry Volume (K Ton), by Type 2025 & 2033
- Figure 41: South America Sour Cream Industry Revenue Share (%), by Type 2025 & 2033
- Figure 42: South America Sour Cream Industry Volume Share (%), by Type 2025 & 2033
- Figure 43: South America Sour Cream Industry Revenue (billion), by Distribution Channel 2025 & 2033
- Figure 44: South America Sour Cream Industry Volume (K Ton), by Distribution Channel 2025 & 2033
- Figure 45: South America Sour Cream Industry Revenue Share (%), by Distribution Channel 2025 & 2033
- Figure 46: South America Sour Cream Industry Volume Share (%), by Distribution Channel 2025 & 2033
- Figure 47: South America Sour Cream Industry Revenue (billion), by Country 2025 & 2033
- Figure 48: South America Sour Cream Industry Volume (K Ton), by Country 2025 & 2033
- Figure 49: South America Sour Cream Industry Revenue Share (%), by Country 2025 & 2033
- Figure 50: South America Sour Cream Industry Volume Share (%), by Country 2025 & 2033
- Figure 51: Middle East and Africa Sour Cream Industry Revenue (billion), by Type 2025 & 2033
- Figure 52: Middle East and Africa Sour Cream Industry Volume (K Ton), by Type 2025 & 2033
- Figure 53: Middle East and Africa Sour Cream Industry Revenue Share (%), by Type 2025 & 2033
- Figure 54: Middle East and Africa Sour Cream Industry Volume Share (%), by Type 2025 & 2033
- Figure 55: Middle East and Africa Sour Cream Industry Revenue (billion), by Distribution Channel 2025 & 2033
- Figure 56: Middle East and Africa Sour Cream Industry Volume (K Ton), by Distribution Channel 2025 & 2033
- Figure 57: Middle East and Africa Sour Cream Industry Revenue Share (%), by Distribution Channel 2025 & 2033
- Figure 58: Middle East and Africa Sour Cream Industry Volume Share (%), by Distribution Channel 2025 & 2033
- Figure 59: Middle East and Africa Sour Cream Industry Revenue (billion), by Country 2025 & 2033
- Figure 60: Middle East and Africa Sour Cream Industry Volume (K Ton), by Country 2025 & 2033
- Figure 61: Middle East and Africa Sour Cream Industry Revenue Share (%), by Country 2025 & 2033
- Figure 62: Middle East and Africa Sour Cream Industry Volume Share (%), by Country 2025 & 2033
List of Tables
- Table 1: Global Sour Cream Industry Revenue billion Forecast, by Type 2020 & 2033
- Table 2: Global Sour Cream Industry Volume K Ton Forecast, by Type 2020 & 2033
- Table 3: Global Sour Cream Industry Revenue billion Forecast, by Distribution Channel 2020 & 2033
- Table 4: Global Sour Cream Industry Volume K Ton Forecast, by Distribution Channel 2020 & 2033
- Table 5: Global Sour Cream Industry Revenue billion Forecast, by Region 2020 & 2033
- Table 6: Global Sour Cream Industry Volume K Ton Forecast, by Region 2020 & 2033
- Table 7: Global Sour Cream Industry Revenue billion Forecast, by Type 2020 & 2033
- Table 8: Global Sour Cream Industry Volume K Ton Forecast, by Type 2020 & 2033
- Table 9: Global Sour Cream Industry Revenue billion Forecast, by Distribution Channel 2020 & 2033
- Table 10: Global Sour Cream Industry Volume K Ton Forecast, by Distribution Channel 2020 & 2033
- Table 11: Global Sour Cream Industry Revenue billion Forecast, by Country 2020 & 2033
- Table 12: Global Sour Cream Industry Volume K Ton Forecast, by Country 2020 & 2033
- Table 13: United States Sour Cream Industry Revenue (billion) Forecast, by Application 2020 & 2033
- Table 14: United States Sour Cream Industry Volume (K Ton) Forecast, by Application 2020 & 2033
- Table 15: Canada Sour Cream Industry Revenue (billion) Forecast, by Application 2020 & 2033
- Table 16: Canada Sour Cream Industry Volume (K Ton) Forecast, by Application 2020 & 2033
- Table 17: Mexico Sour Cream Industry Revenue (billion) Forecast, by Application 2020 & 2033
- Table 18: Mexico Sour Cream Industry Volume (K Ton) Forecast, by Application 2020 & 2033
- Table 19: Rest of North America Sour Cream Industry Revenue (billion) Forecast, by Application 2020 & 2033
- Table 20: Rest of North America Sour Cream Industry Volume (K Ton) Forecast, by Application 2020 & 2033
- Table 21: Global Sour Cream Industry Revenue billion Forecast, by Type 2020 & 2033
- Table 22: Global Sour Cream Industry Volume K Ton Forecast, by Type 2020 & 2033
- Table 23: Global Sour Cream Industry Revenue billion Forecast, by Distribution Channel 2020 & 2033
- Table 24: Global Sour Cream Industry Volume K Ton Forecast, by Distribution Channel 2020 & 2033
- Table 25: Global Sour Cream Industry Revenue billion Forecast, by Country 2020 & 2033
- Table 26: Global Sour Cream Industry Volume K Ton Forecast, by Country 2020 & 2033
- Table 27: Spain Sour Cream Industry Revenue (billion) Forecast, by Application 2020 & 2033
- Table 28: Spain Sour Cream Industry Volume (K Ton) Forecast, by Application 2020 & 2033
- Table 29: United Kingdom Sour Cream Industry Revenue (billion) Forecast, by Application 2020 & 2033
- Table 30: United Kingdom Sour Cream Industry Volume (K Ton) Forecast, by Application 2020 & 2033
- Table 31: France Sour Cream Industry Revenue (billion) Forecast, by Application 2020 & 2033
- Table 32: France Sour Cream Industry Volume (K Ton) Forecast, by Application 2020 & 2033
- Table 33: Germany Sour Cream Industry Revenue (billion) Forecast, by Application 2020 & 2033
- Table 34: Germany Sour Cream Industry Volume (K Ton) Forecast, by Application 2020 & 2033
- Table 35: Russia Sour Cream Industry Revenue (billion) Forecast, by Application 2020 & 2033
- Table 36: Russia Sour Cream Industry Volume (K Ton) Forecast, by Application 2020 & 2033
- Table 37: Italy Sour Cream Industry Revenue (billion) Forecast, by Application 2020 & 2033
- Table 38: Italy Sour Cream Industry Volume (K Ton) Forecast, by Application 2020 & 2033
- Table 39: Rest of Europe Sour Cream Industry Revenue (billion) Forecast, by Application 2020 & 2033
- Table 40: Rest of Europe Sour Cream Industry Volume (K Ton) Forecast, by Application 2020 & 2033
- Table 41: Global Sour Cream Industry Revenue billion Forecast, by Type 2020 & 2033
- Table 42: Global Sour Cream Industry Volume K Ton Forecast, by Type 2020 & 2033
- Table 43: Global Sour Cream Industry Revenue billion Forecast, by Distribution Channel 2020 & 2033
- Table 44: Global Sour Cream Industry Volume K Ton Forecast, by Distribution Channel 2020 & 2033
- Table 45: Global Sour Cream Industry Revenue billion Forecast, by Country 2020 & 2033
- Table 46: Global Sour Cream Industry Volume K Ton Forecast, by Country 2020 & 2033
- Table 47: China Sour Cream Industry Revenue (billion) Forecast, by Application 2020 & 2033
- Table 48: China Sour Cream Industry Volume (K Ton) Forecast, by Application 2020 & 2033
- Table 49: Japan Sour Cream Industry Revenue (billion) Forecast, by Application 2020 & 2033
- Table 50: Japan Sour Cream Industry Volume (K Ton) Forecast, by Application 2020 & 2033
- Table 51: India Sour Cream Industry Revenue (billion) Forecast, by Application 2020 & 2033
- Table 52: India Sour Cream Industry Volume (K Ton) Forecast, by Application 2020 & 2033
- Table 53: Australia Sour Cream Industry Revenue (billion) Forecast, by Application 2020 & 2033
- Table 54: Australia Sour Cream Industry Volume (K Ton) Forecast, by Application 2020 & 2033
- Table 55: Rest of Asia Pacific Sour Cream Industry Revenue (billion) Forecast, by Application 2020 & 2033
- Table 56: Rest of Asia Pacific Sour Cream Industry Volume (K Ton) Forecast, by Application 2020 & 2033
- Table 57: Global Sour Cream Industry Revenue billion Forecast, by Type 2020 & 2033
- Table 58: Global Sour Cream Industry Volume K Ton Forecast, by Type 2020 & 2033
- Table 59: Global Sour Cream Industry Revenue billion Forecast, by Distribution Channel 2020 & 2033
- Table 60: Global Sour Cream Industry Volume K Ton Forecast, by Distribution Channel 2020 & 2033
- Table 61: Global Sour Cream Industry Revenue billion Forecast, by Country 2020 & 2033
- Table 62: Global Sour Cream Industry Volume K Ton Forecast, by Country 2020 & 2033
- Table 63: Brazil Sour Cream Industry Revenue (billion) Forecast, by Application 2020 & 2033
- Table 64: Brazil Sour Cream Industry Volume (K Ton) Forecast, by Application 2020 & 2033
- Table 65: Argentina Sour Cream Industry Revenue (billion) Forecast, by Application 2020 & 2033
- Table 66: Argentina Sour Cream Industry Volume (K Ton) Forecast, by Application 2020 & 2033
- Table 67: Rest of South America Sour Cream Industry Revenue (billion) Forecast, by Application 2020 & 2033
- Table 68: Rest of South America Sour Cream Industry Volume (K Ton) Forecast, by Application 2020 & 2033
- Table 69: Global Sour Cream Industry Revenue billion Forecast, by Type 2020 & 2033
- Table 70: Global Sour Cream Industry Volume K Ton Forecast, by Type 2020 & 2033
- Table 71: Global Sour Cream Industry Revenue billion Forecast, by Distribution Channel 2020 & 2033
- Table 72: Global Sour Cream Industry Volume K Ton Forecast, by Distribution Channel 2020 & 2033
- Table 73: Global Sour Cream Industry Revenue billion Forecast, by Country 2020 & 2033
- Table 74: Global Sour Cream Industry Volume K Ton Forecast, by Country 2020 & 2033
- Table 75: South Africa Sour Cream Industry Revenue (billion) Forecast, by Application 2020 & 2033
- Table 76: South Africa Sour Cream Industry Volume (K Ton) Forecast, by Application 2020 & 2033
- Table 77: United Arab Emirates Sour Cream Industry Revenue (billion) Forecast, by Application 2020 & 2033
- Table 78: United Arab Emirates Sour Cream Industry Volume (K Ton) Forecast, by Application 2020 & 2033
- Table 79: Rest of Middle East and Africa Sour Cream Industry Revenue (billion) Forecast, by Application 2020 & 2033
- Table 80: Rest of Middle East and Africa Sour Cream Industry Volume (K Ton) Forecast, by Application 2020 & 2033
Frequently Asked Questions
1. What is the projected Compound Annual Growth Rate (CAGR) of the Sour Cream Industry?
The projected CAGR is approximately 6.5%.
2. Which companies are prominent players in the Sour Cream Industry?
Key companies in the market include Dean Foods, Green Valley Creamery, Prairie Farms Dairy, Organic Valley, Danone SA, The Kraft Heinz Company, Nestle SA, Fonterra Co-operative Group Limited, Laiterie Chalifoux, Daisy Brand LLC.
3. What are the main segments of the Sour Cream Industry?
The market segments include Type, Distribution Channel.
4. Can you provide details about the market size?
The market size is estimated to be USD 2.01 billion as of 2022.
5. What are some drivers contributing to market growth?
Increasing Sports Participation; Increasing Awareness about Health and Fitness.
6. What are the notable trends driving market growth?
Growing Demand for Lactose-free Sour Cream Products.
7. Are there any restraints impacting market growth?
Adverse Effects of Overconsumption of Products.
8. Can you provide examples of recent developments in the market?
January 2023: Violife launched its new dairy-free sour cream in the United States. This was in line with the company's aim to expand its presence in the dairy-free market in the country. Moreover, the product is available in around 883 Walmart stores in the country.
9. What pricing options are available for accessing the report?
Pricing options include single-user, multi-user, and enterprise licenses priced at USD 4750, USD 5250, and USD 8750 respectively.
10. Is the market size provided in terms of value or volume?
The market size is provided in terms of value, measured in billion and volume, measured in K Ton.
11. Are there any specific market keywords associated with the report?
Yes, the market keyword associated with the report is "Sour Cream Industry," which aids in identifying and referencing the specific market segment covered.
12. How do I determine which pricing option suits my needs best?
The pricing options vary based on user requirements and access needs. Individual users may opt for single-user licenses, while businesses requiring broader access may choose multi-user or enterprise licenses for cost-effective access to the report.
13. Are there any additional resources or data provided in the Sour Cream Industry report?
While the report offers comprehensive insights, it's advisable to review the specific contents or supplementary materials provided to ascertain if additional resources or data are available.
14. How can I stay updated on further developments or reports in the Sour Cream Industry?
To stay informed about further developments, trends, and reports in the Sour Cream Industry, consider subscribing to industry newsletters, following relevant companies and organizations, or regularly checking reputable industry news sources and publications.
Methodology
Step 1 - Identification of Relevant Samples Size from Population Database


Step 2 - Approaches for Defining Global Market Size (Value, Volume* & Price*)

Note*: In applicable scenarios
Step 3 - Data Sources
Primary Research
- Web Analytics
- Survey Reports
- Research Institute
- Latest Research Reports
- Opinion Leaders
Secondary Research
- Annual Reports
- White Paper
- Latest Press Release
- Industry Association
- Paid Database
- Investor Presentations

Step 4 - Data Triangulation
Involves using different sources of information in order to increase the validity of a study
These sources are likely to be stakeholders in a program - participants, other researchers, program staff, other community members, and so on.
Then we put all data in single framework & apply various statistical tools to find out the dynamic on the market.
During the analysis stage, feedback from the stakeholder groups would be compared to determine areas of agreement as well as areas of divergence