

Key Insights
The global soybean polysaccharides market, estimated at $221.71 million in the base year 2025, is poised for significant expansion. Projections indicate a Compound Annual Growth Rate (CAGR) of 8% from 2025 to 2033. This growth is propelled by escalating demand across the food & beverage, pharmaceutical, and cosmetic sectors. Key market drivers include heightened consumer awareness of soybean polysaccharides' health benefits, such as enhanced gut health and immune function, and a growing preference for natural, plant-based ingredients. Despite potential challenges like raw material price volatility and supply chain complexities, the market outlook remains robust. Continuous innovation in extraction and processing technologies, alongside the exploration of novel applications, will further stimulate growth. Leading market participants, including Fuji Oil Group and Weibo, are actively influencing the market through research, strategic alliances, and global expansion.
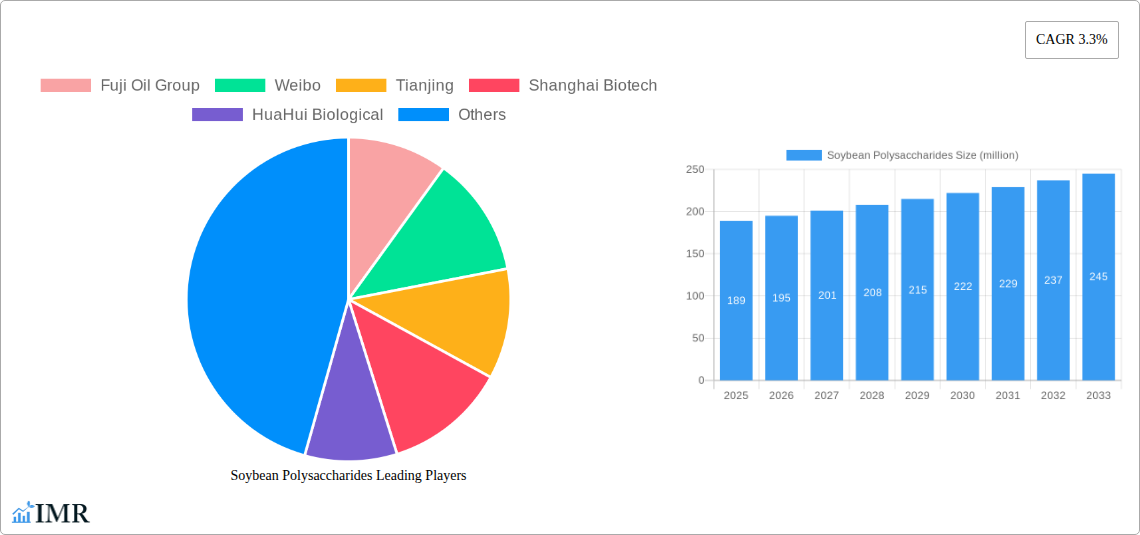
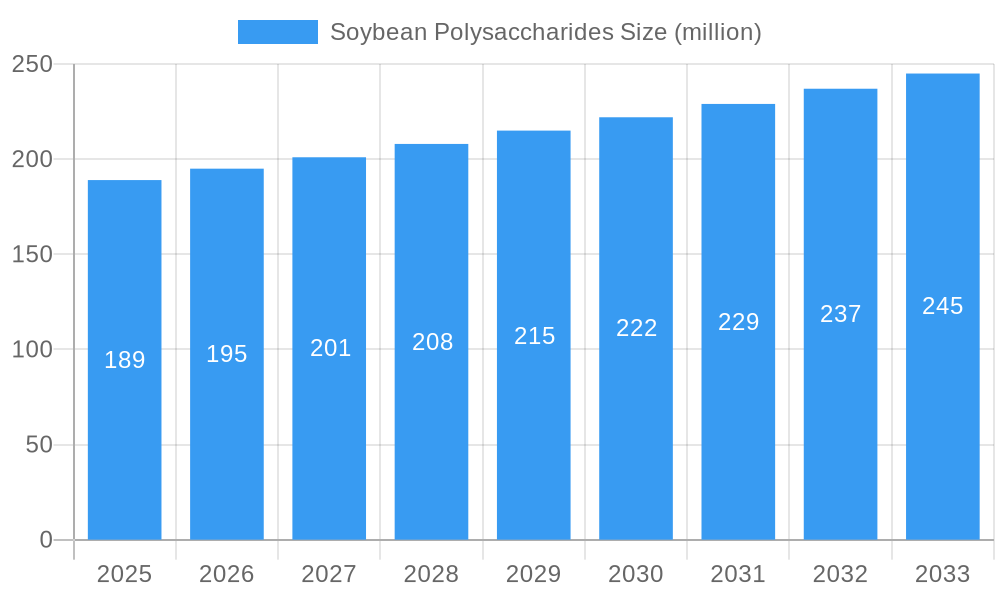
Soybean Polysaccharides Market Size (In Million)
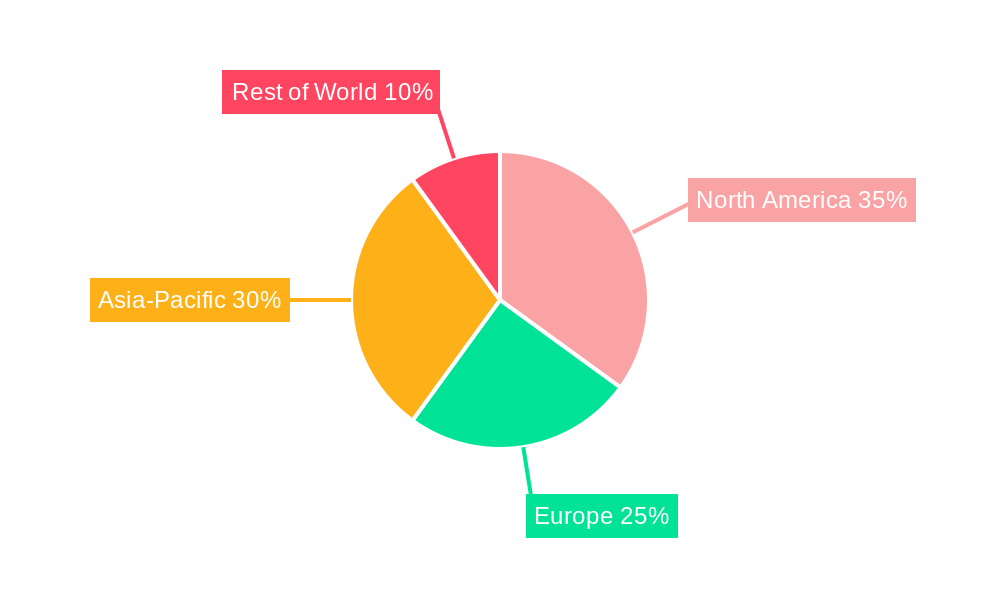
Market segmentation is anticipated to encompass variations by polysaccharide type (e.g., arabinogalactan, pectin), application sector (food, pharmaceuticals, cosmetics), and geographical distribution. Significant regional disparities are expected, with North America and Asia projected to hold substantial market shares due to high soybean production and consumption. Future success will depend on meeting consumer demand for sustainable and ethically sourced ingredients, alongside ongoing research into the diverse functional properties and potential applications of soybean polysaccharides.
Soybean Polysaccharides Company Market Share
This comprehensive report offers in-depth analysis and actionable intelligence for industry stakeholders, investors, and decision-makers. Covering a study period from 2019 to 2033, with a base year of 2025 and a forecast period from 2025 to 2033, the report utilizes extensive primary and secondary research to deliver granular market sizing and forecasts in million units for key segments within the food & beverage, pharmaceutical, and cosmetic industries.
Parent Market: Food & Beverage Additives; Child Market: Functional Food Ingredients
Soybean Polysaccharides Market Dynamics & Structure
The global soybean polysaccharide market is characterized by moderate concentration, with key players such as Fuji Oil Group, Weibo, Tianjing, Shanghai Biotech, HuaHui Biological, and Juyuan holding significant market share. However, the market is also witnessing the entry of several smaller players, leading to increased competition. Technological innovation, particularly in extraction and purification methods, is a major driver of market growth. Stringent regulatory frameworks concerning food safety and labeling influence market dynamics. While there are limited direct substitutes, other polysaccharides compete for market share. M&A activity in the sector remains moderate, with approximately xx deals recorded during the historical period (2019-2024), resulting in a xx% market share shift among the top players.
- Market Concentration: Moderately Concentrated (xx% market share held by top 5 players in 2024).
- Technological Innovation: Focus on efficient extraction, purification, and modification techniques.
- Regulatory Landscape: Compliance with food safety and labeling regulations is paramount.
- Competitive Substitutes: Other polysaccharides (e.g., xanthan gum, guar gum) pose competitive challenges.
- End-User Demographics: Growing demand from food and beverage, pharmaceutical, and cosmetic industries.
- M&A Trends: Moderate M&A activity, with xx deals concluded between 2019 and 2024.
Soybean Polysaccharides Growth Trends & Insights
The global soybean polysaccharides market experienced a CAGR of xx% during the historical period (2019-2024), reaching a market size of xx million units in 2024. This growth is primarily driven by increasing demand from the food and beverage industry, fueled by the growing awareness of health benefits associated with functional foods and dietary supplements. Technological advancements have streamlined production processes, improving cost efficiency and product quality. Changing consumer preferences towards natural and healthier food additives have also positively influenced market adoption. We project a CAGR of xx% during the forecast period (2025-2033), with the market size expected to reach xx million units by 2033. Market penetration is projected to increase from xx% in 2024 to xx% in 2033, driven by expanding applications in various end-use segments.
Dominant Regions, Countries, or Segments in Soybean Polysaccharides
The Asia-Pacific region holds the dominant position in the global soybean polysaccharides market, driven by the high consumption of soybean products and robust economic growth in countries like China and India. These nations exhibit favorable regulatory environments and substantial infrastructure supporting the production and distribution of soybean-derived ingredients. North America and Europe also represent significant markets, although their growth rates are slightly lower than that of the Asia-Pacific region.
- Key Drivers in Asia-Pacific: High soybean consumption, strong economic growth, favorable regulatory policies, and established supply chains.
- Dominance Factors: High demand, established production infrastructure, and cost-effective manufacturing.
- Growth Potential: Continued expansion in emerging economies and increasing demand for functional food ingredients.
Soybean Polysaccharides Product Landscape
Soybean polysaccharides are available in various forms, including powders, liquids, and modified derivatives. Recent innovations focus on enhancing functionality, such as improved solubility, stability, and viscosity. These advancements cater to specific needs across diverse applications, including food processing, pharmaceuticals, and cosmetics. Unique selling propositions include excellent emulsifying, thickening, and stabilizing properties, along with their natural origin and health benefits.
Key Drivers, Barriers & Challenges in Soybean Polysaccharides
Key Drivers: Growing demand for natural food additives, increasing health consciousness among consumers, and technological advancements in extraction and purification processes are key drivers of the market's growth. Favorable government regulations and policies promoting the use of sustainable ingredients also play a significant role.
Challenges: Fluctuations in soybean prices, stringent quality control requirements, and the presence of alternative polysaccharides pose challenges. Supply chain complexities and competitive pressure from other functional ingredients also need to be addressed. The impact of these challenges on market growth is estimated at xx% annually.
Emerging Opportunities in Soybean Polysaccharides
Emerging opportunities lie in the expansion into untapped markets (e.g., South America and Africa), development of novel applications (e.g., nutraceuticals and bioplastics), and customization of polysaccharides for specific industry requirements. The growing consumer preference for clean-label ingredients further presents opportunities for manufacturers.
Growth Accelerators in the Soybean Polysaccharides Industry
Technological breakthroughs in extraction and modification techniques are key growth catalysts. Strategic partnerships between soybean producers and downstream manufacturers facilitate efficient value chain management. Market expansion strategies focusing on emerging economies with high growth potential will significantly drive market growth in the coming years.
Key Players Shaping the Soybean Polysaccharides Market
- Fuji Oil Group
- Tianjing
- Shanghai Biotech
- HuaHui Biological
- Juyuan
Notable Milestones in Soybean Polysaccharides Sector
- 2020, Q3: Launch of a novel soybean polysaccharide derivative with enhanced stability by Shanghai Biotech.
- 2022, Q1: Acquisition of a smaller soybean processing facility by Fuji Oil Group, expanding its production capacity.
- 2023, Q4: Introduction of a new line of clean-label soybean polysaccharides by Weibo, targeting the organic food market. (Further milestones to be added based on data availability).
In-Depth Soybean Polysaccharides Market Outlook
The soybean polysaccharide market is poised for substantial growth, driven by the confluence of increasing consumer demand for natural and functional ingredients, technological advancements, and strategic market expansions. The forecast period promises significant opportunities for players capable of innovating and adapting to evolving consumer preferences and market dynamics. Long-term strategic partnerships and investments in research and development will be crucial to achieving sustained market success.
Soybean Polysaccharides Segmentation
-
1. Application
- 1.1. Rice and Flour
- 1.2. Drinking
- 1.3. Biomedicine
- 1.4. Others
-
2. Type
- 2.1. Soybean Polysaccharides -A
- 2.2. Soybean Polysaccharides- B
Soybean Polysaccharides Segmentation By Geography
-
1. North America
- 1.1. United States
- 1.2. Canada
- 1.3. Mexico
-
2. South America
- 2.1. Brazil
- 2.2. Argentina
- 2.3. Rest of South America
-
3. Europe
- 3.1. United Kingdom
- 3.2. Germany
- 3.3. France
- 3.4. Italy
- 3.5. Spain
- 3.6. Russia
- 3.7. Benelux
- 3.8. Nordics
- 3.9. Rest of Europe
-
4. Middle East & Africa
- 4.1. Turkey
- 4.2. Israel
- 4.3. GCC
- 4.4. North Africa
- 4.5. South Africa
- 4.6. Rest of Middle East & Africa
-
5. Asia Pacific
- 5.1. China
- 5.2. India
- 5.3. Japan
- 5.4. South Korea
- 5.5. ASEAN
- 5.6. Oceania
- 5.7. Rest of Asia Pacific
Soybean Polysaccharides Regional Market Share
Geographic Coverage of Soybean Polysaccharides
Soybean Polysaccharides REPORT HIGHLIGHTS
| Aspects | Details |
|---|---|
| Study Period | 2020-2034 |
| Base Year | 2025 |
| Estimated Year | 2026 |
| Forecast Period | 2026-2034 |
| Historical Period | 2020-2025 |
| Growth Rate | CAGR of 8% from 2020-2034 |
| Segmentation |
|
Table of Contents
- 1. Introduction
- 1.1. Research Scope
- 1.2. Market Segmentation
- 1.3. Research Methodology
- 1.4. Definitions and Assumptions
- 2. Executive Summary
- 2.1. Introduction
- 3. Market Dynamics
- 3.1. Introduction
- 3.2. Market Drivers
- 3.3. Market Restrains
- 3.4. Market Trends
- 4. Market Factor Analysis
- 4.1. Porters Five Forces
- 4.2. Supply/Value Chain
- 4.3. PESTEL analysis
- 4.4. Market Entropy
- 4.5. Patent/Trademark Analysis
- 5. Global Soybean Polysaccharides Analysis, Insights and Forecast, 2020-2032
- 5.1. Market Analysis, Insights and Forecast - by Application
- 5.1.1. Rice and Flour
- 5.1.2. Drinking
- 5.1.3. Biomedicine
- 5.1.4. Others
- 5.2. Market Analysis, Insights and Forecast - by Type
- 5.2.1. Soybean Polysaccharides -A
- 5.2.2. Soybean Polysaccharides- B
- 5.3. Market Analysis, Insights and Forecast - by Region
- 5.3.1. North America
- 5.3.2. South America
- 5.3.3. Europe
- 5.3.4. Middle East & Africa
- 5.3.5. Asia Pacific
- 5.1. Market Analysis, Insights and Forecast - by Application
- 6. North America Soybean Polysaccharides Analysis, Insights and Forecast, 2020-2032
- 6.1. Market Analysis, Insights and Forecast - by Application
- 6.1.1. Rice and Flour
- 6.1.2. Drinking
- 6.1.3. Biomedicine
- 6.1.4. Others
- 6.2. Market Analysis, Insights and Forecast - by Type
- 6.2.1. Soybean Polysaccharides -A
- 6.2.2. Soybean Polysaccharides- B
- 6.1. Market Analysis, Insights and Forecast - by Application
- 7. South America Soybean Polysaccharides Analysis, Insights and Forecast, 2020-2032
- 7.1. Market Analysis, Insights and Forecast - by Application
- 7.1.1. Rice and Flour
- 7.1.2. Drinking
- 7.1.3. Biomedicine
- 7.1.4. Others
- 7.2. Market Analysis, Insights and Forecast - by Type
- 7.2.1. Soybean Polysaccharides -A
- 7.2.2. Soybean Polysaccharides- B
- 7.1. Market Analysis, Insights and Forecast - by Application
- 8. Europe Soybean Polysaccharides Analysis, Insights and Forecast, 2020-2032
- 8.1. Market Analysis, Insights and Forecast - by Application
- 8.1.1. Rice and Flour
- 8.1.2. Drinking
- 8.1.3. Biomedicine
- 8.1.4. Others
- 8.2. Market Analysis, Insights and Forecast - by Type
- 8.2.1. Soybean Polysaccharides -A
- 8.2.2. Soybean Polysaccharides- B
- 8.1. Market Analysis, Insights and Forecast - by Application
- 9. Middle East & Africa Soybean Polysaccharides Analysis, Insights and Forecast, 2020-2032
- 9.1. Market Analysis, Insights and Forecast - by Application
- 9.1.1. Rice and Flour
- 9.1.2. Drinking
- 9.1.3. Biomedicine
- 9.1.4. Others
- 9.2. Market Analysis, Insights and Forecast - by Type
- 9.2.1. Soybean Polysaccharides -A
- 9.2.2. Soybean Polysaccharides- B
- 9.1. Market Analysis, Insights and Forecast - by Application
- 10. Asia Pacific Soybean Polysaccharides Analysis, Insights and Forecast, 2020-2032
- 10.1. Market Analysis, Insights and Forecast - by Application
- 10.1.1. Rice and Flour
- 10.1.2. Drinking
- 10.1.3. Biomedicine
- 10.1.4. Others
- 10.2. Market Analysis, Insights and Forecast - by Type
- 10.2.1. Soybean Polysaccharides -A
- 10.2.2. Soybean Polysaccharides- B
- 10.1. Market Analysis, Insights and Forecast - by Application
- 11. Competitive Analysis
- 11.1. Global Market Share Analysis 2025
- 11.2. Company Profiles
- 11.2.1 Fuji Oil Group
- 11.2.1.1. Overview
- 11.2.1.2. Products
- 11.2.1.3. SWOT Analysis
- 11.2.1.4. Recent Developments
- 11.2.1.5. Financials (Based on Availability)
- 11.2.2 Weibo
- 11.2.2.1. Overview
- 11.2.2.2. Products
- 11.2.2.3. SWOT Analysis
- 11.2.2.4. Recent Developments
- 11.2.2.5. Financials (Based on Availability)
- 11.2.3 Tianjing
- 11.2.3.1. Overview
- 11.2.3.2. Products
- 11.2.3.3. SWOT Analysis
- 11.2.3.4. Recent Developments
- 11.2.3.5. Financials (Based on Availability)
- 11.2.4 Shanghai Biotech
- 11.2.4.1. Overview
- 11.2.4.2. Products
- 11.2.4.3. SWOT Analysis
- 11.2.4.4. Recent Developments
- 11.2.4.5. Financials (Based on Availability)
- 11.2.5 HuaHui Biological
- 11.2.5.1. Overview
- 11.2.5.2. Products
- 11.2.5.3. SWOT Analysis
- 11.2.5.4. Recent Developments
- 11.2.5.5. Financials (Based on Availability)
- 11.2.6 Juyuan
- 11.2.6.1. Overview
- 11.2.6.2. Products
- 11.2.6.3. SWOT Analysis
- 11.2.6.4. Recent Developments
- 11.2.6.5. Financials (Based on Availability)
- 11.2.1 Fuji Oil Group
List of Figures
- Figure 1: Global Soybean Polysaccharides Revenue Breakdown (million, %) by Region 2025 & 2033
- Figure 2: North America Soybean Polysaccharides Revenue (million), by Application 2025 & 2033
- Figure 3: North America Soybean Polysaccharides Revenue Share (%), by Application 2025 & 2033
- Figure 4: North America Soybean Polysaccharides Revenue (million), by Type 2025 & 2033
- Figure 5: North America Soybean Polysaccharides Revenue Share (%), by Type 2025 & 2033
- Figure 6: North America Soybean Polysaccharides Revenue (million), by Country 2025 & 2033
- Figure 7: North America Soybean Polysaccharides Revenue Share (%), by Country 2025 & 2033
- Figure 8: South America Soybean Polysaccharides Revenue (million), by Application 2025 & 2033
- Figure 9: South America Soybean Polysaccharides Revenue Share (%), by Application 2025 & 2033
- Figure 10: South America Soybean Polysaccharides Revenue (million), by Type 2025 & 2033
- Figure 11: South America Soybean Polysaccharides Revenue Share (%), by Type 2025 & 2033
- Figure 12: South America Soybean Polysaccharides Revenue (million), by Country 2025 & 2033
- Figure 13: South America Soybean Polysaccharides Revenue Share (%), by Country 2025 & 2033
- Figure 14: Europe Soybean Polysaccharides Revenue (million), by Application 2025 & 2033
- Figure 15: Europe Soybean Polysaccharides Revenue Share (%), by Application 2025 & 2033
- Figure 16: Europe Soybean Polysaccharides Revenue (million), by Type 2025 & 2033
- Figure 17: Europe Soybean Polysaccharides Revenue Share (%), by Type 2025 & 2033
- Figure 18: Europe Soybean Polysaccharides Revenue (million), by Country 2025 & 2033
- Figure 19: Europe Soybean Polysaccharides Revenue Share (%), by Country 2025 & 2033
- Figure 20: Middle East & Africa Soybean Polysaccharides Revenue (million), by Application 2025 & 2033
- Figure 21: Middle East & Africa Soybean Polysaccharides Revenue Share (%), by Application 2025 & 2033
- Figure 22: Middle East & Africa Soybean Polysaccharides Revenue (million), by Type 2025 & 2033
- Figure 23: Middle East & Africa Soybean Polysaccharides Revenue Share (%), by Type 2025 & 2033
- Figure 24: Middle East & Africa Soybean Polysaccharides Revenue (million), by Country 2025 & 2033
- Figure 25: Middle East & Africa Soybean Polysaccharides Revenue Share (%), by Country 2025 & 2033
- Figure 26: Asia Pacific Soybean Polysaccharides Revenue (million), by Application 2025 & 2033
- Figure 27: Asia Pacific Soybean Polysaccharides Revenue Share (%), by Application 2025 & 2033
- Figure 28: Asia Pacific Soybean Polysaccharides Revenue (million), by Type 2025 & 2033
- Figure 29: Asia Pacific Soybean Polysaccharides Revenue Share (%), by Type 2025 & 2033
- Figure 30: Asia Pacific Soybean Polysaccharides Revenue (million), by Country 2025 & 2033
- Figure 31: Asia Pacific Soybean Polysaccharides Revenue Share (%), by Country 2025 & 2033
List of Tables
- Table 1: Global Soybean Polysaccharides Revenue million Forecast, by Application 2020 & 2033
- Table 2: Global Soybean Polysaccharides Revenue million Forecast, by Type 2020 & 2033
- Table 3: Global Soybean Polysaccharides Revenue million Forecast, by Region 2020 & 2033
- Table 4: Global Soybean Polysaccharides Revenue million Forecast, by Application 2020 & 2033
- Table 5: Global Soybean Polysaccharides Revenue million Forecast, by Type 2020 & 2033
- Table 6: Global Soybean Polysaccharides Revenue million Forecast, by Country 2020 & 2033
- Table 7: United States Soybean Polysaccharides Revenue (million) Forecast, by Application 2020 & 2033
- Table 8: Canada Soybean Polysaccharides Revenue (million) Forecast, by Application 2020 & 2033
- Table 9: Mexico Soybean Polysaccharides Revenue (million) Forecast, by Application 2020 & 2033
- Table 10: Global Soybean Polysaccharides Revenue million Forecast, by Application 2020 & 2033
- Table 11: Global Soybean Polysaccharides Revenue million Forecast, by Type 2020 & 2033
- Table 12: Global Soybean Polysaccharides Revenue million Forecast, by Country 2020 & 2033
- Table 13: Brazil Soybean Polysaccharides Revenue (million) Forecast, by Application 2020 & 2033
- Table 14: Argentina Soybean Polysaccharides Revenue (million) Forecast, by Application 2020 & 2033
- Table 15: Rest of South America Soybean Polysaccharides Revenue (million) Forecast, by Application 2020 & 2033
- Table 16: Global Soybean Polysaccharides Revenue million Forecast, by Application 2020 & 2033
- Table 17: Global Soybean Polysaccharides Revenue million Forecast, by Type 2020 & 2033
- Table 18: Global Soybean Polysaccharides Revenue million Forecast, by Country 2020 & 2033
- Table 19: United Kingdom Soybean Polysaccharides Revenue (million) Forecast, by Application 2020 & 2033
- Table 20: Germany Soybean Polysaccharides Revenue (million) Forecast, by Application 2020 & 2033
- Table 21: France Soybean Polysaccharides Revenue (million) Forecast, by Application 2020 & 2033
- Table 22: Italy Soybean Polysaccharides Revenue (million) Forecast, by Application 2020 & 2033
- Table 23: Spain Soybean Polysaccharides Revenue (million) Forecast, by Application 2020 & 2033
- Table 24: Russia Soybean Polysaccharides Revenue (million) Forecast, by Application 2020 & 2033
- Table 25: Benelux Soybean Polysaccharides Revenue (million) Forecast, by Application 2020 & 2033
- Table 26: Nordics Soybean Polysaccharides Revenue (million) Forecast, by Application 2020 & 2033
- Table 27: Rest of Europe Soybean Polysaccharides Revenue (million) Forecast, by Application 2020 & 2033
- Table 28: Global Soybean Polysaccharides Revenue million Forecast, by Application 2020 & 2033
- Table 29: Global Soybean Polysaccharides Revenue million Forecast, by Type 2020 & 2033
- Table 30: Global Soybean Polysaccharides Revenue million Forecast, by Country 2020 & 2033
- Table 31: Turkey Soybean Polysaccharides Revenue (million) Forecast, by Application 2020 & 2033
- Table 32: Israel Soybean Polysaccharides Revenue (million) Forecast, by Application 2020 & 2033
- Table 33: GCC Soybean Polysaccharides Revenue (million) Forecast, by Application 2020 & 2033
- Table 34: North Africa Soybean Polysaccharides Revenue (million) Forecast, by Application 2020 & 2033
- Table 35: South Africa Soybean Polysaccharides Revenue (million) Forecast, by Application 2020 & 2033
- Table 36: Rest of Middle East & Africa Soybean Polysaccharides Revenue (million) Forecast, by Application 2020 & 2033
- Table 37: Global Soybean Polysaccharides Revenue million Forecast, by Application 2020 & 2033
- Table 38: Global Soybean Polysaccharides Revenue million Forecast, by Type 2020 & 2033
- Table 39: Global Soybean Polysaccharides Revenue million Forecast, by Country 2020 & 2033
- Table 40: China Soybean Polysaccharides Revenue (million) Forecast, by Application 2020 & 2033
- Table 41: India Soybean Polysaccharides Revenue (million) Forecast, by Application 2020 & 2033
- Table 42: Japan Soybean Polysaccharides Revenue (million) Forecast, by Application 2020 & 2033
- Table 43: South Korea Soybean Polysaccharides Revenue (million) Forecast, by Application 2020 & 2033
- Table 44: ASEAN Soybean Polysaccharides Revenue (million) Forecast, by Application 2020 & 2033
- Table 45: Oceania Soybean Polysaccharides Revenue (million) Forecast, by Application 2020 & 2033
- Table 46: Rest of Asia Pacific Soybean Polysaccharides Revenue (million) Forecast, by Application 2020 & 2033
Frequently Asked Questions
1. What is the projected Compound Annual Growth Rate (CAGR) of the Soybean Polysaccharides?
The projected CAGR is approximately 8%.
2. Which companies are prominent players in the Soybean Polysaccharides?
Key companies in the market include Fuji Oil Group, Weibo, Tianjing, Shanghai Biotech, HuaHui Biological, Juyuan.
3. What are the main segments of the Soybean Polysaccharides?
The market segments include Application, Type.
4. Can you provide details about the market size?
The market size is estimated to be USD 221.71 million as of 2022.
5. What are some drivers contributing to market growth?
N/A
6. What are the notable trends driving market growth?
N/A
7. Are there any restraints impacting market growth?
N/A
8. Can you provide examples of recent developments in the market?
N/A
9. What pricing options are available for accessing the report?
Pricing options include single-user, multi-user, and enterprise licenses priced at USD 4250.00, USD 6375.00, and USD 8500.00 respectively.
10. Is the market size provided in terms of value or volume?
The market size is provided in terms of value, measured in million.
11. Are there any specific market keywords associated with the report?
Yes, the market keyword associated with the report is "Soybean Polysaccharides," which aids in identifying and referencing the specific market segment covered.
12. How do I determine which pricing option suits my needs best?
The pricing options vary based on user requirements and access needs. Individual users may opt for single-user licenses, while businesses requiring broader access may choose multi-user or enterprise licenses for cost-effective access to the report.
13. Are there any additional resources or data provided in the Soybean Polysaccharides report?
While the report offers comprehensive insights, it's advisable to review the specific contents or supplementary materials provided to ascertain if additional resources or data are available.
14. How can I stay updated on further developments or reports in the Soybean Polysaccharides?
To stay informed about further developments, trends, and reports in the Soybean Polysaccharides, consider subscribing to industry newsletters, following relevant companies and organizations, or regularly checking reputable industry news sources and publications.
Methodology
Step 1 - Identification of Relevant Samples Size from Population Database


Step 2 - Approaches for Defining Global Market Size (Value, Volume* & Price*)

Note*: In applicable scenarios
Step 3 - Data Sources
Primary Research
- Web Analytics
- Survey Reports
- Research Institute
- Latest Research Reports
- Opinion Leaders
Secondary Research
- Annual Reports
- White Paper
- Latest Press Release
- Industry Association
- Paid Database
- Investor Presentations

Step 4 - Data Triangulation
Involves using different sources of information in order to increase the validity of a study
These sources are likely to be stakeholders in a program - participants, other researchers, program staff, other community members, and so on.
Then we put all data in single framework & apply various statistical tools to find out the dynamic on the market.
During the analysis stage, feedback from the stakeholder groups would be compared to determine areas of agreement as well as areas of divergence