

Key Insights
The global spreadable cheese market is projected for significant growth, forecasted to reach $1.12 billion by 2024, with a Compound Annual Growth Rate (CAGR) of 4.2% through 2033. This expansion is propelled by shifting consumer demands for convenient, ready-to-eat food solutions and a growing appetite for diverse dairy product flavors. The rising popularity of snacking and the inherent versatility of spreadable cheeses in culinary applications, from breakfast toast to gourmet dips, are key growth accelerators. Technological advancements improving shelf-life and texture, alongside innovative product development including plant-based alternatives for health-conscious consumers, are further driving market penetration. The commercial sector, particularly foodservice, is a substantial contributor due to its need for high-quality, user-friendly ingredients.
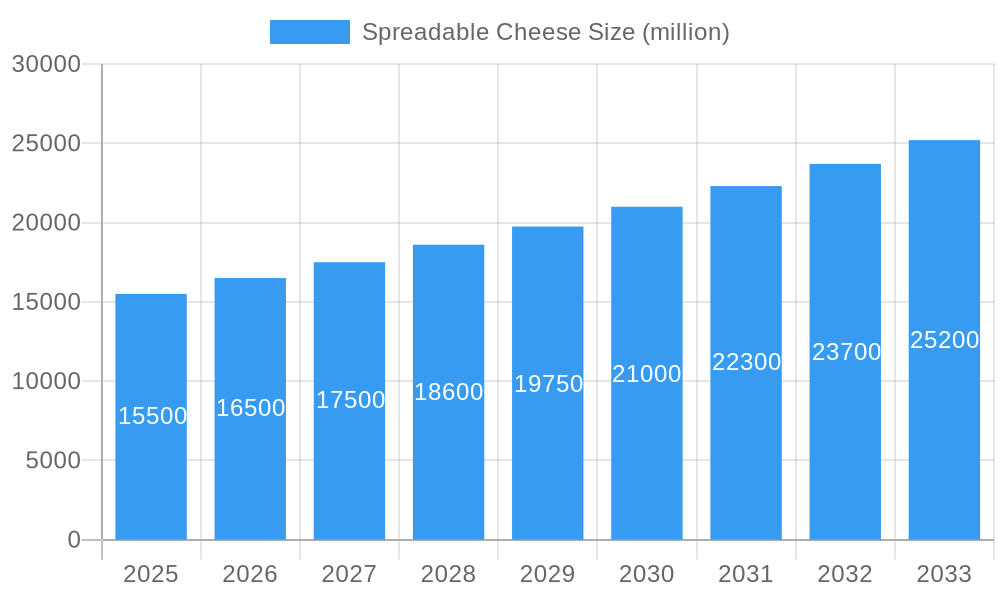
Spreadable Cheese Market Size (In Billion)
While market dynamics are positive, challenges such as volatile raw material costs (especially milk) and competition from alternative spreads pose potential restraints. Nevertheless, market resilience and a focus on product differentiation are expected to mitigate these factors. Processed and cream cheese segments currently dominate due to their widespread acceptance and established market presence. Geographically, North America and Europe lead due to high disposable incomes and established dairy consumption. The Asia Pacific region offers substantial growth potential, driven by rapid urbanization, a growing middle class, and increasing adoption of Western dietary habits. Emerging markets in the Middle East and Africa also show promising growth prospects, supported by strategic market penetration and rising demand for convenient food options.
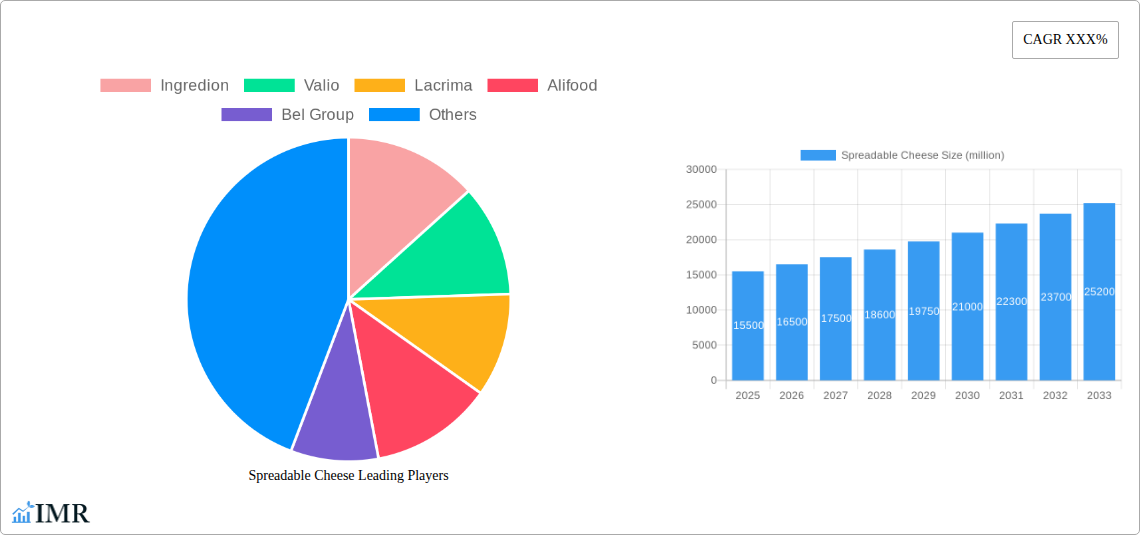
Spreadable Cheese Company Market Share
Spreadable Cheese Market Analysis: A Comprehensive Report (2019–2033)
This in-depth report provides a strategic overview of the global Spreadable Cheese market, encompassing detailed analysis from 2019 to 2033, with a base year of 2025 and a forecast period of 2025–2033. Covering both parent and child market segments, this report is designed to equip industry professionals with actionable insights to navigate the dynamic spreadable cheese landscape. All values are presented in million units, offering a clear quantitative perspective on market evolution.
Spreadable Cheese Market Dynamics & Structure
The global spreadable cheese market exhibits a moderately concentrated structure, characterized by the presence of several large multinational corporations and a growing number of regional and niche players. Technological innovation is a primary driver, with companies investing heavily in new product development to cater to evolving consumer preferences for healthier, flavored, and convenience-oriented options. Regulatory frameworks, particularly concerning food safety and labeling, play a significant role in shaping market entry and product formulation. Competitive product substitutes, such as dips, hummus, and other dairy or non-dairy spreads, present ongoing challenges. End-user demographics reveal a strong demand from household consumers seeking quick meal solutions and commercial sectors, including foodservice and catering, that require versatile and easily deployable ingredients. Mergers and acquisitions (M&A) trends are prevalent as larger players seek to expand their product portfolios and geographic reach, as well as acquire innovative technologies or brands. For instance, the period saw an estimated X M&A deals annually. Innovation barriers include high research and development costs and the need for stringent quality control.
- Market Concentration: Moderate, with key players holding significant shares.
- Technological Innovation Drivers: Demand for novel flavors, healthier formulations, and extended shelf-life.
- Regulatory Frameworks: Strict adherence to food safety standards and labeling regulations is paramount.
- Competitive Product Substitutes: Dips, hummus, vegan cheese alternatives.
- End-User Demographics: Growth driven by both household consumption and commercial applications in foodservice.
- M&A Trends: Strategic acquisitions to enhance market presence and product offerings.
Spreadable Cheese Growth Trends & Insights
The spreadable cheese market is poised for robust growth, driven by a confluence of evolving consumer lifestyles, increasing disposable incomes in emerging economies, and a growing demand for convenient and versatile food products. The global market size is projected to witness a Compound Annual Growth Rate (CAGR) of approximately 5.5% from 2025 to 2033. Adoption rates for spreadable cheese products are steadily increasing across both developed and developing regions, as consumers seek quick and easy meal solutions for busy schedules. Technological disruptions are playing a crucial role, with advancements in processing techniques leading to improved texture, shelf-life, and the incorporation of diverse flavor profiles and functional ingredients, such as probiotics and omega-3s. Consumer behavior shifts, including a growing preference for healthier options and a willingness to explore premium and artisanal spreadable cheeses, are further accelerating market penetration. The estimated market penetration in the household segment is expected to reach 75% by 2033. This evolution is supported by an increased focus on product innovation and targeted marketing strategies that appeal to specific dietary needs and taste preferences.
Dominant Regions, Countries, or Segments in Spreadable Cheese
North America currently stands as the dominant region in the global spreadable cheese market, driven by established consumer preferences for convenience foods and a well-developed retail and foodservice infrastructure. The United States, in particular, is a significant contributor, with a high per capita consumption of processed and cream cheese variants. Economic policies supporting the dairy industry and robust supply chains further bolster its leadership position. Within the broader market, the Processed Cheese segment within the Household application is a primary growth engine. This dominance is attributed to its versatility, affordability, and widespread availability across various retail channels, making it a staple in many households for sandwiches, snacks, and cooking. The estimated market share of Processed Cheese in the Household segment is projected to be around 45% in 2025.
- Dominant Region: North America.
- Key Country: United States.
- Leading Segment: Processed Cheese (Application: Household).
- Key Drivers in North America: High consumer demand for convenience, strong dairy industry, extensive distribution networks.
- Factors Contributing to Segment Dominance: Versatility, cost-effectiveness, broad consumer appeal, and extensive product variety.
- Growth Potential: Emerging economies in Asia-Pacific and Latin America present significant future growth potential due to rising disposable incomes and changing dietary habits.
Spreadable Cheese Product Landscape
The spreadable cheese product landscape is characterized by continuous innovation, offering a wide array of textures, flavors, and functionalities. Beyond traditional processed and cream cheese, product development is increasingly focused on artisanal varieties, plant-based alternatives, and functional spreads infused with herbs, spices, and superfoods. Key applications range from simple sandwich toppings and dips to sophisticated culinary ingredients in appetizers and main courses. Performance metrics are increasingly emphasizing extended shelf-life, improved meltability, and enhanced nutritional profiles, such as reduced fat and sodium content. Unique selling propositions often revolve around premium ingredients, natural formulations, and unique flavor fusions, catering to a discerning consumer base. Technological advancements in emulsification and stabilization are crucial for achieving desired textures and preventing ingredient separation.
Key Drivers, Barriers & Challenges in Spreadable Cheese
The spreadable cheese market is propelled by several key drivers. Consumer demand for convenience and ready-to-eat food options is a primary force, fueled by increasingly busy lifestyles. Technological advancements in processing and formulation enable the creation of novel flavors and healthier alternatives, expanding product appeal. Growing awareness of the nutritional benefits of dairy products, coupled with rising disposable incomes globally, further fuels market expansion. Strategic partnerships and collaborations between ingredient suppliers and cheese manufacturers are also accelerating product development and market penetration.
However, the market faces significant challenges. Fluctuations in raw material prices, particularly milk and dairy-based ingredients, can impact production costs and profit margins. Stringent regulatory frameworks regarding food safety, labeling, and origin traceability can create barriers to entry for smaller players. Intense competition from both established brands and emerging alternatives, including plant-based spreads, necessitates continuous innovation and effective marketing strategies. Supply chain disruptions, as witnessed in recent years, can affect ingredient availability and distribution efficiency.
Emerging Opportunities in Spreadable Cheese
Emerging opportunities in the spreadable cheese sector lie in the burgeoning demand for clean-label and natural products, with minimal artificial ingredients. The significant growth potential of plant-based spreadable cheese alternatives, catering to vegan and lactose-intolerant consumers, presents a substantial untapped market. Furthermore, the development of functional spreadable cheeses, fortified with probiotics, vitamins, or minerals, aligns with growing consumer interest in health and wellness. Exploring innovative flavor profiles, such as exotic fruits, global spices, and savory blends, can also attract new consumer segments and drive product differentiation. Untapped markets in developing economies, with increasing urbanization and a growing middle class, offer substantial expansion possibilities.
Growth Accelerators in the Spreadable Cheese Industry
Catalysts driving long-term growth in the spreadable cheese industry include ongoing technological breakthroughs in dairy processing and ingredient science, enabling enhanced product quality and expanded functionality. Strategic partnerships between dairy cooperatives, ingredient suppliers, and food manufacturers are fostering collaborative innovation and efficient market access. Aggressive market expansion strategies, targeting emerging economies and underserved demographics, are crucial for sustained growth. The development of sustainable production methods and eco-friendly packaging solutions will also become increasingly important differentiators, appealing to environmentally conscious consumers and regulators.
Key Players Shaping the Spreadable Cheese Market
- Ingredion
- Valio
- Lacrima
- Alifood
- Bel Group
- Pine River
- Lactalis
- DANA Dairy
- Alouette
- Nestle
- Danone
- DFA
- Fonterra
- Arla Foods
- Belle Chevre
Notable Milestones in Spreadable Cheese Sector
- 2019: Increased focus on plant-based spreadable cheese alternatives emerges with new product launches.
- 2020: Supply chain disruptions highlight the need for resilient sourcing and production strategies.
- 2021: Innovations in flavor infusion and functional ingredients gain traction among consumers.
- 2022: Growing consumer demand for "clean label" products drives reformulation efforts.
- 2023: Strategic acquisitions by major dairy players aim to consolidate market share and expand product portfolios.
- 2024: Advancements in packaging technology offer improved shelf-life and convenience for spreadable cheese products.
In-Depth Spreadable Cheese Market Outlook
The future outlook for the spreadable cheese market is exceptionally promising, driven by sustained demand for convenience, evolving health and wellness trends, and continuous product innovation. Growth accelerators such as advancements in processing technology, the expansion of plant-based options, and strategic market penetration into emerging economies will fuel market expansion. Industry professionals can leverage these insights to identify strategic opportunities, optimize product portfolios, and capitalize on the dynamic evolution of the global spreadable cheese landscape. The focus on premiumization, natural ingredients, and diverse flavor profiles is expected to define the market's trajectory in the coming years.
Spreadable Cheese Segmentation
-
1. Application
- 1.1. Household
- 1.2. Commercial
-
2. Type
- 2.1. Processed Cheese
- 2.2. Cream Cheese
Spreadable Cheese Segmentation By Geography
-
1. North America
- 1.1. United States
- 1.2. Canada
- 1.3. Mexico
-
2. South America
- 2.1. Brazil
- 2.2. Argentina
- 2.3. Rest of South America
-
3. Europe
- 3.1. United Kingdom
- 3.2. Germany
- 3.3. France
- 3.4. Italy
- 3.5. Spain
- 3.6. Russia
- 3.7. Benelux
- 3.8. Nordics
- 3.9. Rest of Europe
-
4. Middle East & Africa
- 4.1. Turkey
- 4.2. Israel
- 4.3. GCC
- 4.4. North Africa
- 4.5. South Africa
- 4.6. Rest of Middle East & Africa
-
5. Asia Pacific
- 5.1. China
- 5.2. India
- 5.3. Japan
- 5.4. South Korea
- 5.5. ASEAN
- 5.6. Oceania
- 5.7. Rest of Asia Pacific
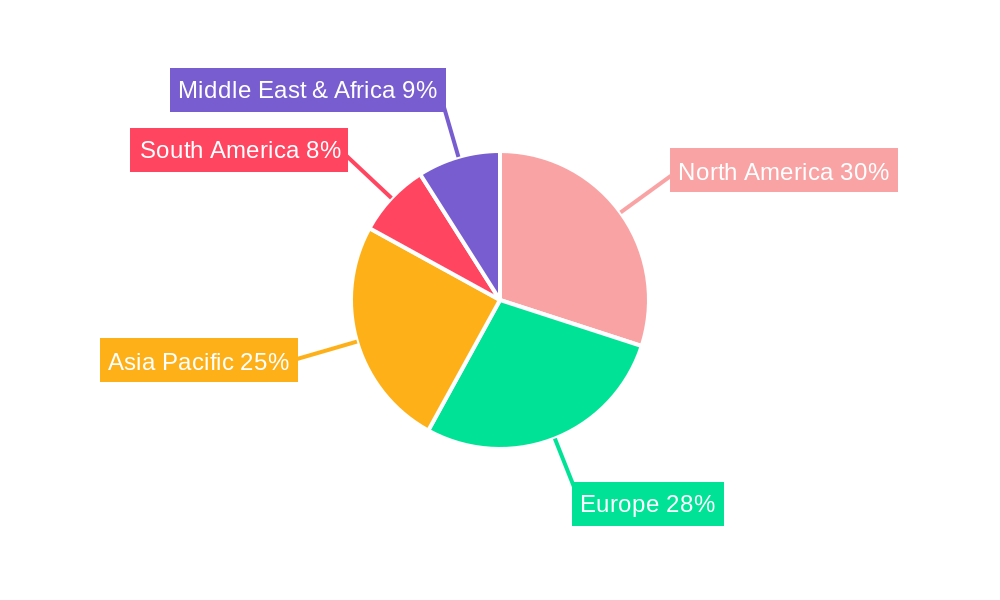
Spreadable Cheese Regional Market Share
Geographic Coverage of Spreadable Cheese
Spreadable Cheese REPORT HIGHLIGHTS
| Aspects | Details |
|---|---|
| Study Period | 2020-2034 |
| Base Year | 2025 |
| Estimated Year | 2026 |
| Forecast Period | 2026-2034 |
| Historical Period | 2020-2025 |
| Growth Rate | CAGR of 4.2% from 2020-2034 |
| Segmentation |
|
Table of Contents
- 1. Introduction
- 1.1. Research Scope
- 1.2. Market Segmentation
- 1.3. Research Methodology
- 1.4. Definitions and Assumptions
- 2. Executive Summary
- 2.1. Introduction
- 3. Market Dynamics
- 3.1. Introduction
- 3.2. Market Drivers
- 3.3. Market Restrains
- 3.4. Market Trends
- 4. Market Factor Analysis
- 4.1. Porters Five Forces
- 4.2. Supply/Value Chain
- 4.3. PESTEL analysis
- 4.4. Market Entropy
- 4.5. Patent/Trademark Analysis
- 5. Global Spreadable Cheese Analysis, Insights and Forecast, 2020-2032
- 5.1. Market Analysis, Insights and Forecast - by Application
- 5.1.1. Household
- 5.1.2. Commercial
- 5.2. Market Analysis, Insights and Forecast - by Type
- 5.2.1. Processed Cheese
- 5.2.2. Cream Cheese
- 5.3. Market Analysis, Insights and Forecast - by Region
- 5.3.1. North America
- 5.3.2. South America
- 5.3.3. Europe
- 5.3.4. Middle East & Africa
- 5.3.5. Asia Pacific
- 5.1. Market Analysis, Insights and Forecast - by Application
- 6. North America Spreadable Cheese Analysis, Insights and Forecast, 2020-2032
- 6.1. Market Analysis, Insights and Forecast - by Application
- 6.1.1. Household
- 6.1.2. Commercial
- 6.2. Market Analysis, Insights and Forecast - by Type
- 6.2.1. Processed Cheese
- 6.2.2. Cream Cheese
- 6.1. Market Analysis, Insights and Forecast - by Application
- 7. South America Spreadable Cheese Analysis, Insights and Forecast, 2020-2032
- 7.1. Market Analysis, Insights and Forecast - by Application
- 7.1.1. Household
- 7.1.2. Commercial
- 7.2. Market Analysis, Insights and Forecast - by Type
- 7.2.1. Processed Cheese
- 7.2.2. Cream Cheese
- 7.1. Market Analysis, Insights and Forecast - by Application
- 8. Europe Spreadable Cheese Analysis, Insights and Forecast, 2020-2032
- 8.1. Market Analysis, Insights and Forecast - by Application
- 8.1.1. Household
- 8.1.2. Commercial
- 8.2. Market Analysis, Insights and Forecast - by Type
- 8.2.1. Processed Cheese
- 8.2.2. Cream Cheese
- 8.1. Market Analysis, Insights and Forecast - by Application
- 9. Middle East & Africa Spreadable Cheese Analysis, Insights and Forecast, 2020-2032
- 9.1. Market Analysis, Insights and Forecast - by Application
- 9.1.1. Household
- 9.1.2. Commercial
- 9.2. Market Analysis, Insights and Forecast - by Type
- 9.2.1. Processed Cheese
- 9.2.2. Cream Cheese
- 9.1. Market Analysis, Insights and Forecast - by Application
- 10. Asia Pacific Spreadable Cheese Analysis, Insights and Forecast, 2020-2032
- 10.1. Market Analysis, Insights and Forecast - by Application
- 10.1.1. Household
- 10.1.2. Commercial
- 10.2. Market Analysis, Insights and Forecast - by Type
- 10.2.1. Processed Cheese
- 10.2.2. Cream Cheese
- 10.1. Market Analysis, Insights and Forecast - by Application
- 11. Competitive Analysis
- 11.1. Global Market Share Analysis 2025
- 11.2. Company Profiles
- 11.2.1 Ingredion
- 11.2.1.1. Overview
- 11.2.1.2. Products
- 11.2.1.3. SWOT Analysis
- 11.2.1.4. Recent Developments
- 11.2.1.5. Financials (Based on Availability)
- 11.2.2 Valio
- 11.2.2.1. Overview
- 11.2.2.2. Products
- 11.2.2.3. SWOT Analysis
- 11.2.2.4. Recent Developments
- 11.2.2.5. Financials (Based on Availability)
- 11.2.3 Lacrima
- 11.2.3.1. Overview
- 11.2.3.2. Products
- 11.2.3.3. SWOT Analysis
- 11.2.3.4. Recent Developments
- 11.2.3.5. Financials (Based on Availability)
- 11.2.4 Alifood
- 11.2.4.1. Overview
- 11.2.4.2. Products
- 11.2.4.3. SWOT Analysis
- 11.2.4.4. Recent Developments
- 11.2.4.5. Financials (Based on Availability)
- 11.2.5 Bel Group
- 11.2.5.1. Overview
- 11.2.5.2. Products
- 11.2.5.3. SWOT Analysis
- 11.2.5.4. Recent Developments
- 11.2.5.5. Financials (Based on Availability)
- 11.2.6 Pine River
- 11.2.6.1. Overview
- 11.2.6.2. Products
- 11.2.6.3. SWOT Analysis
- 11.2.6.4. Recent Developments
- 11.2.6.5. Financials (Based on Availability)
- 11.2.7 Lactalis
- 11.2.7.1. Overview
- 11.2.7.2. Products
- 11.2.7.3. SWOT Analysis
- 11.2.7.4. Recent Developments
- 11.2.7.5. Financials (Based on Availability)
- 11.2.8 DANA Dairy
- 11.2.8.1. Overview
- 11.2.8.2. Products
- 11.2.8.3. SWOT Analysis
- 11.2.8.4. Recent Developments
- 11.2.8.5. Financials (Based on Availability)
- 11.2.9 Alouette
- 11.2.9.1. Overview
- 11.2.9.2. Products
- 11.2.9.3. SWOT Analysis
- 11.2.9.4. Recent Developments
- 11.2.9.5. Financials (Based on Availability)
- 11.2.10 Nestle
- 11.2.10.1. Overview
- 11.2.10.2. Products
- 11.2.10.3. SWOT Analysis
- 11.2.10.4. Recent Developments
- 11.2.10.5. Financials (Based on Availability)
- 11.2.11 Danone
- 11.2.11.1. Overview
- 11.2.11.2. Products
- 11.2.11.3. SWOT Analysis
- 11.2.11.4. Recent Developments
- 11.2.11.5. Financials (Based on Availability)
- 11.2.12 DFA
- 11.2.12.1. Overview
- 11.2.12.2. Products
- 11.2.12.3. SWOT Analysis
- 11.2.12.4. Recent Developments
- 11.2.12.5. Financials (Based on Availability)
- 11.2.13 Fonterra
- 11.2.13.1. Overview
- 11.2.13.2. Products
- 11.2.13.3. SWOT Analysis
- 11.2.13.4. Recent Developments
- 11.2.13.5. Financials (Based on Availability)
- 11.2.14 Arla Foods
- 11.2.14.1. Overview
- 11.2.14.2. Products
- 11.2.14.3. SWOT Analysis
- 11.2.14.4. Recent Developments
- 11.2.14.5. Financials (Based on Availability)
- 11.2.15 Belle Chevre
- 11.2.15.1. Overview
- 11.2.15.2. Products
- 11.2.15.3. SWOT Analysis
- 11.2.15.4. Recent Developments
- 11.2.15.5. Financials (Based on Availability)
- 11.2.1 Ingredion
List of Figures
- Figure 1: Global Spreadable Cheese Revenue Breakdown (billion, %) by Region 2025 & 2033
- Figure 2: Global Spreadable Cheese Volume Breakdown (K, %) by Region 2025 & 2033
- Figure 3: North America Spreadable Cheese Revenue (billion), by Application 2025 & 2033
- Figure 4: North America Spreadable Cheese Volume (K), by Application 2025 & 2033
- Figure 5: North America Spreadable Cheese Revenue Share (%), by Application 2025 & 2033
- Figure 6: North America Spreadable Cheese Volume Share (%), by Application 2025 & 2033
- Figure 7: North America Spreadable Cheese Revenue (billion), by Type 2025 & 2033
- Figure 8: North America Spreadable Cheese Volume (K), by Type 2025 & 2033
- Figure 9: North America Spreadable Cheese Revenue Share (%), by Type 2025 & 2033
- Figure 10: North America Spreadable Cheese Volume Share (%), by Type 2025 & 2033
- Figure 11: North America Spreadable Cheese Revenue (billion), by Country 2025 & 2033
- Figure 12: North America Spreadable Cheese Volume (K), by Country 2025 & 2033
- Figure 13: North America Spreadable Cheese Revenue Share (%), by Country 2025 & 2033
- Figure 14: North America Spreadable Cheese Volume Share (%), by Country 2025 & 2033
- Figure 15: South America Spreadable Cheese Revenue (billion), by Application 2025 & 2033
- Figure 16: South America Spreadable Cheese Volume (K), by Application 2025 & 2033
- Figure 17: South America Spreadable Cheese Revenue Share (%), by Application 2025 & 2033
- Figure 18: South America Spreadable Cheese Volume Share (%), by Application 2025 & 2033
- Figure 19: South America Spreadable Cheese Revenue (billion), by Type 2025 & 2033
- Figure 20: South America Spreadable Cheese Volume (K), by Type 2025 & 2033
- Figure 21: South America Spreadable Cheese Revenue Share (%), by Type 2025 & 2033
- Figure 22: South America Spreadable Cheese Volume Share (%), by Type 2025 & 2033
- Figure 23: South America Spreadable Cheese Revenue (billion), by Country 2025 & 2033
- Figure 24: South America Spreadable Cheese Volume (K), by Country 2025 & 2033
- Figure 25: South America Spreadable Cheese Revenue Share (%), by Country 2025 & 2033
- Figure 26: South America Spreadable Cheese Volume Share (%), by Country 2025 & 2033
- Figure 27: Europe Spreadable Cheese Revenue (billion), by Application 2025 & 2033
- Figure 28: Europe Spreadable Cheese Volume (K), by Application 2025 & 2033
- Figure 29: Europe Spreadable Cheese Revenue Share (%), by Application 2025 & 2033
- Figure 30: Europe Spreadable Cheese Volume Share (%), by Application 2025 & 2033
- Figure 31: Europe Spreadable Cheese Revenue (billion), by Type 2025 & 2033
- Figure 32: Europe Spreadable Cheese Volume (K), by Type 2025 & 2033
- Figure 33: Europe Spreadable Cheese Revenue Share (%), by Type 2025 & 2033
- Figure 34: Europe Spreadable Cheese Volume Share (%), by Type 2025 & 2033
- Figure 35: Europe Spreadable Cheese Revenue (billion), by Country 2025 & 2033
- Figure 36: Europe Spreadable Cheese Volume (K), by Country 2025 & 2033
- Figure 37: Europe Spreadable Cheese Revenue Share (%), by Country 2025 & 2033
- Figure 38: Europe Spreadable Cheese Volume Share (%), by Country 2025 & 2033
- Figure 39: Middle East & Africa Spreadable Cheese Revenue (billion), by Application 2025 & 2033
- Figure 40: Middle East & Africa Spreadable Cheese Volume (K), by Application 2025 & 2033
- Figure 41: Middle East & Africa Spreadable Cheese Revenue Share (%), by Application 2025 & 2033
- Figure 42: Middle East & Africa Spreadable Cheese Volume Share (%), by Application 2025 & 2033
- Figure 43: Middle East & Africa Spreadable Cheese Revenue (billion), by Type 2025 & 2033
- Figure 44: Middle East & Africa Spreadable Cheese Volume (K), by Type 2025 & 2033
- Figure 45: Middle East & Africa Spreadable Cheese Revenue Share (%), by Type 2025 & 2033
- Figure 46: Middle East & Africa Spreadable Cheese Volume Share (%), by Type 2025 & 2033
- Figure 47: Middle East & Africa Spreadable Cheese Revenue (billion), by Country 2025 & 2033
- Figure 48: Middle East & Africa Spreadable Cheese Volume (K), by Country 2025 & 2033
- Figure 49: Middle East & Africa Spreadable Cheese Revenue Share (%), by Country 2025 & 2033
- Figure 50: Middle East & Africa Spreadable Cheese Volume Share (%), by Country 2025 & 2033
- Figure 51: Asia Pacific Spreadable Cheese Revenue (billion), by Application 2025 & 2033
- Figure 52: Asia Pacific Spreadable Cheese Volume (K), by Application 2025 & 2033
- Figure 53: Asia Pacific Spreadable Cheese Revenue Share (%), by Application 2025 & 2033
- Figure 54: Asia Pacific Spreadable Cheese Volume Share (%), by Application 2025 & 2033
- Figure 55: Asia Pacific Spreadable Cheese Revenue (billion), by Type 2025 & 2033
- Figure 56: Asia Pacific Spreadable Cheese Volume (K), by Type 2025 & 2033
- Figure 57: Asia Pacific Spreadable Cheese Revenue Share (%), by Type 2025 & 2033
- Figure 58: Asia Pacific Spreadable Cheese Volume Share (%), by Type 2025 & 2033
- Figure 59: Asia Pacific Spreadable Cheese Revenue (billion), by Country 2025 & 2033
- Figure 60: Asia Pacific Spreadable Cheese Volume (K), by Country 2025 & 2033
- Figure 61: Asia Pacific Spreadable Cheese Revenue Share (%), by Country 2025 & 2033
- Figure 62: Asia Pacific Spreadable Cheese Volume Share (%), by Country 2025 & 2033
List of Tables
- Table 1: Global Spreadable Cheese Revenue billion Forecast, by Application 2020 & 2033
- Table 2: Global Spreadable Cheese Volume K Forecast, by Application 2020 & 2033
- Table 3: Global Spreadable Cheese Revenue billion Forecast, by Type 2020 & 2033
- Table 4: Global Spreadable Cheese Volume K Forecast, by Type 2020 & 2033
- Table 5: Global Spreadable Cheese Revenue billion Forecast, by Region 2020 & 2033
- Table 6: Global Spreadable Cheese Volume K Forecast, by Region 2020 & 2033
- Table 7: Global Spreadable Cheese Revenue billion Forecast, by Application 2020 & 2033
- Table 8: Global Spreadable Cheese Volume K Forecast, by Application 2020 & 2033
- Table 9: Global Spreadable Cheese Revenue billion Forecast, by Type 2020 & 2033
- Table 10: Global Spreadable Cheese Volume K Forecast, by Type 2020 & 2033
- Table 11: Global Spreadable Cheese Revenue billion Forecast, by Country 2020 & 2033
- Table 12: Global Spreadable Cheese Volume K Forecast, by Country 2020 & 2033
- Table 13: United States Spreadable Cheese Revenue (billion) Forecast, by Application 2020 & 2033
- Table 14: United States Spreadable Cheese Volume (K) Forecast, by Application 2020 & 2033
- Table 15: Canada Spreadable Cheese Revenue (billion) Forecast, by Application 2020 & 2033
- Table 16: Canada Spreadable Cheese Volume (K) Forecast, by Application 2020 & 2033
- Table 17: Mexico Spreadable Cheese Revenue (billion) Forecast, by Application 2020 & 2033
- Table 18: Mexico Spreadable Cheese Volume (K) Forecast, by Application 2020 & 2033
- Table 19: Global Spreadable Cheese Revenue billion Forecast, by Application 2020 & 2033
- Table 20: Global Spreadable Cheese Volume K Forecast, by Application 2020 & 2033
- Table 21: Global Spreadable Cheese Revenue billion Forecast, by Type 2020 & 2033
- Table 22: Global Spreadable Cheese Volume K Forecast, by Type 2020 & 2033
- Table 23: Global Spreadable Cheese Revenue billion Forecast, by Country 2020 & 2033
- Table 24: Global Spreadable Cheese Volume K Forecast, by Country 2020 & 2033
- Table 25: Brazil Spreadable Cheese Revenue (billion) Forecast, by Application 2020 & 2033
- Table 26: Brazil Spreadable Cheese Volume (K) Forecast, by Application 2020 & 2033
- Table 27: Argentina Spreadable Cheese Revenue (billion) Forecast, by Application 2020 & 2033
- Table 28: Argentina Spreadable Cheese Volume (K) Forecast, by Application 2020 & 2033
- Table 29: Rest of South America Spreadable Cheese Revenue (billion) Forecast, by Application 2020 & 2033
- Table 30: Rest of South America Spreadable Cheese Volume (K) Forecast, by Application 2020 & 2033
- Table 31: Global Spreadable Cheese Revenue billion Forecast, by Application 2020 & 2033
- Table 32: Global Spreadable Cheese Volume K Forecast, by Application 2020 & 2033
- Table 33: Global Spreadable Cheese Revenue billion Forecast, by Type 2020 & 2033
- Table 34: Global Spreadable Cheese Volume K Forecast, by Type 2020 & 2033
- Table 35: Global Spreadable Cheese Revenue billion Forecast, by Country 2020 & 2033
- Table 36: Global Spreadable Cheese Volume K Forecast, by Country 2020 & 2033
- Table 37: United Kingdom Spreadable Cheese Revenue (billion) Forecast, by Application 2020 & 2033
- Table 38: United Kingdom Spreadable Cheese Volume (K) Forecast, by Application 2020 & 2033
- Table 39: Germany Spreadable Cheese Revenue (billion) Forecast, by Application 2020 & 2033
- Table 40: Germany Spreadable Cheese Volume (K) Forecast, by Application 2020 & 2033
- Table 41: France Spreadable Cheese Revenue (billion) Forecast, by Application 2020 & 2033
- Table 42: France Spreadable Cheese Volume (K) Forecast, by Application 2020 & 2033
- Table 43: Italy Spreadable Cheese Revenue (billion) Forecast, by Application 2020 & 2033
- Table 44: Italy Spreadable Cheese Volume (K) Forecast, by Application 2020 & 2033
- Table 45: Spain Spreadable Cheese Revenue (billion) Forecast, by Application 2020 & 2033
- Table 46: Spain Spreadable Cheese Volume (K) Forecast, by Application 2020 & 2033
- Table 47: Russia Spreadable Cheese Revenue (billion) Forecast, by Application 2020 & 2033
- Table 48: Russia Spreadable Cheese Volume (K) Forecast, by Application 2020 & 2033
- Table 49: Benelux Spreadable Cheese Revenue (billion) Forecast, by Application 2020 & 2033
- Table 50: Benelux Spreadable Cheese Volume (K) Forecast, by Application 2020 & 2033
- Table 51: Nordics Spreadable Cheese Revenue (billion) Forecast, by Application 2020 & 2033
- Table 52: Nordics Spreadable Cheese Volume (K) Forecast, by Application 2020 & 2033
- Table 53: Rest of Europe Spreadable Cheese Revenue (billion) Forecast, by Application 2020 & 2033
- Table 54: Rest of Europe Spreadable Cheese Volume (K) Forecast, by Application 2020 & 2033
- Table 55: Global Spreadable Cheese Revenue billion Forecast, by Application 2020 & 2033
- Table 56: Global Spreadable Cheese Volume K Forecast, by Application 2020 & 2033
- Table 57: Global Spreadable Cheese Revenue billion Forecast, by Type 2020 & 2033
- Table 58: Global Spreadable Cheese Volume K Forecast, by Type 2020 & 2033
- Table 59: Global Spreadable Cheese Revenue billion Forecast, by Country 2020 & 2033
- Table 60: Global Spreadable Cheese Volume K Forecast, by Country 2020 & 2033
- Table 61: Turkey Spreadable Cheese Revenue (billion) Forecast, by Application 2020 & 2033
- Table 62: Turkey Spreadable Cheese Volume (K) Forecast, by Application 2020 & 2033
- Table 63: Israel Spreadable Cheese Revenue (billion) Forecast, by Application 2020 & 2033
- Table 64: Israel Spreadable Cheese Volume (K) Forecast, by Application 2020 & 2033
- Table 65: GCC Spreadable Cheese Revenue (billion) Forecast, by Application 2020 & 2033
- Table 66: GCC Spreadable Cheese Volume (K) Forecast, by Application 2020 & 2033
- Table 67: North Africa Spreadable Cheese Revenue (billion) Forecast, by Application 2020 & 2033
- Table 68: North Africa Spreadable Cheese Volume (K) Forecast, by Application 2020 & 2033
- Table 69: South Africa Spreadable Cheese Revenue (billion) Forecast, by Application 2020 & 2033
- Table 70: South Africa Spreadable Cheese Volume (K) Forecast, by Application 2020 & 2033
- Table 71: Rest of Middle East & Africa Spreadable Cheese Revenue (billion) Forecast, by Application 2020 & 2033
- Table 72: Rest of Middle East & Africa Spreadable Cheese Volume (K) Forecast, by Application 2020 & 2033
- Table 73: Global Spreadable Cheese Revenue billion Forecast, by Application 2020 & 2033
- Table 74: Global Spreadable Cheese Volume K Forecast, by Application 2020 & 2033
- Table 75: Global Spreadable Cheese Revenue billion Forecast, by Type 2020 & 2033
- Table 76: Global Spreadable Cheese Volume K Forecast, by Type 2020 & 2033
- Table 77: Global Spreadable Cheese Revenue billion Forecast, by Country 2020 & 2033
- Table 78: Global Spreadable Cheese Volume K Forecast, by Country 2020 & 2033
- Table 79: China Spreadable Cheese Revenue (billion) Forecast, by Application 2020 & 2033
- Table 80: China Spreadable Cheese Volume (K) Forecast, by Application 2020 & 2033
- Table 81: India Spreadable Cheese Revenue (billion) Forecast, by Application 2020 & 2033
- Table 82: India Spreadable Cheese Volume (K) Forecast, by Application 2020 & 2033
- Table 83: Japan Spreadable Cheese Revenue (billion) Forecast, by Application 2020 & 2033
- Table 84: Japan Spreadable Cheese Volume (K) Forecast, by Application 2020 & 2033
- Table 85: South Korea Spreadable Cheese Revenue (billion) Forecast, by Application 2020 & 2033
- Table 86: South Korea Spreadable Cheese Volume (K) Forecast, by Application 2020 & 2033
- Table 87: ASEAN Spreadable Cheese Revenue (billion) Forecast, by Application 2020 & 2033
- Table 88: ASEAN Spreadable Cheese Volume (K) Forecast, by Application 2020 & 2033
- Table 89: Oceania Spreadable Cheese Revenue (billion) Forecast, by Application 2020 & 2033
- Table 90: Oceania Spreadable Cheese Volume (K) Forecast, by Application 2020 & 2033
- Table 91: Rest of Asia Pacific Spreadable Cheese Revenue (billion) Forecast, by Application 2020 & 2033
- Table 92: Rest of Asia Pacific Spreadable Cheese Volume (K) Forecast, by Application 2020 & 2033
Frequently Asked Questions
1. What is the projected Compound Annual Growth Rate (CAGR) of the Spreadable Cheese?
The projected CAGR is approximately 4.2%.
2. Which companies are prominent players in the Spreadable Cheese?
Key companies in the market include Ingredion, Valio, Lacrima, Alifood, Bel Group, Pine River, Lactalis, DANA Dairy, Alouette, Nestle, Danone, DFA, Fonterra, Arla Foods, Belle Chevre.
3. What are the main segments of the Spreadable Cheese?
The market segments include Application, Type.
4. Can you provide details about the market size?
The market size is estimated to be USD 1.12 billion as of 2022.
5. What are some drivers contributing to market growth?
N/A
6. What are the notable trends driving market growth?
N/A
7. Are there any restraints impacting market growth?
N/A
8. Can you provide examples of recent developments in the market?
N/A
9. What pricing options are available for accessing the report?
Pricing options include single-user, multi-user, and enterprise licenses priced at USD 3950.00, USD 5925.00, and USD 7900.00 respectively.
10. Is the market size provided in terms of value or volume?
The market size is provided in terms of value, measured in billion and volume, measured in K.
11. Are there any specific market keywords associated with the report?
Yes, the market keyword associated with the report is "Spreadable Cheese," which aids in identifying and referencing the specific market segment covered.
12. How do I determine which pricing option suits my needs best?
The pricing options vary based on user requirements and access needs. Individual users may opt for single-user licenses, while businesses requiring broader access may choose multi-user or enterprise licenses for cost-effective access to the report.
13. Are there any additional resources or data provided in the Spreadable Cheese report?
While the report offers comprehensive insights, it's advisable to review the specific contents or supplementary materials provided to ascertain if additional resources or data are available.
14. How can I stay updated on further developments or reports in the Spreadable Cheese?
To stay informed about further developments, trends, and reports in the Spreadable Cheese, consider subscribing to industry newsletters, following relevant companies and organizations, or regularly checking reputable industry news sources and publications.
Methodology
Step 1 - Identification of Relevant Samples Size from Population Database


Step 2 - Approaches for Defining Global Market Size (Value, Volume* & Price*)

Note*: In applicable scenarios
Step 3 - Data Sources
Primary Research
- Web Analytics
- Survey Reports
- Research Institute
- Latest Research Reports
- Opinion Leaders
Secondary Research
- Annual Reports
- White Paper
- Latest Press Release
- Industry Association
- Paid Database
- Investor Presentations

Step 4 - Data Triangulation
Involves using different sources of information in order to increase the validity of a study
These sources are likely to be stakeholders in a program - participants, other researchers, program staff, other community members, and so on.
Then we put all data in single framework & apply various statistical tools to find out the dynamic on the market.
During the analysis stage, feedback from the stakeholder groups would be compared to determine areas of agreement as well as areas of divergence