

Key Insights
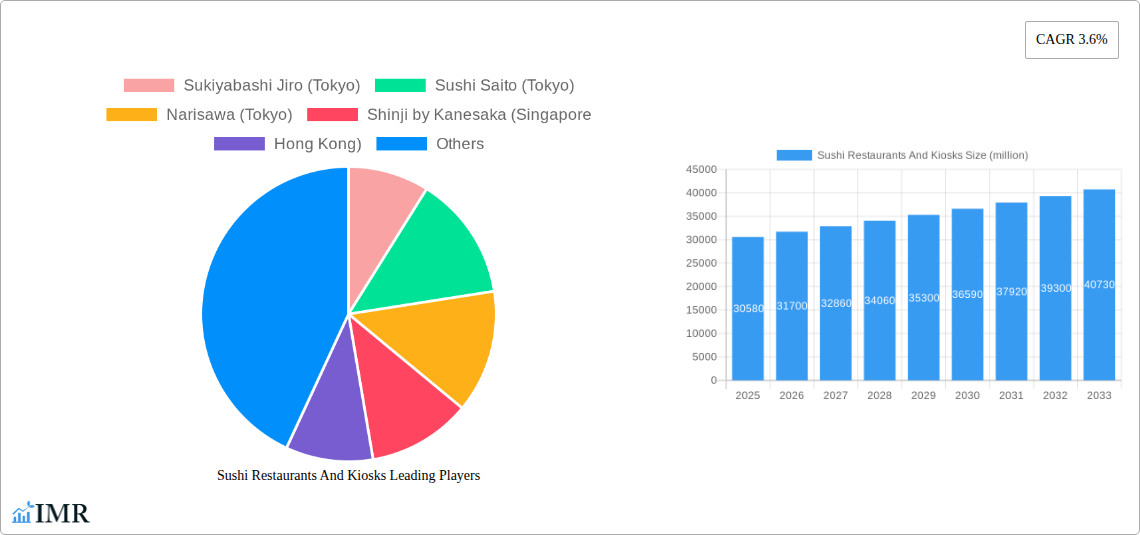
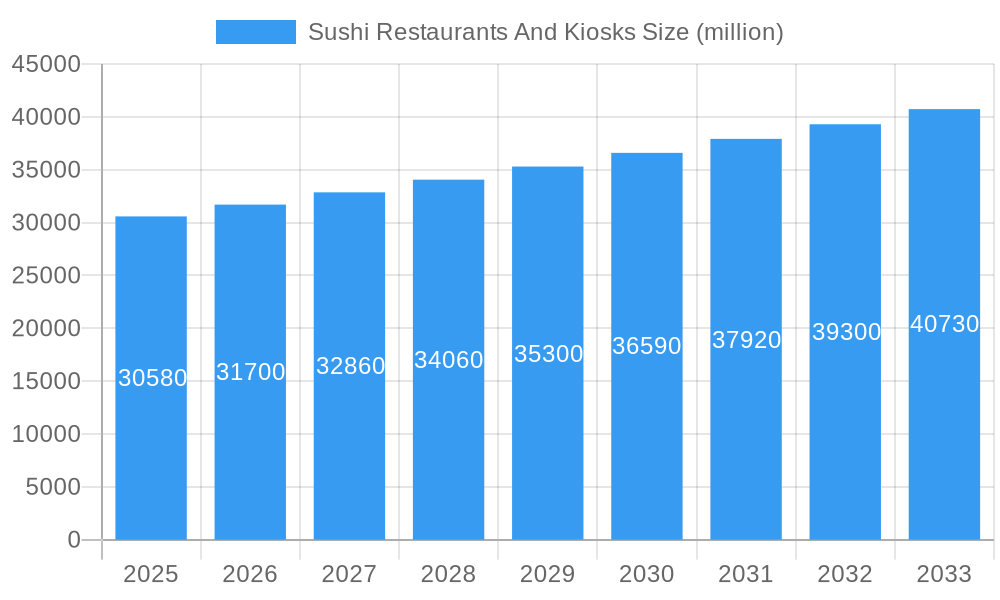
The global sushi restaurant and kiosk market, valued at $30.58 billion in 2025, is projected to experience steady growth, driven by several key factors. Rising disposable incomes, particularly in emerging economies, are fueling demand for premium dining experiences, including high-quality sushi. The increasing popularity of Japanese cuisine globally, fueled by social media trends and culinary tourism, contributes significantly to market expansion. Health-conscious consumers are also drawn to sushi's perceived health benefits, with its lean protein and emphasis on fresh ingredients. Further fueling growth is the innovative adaptation of traditional sushi concepts into modern, fast-casual formats like sushi kiosks and delivery services, expanding accessibility and catering to diverse consumer preferences. The market's competitive landscape includes both established high-end restaurants like Sukiyabashi Jiro and more accessible chains such as Genki Sushi, illustrating the diverse offerings catering to a broad spectrum of consumers.
Sushi Restaurants And Kiosks Market Size (In Billion)
However, several challenges exist. Fluctuations in seafood prices and supply chain disruptions can impact profitability and menu pricing. Maintaining consistent food quality and hygiene standards across various locations is crucial, especially in a globally expanding market. Competition from other fast-casual and quick-service restaurants also poses a threat, requiring continuous innovation and adaptation. Overcoming these challenges through strategic sourcing, efficient operations, and consistent brand messaging will be crucial for maintaining sustainable growth in the sushi restaurant and kiosk market. The forecast period of 2025-2033 suggests a trajectory of continued expansion, albeit at a moderated pace, given the inherent complexities of the industry. Expansion into new geographical markets, specifically in regions with burgeoning middle classes and a growing appreciation for Japanese culinary traditions, will be key to unlocking significant future growth potential.
Sushi Restaurants And Kiosks Company Market Share
This comprehensive report provides a detailed analysis of the global Sushi Restaurants and Kiosks market, encompassing its dynamics, growth trends, dominant regions, product landscape, key players, and future outlook. The study period covers 2019-2033, with 2025 as the base and estimated year. The report delves into both the parent market (restaurants) and the child market (kiosks), offering a granular view of this dynamic sector. Market values are presented in million units.
Sushi Restaurants And Kiosks Market Dynamics & Structure
This section analyzes the market concentration, technological innovation drivers, regulatory frameworks, competitive product substitutes, end-user demographics, and M&A trends within the sushi restaurant and kiosk industry.
The global sushi market is characterized by a diverse range of establishments, from high-end, Michelin-starred restaurants to casual kiosks and fast-casual chains. Market concentration is moderate, with a few high-profile brands commanding significant market share in specific regions, while a larger number of smaller, independent operators dominate the overall landscape. Technological innovation is driven by advancements in food preparation techniques, such as automated sushi rolling machines and improved ingredient sourcing and storage methods. Regulatory frameworks concerning food safety and hygiene standards significantly influence operations, particularly in developed markets. The market experiences competition from other cuisines and quick-service options, posing a constant challenge to market share. End-user demographics are expanding, with increasing consumer demand driving market growth across multiple income groups and age ranges. M&A activity has been moderate, primarily focused on strategic acquisitions by larger chains to expand their footprint and brand portfolio.
- Market Concentration: Moderately concentrated, with xx% market share held by top 5 players in 2025.
- Technological Innovation: Automation, improved ingredient sourcing, and online ordering systems are key drivers.
- Regulatory Framework: Stringent food safety and hygiene regulations impact operational costs and practices.
- Competitive Substitutes: Other fast-casual dining options and cuisines pose significant competition.
- End-User Demographics: Expanding consumer base across age groups and income levels.
- M&A Trends: Moderate activity, focused on expansion and brand consolidation; xx deals in the last five years.
Sushi Restaurants And Kiosks Growth Trends & Insights
Leveraging extensive primary and secondary research, this section analyzes the market size evolution, adoption rates, technological disruptions, and consumer behavior shifts within the sushi market. The market is witnessing a significant growth trajectory, fueled by increasing consumer demand, evolving culinary preferences, and the rise of innovative business models.
The global sushi restaurants and kiosks market exhibited a Compound Annual Growth Rate (CAGR) of xx% during the historical period (2019-2024), reaching a market size of $xx million in 2024. This growth is expected to continue throughout the forecast period (2025-2033), with a projected CAGR of xx%, driven by factors such as increasing disposable incomes, evolving consumer preferences towards healthier and convenient food options, and the expansion of the quick-service restaurant segment. Technological disruptions, such as online ordering platforms and delivery services, have significantly impacted market dynamics, expanding reach and convenience for consumers. Consumer behavior shifts include a greater demand for premium ingredients and unique dining experiences.
Market penetration of sushi restaurants and kiosks is expected to reach xx% by 2033, indicating significant market growth potential.
Dominant Regions, Countries, or Segments in Sushi Restaurants And Kiosks
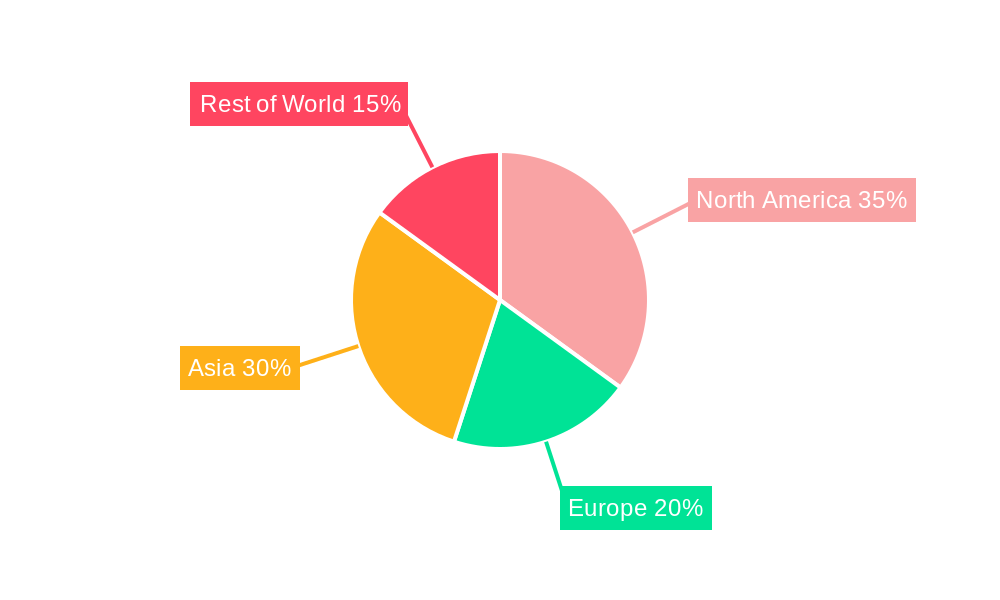
This section identifies the leading regions, countries, or segments driving market growth within the global sushi industry. North America and Asia Pacific continue to hold the largest market share due to high consumer demand and established restaurant infrastructure. However, the market is expanding rapidly in other regions, particularly in Europe and Latin America.
- North America: High per capita consumption, strong consumer preference, and established restaurant culture contribute to market dominance.
- Asia Pacific: High population density, growing disposable incomes, and a rich culinary tradition fuel strong growth.
- Europe: Rising popularity of Japanese cuisine and increasing tourism boost market expansion.
- Latin America: Growing middle class and adoption of international culinary trends drive market growth.
- Other regions: Emerging markets show significant potential for growth but face challenges related to infrastructural development and consumer awareness.
Sushi Restaurants And Kiosks Product Landscape
The sushi market offers a diverse product landscape, ranging from traditional nigiri and maki to innovative fusion rolls and creative presentations. Technological advancements in food preparation and presentation continue to enhance customer experience. Unique selling propositions include the use of high-quality ingredients, unique flavor combinations, and customized dining experiences.
Key Drivers, Barriers & Challenges in Sushi Restaurants And Kiosks
The sushi market's growth is propelled by several factors, including the increasing popularity of Japanese cuisine, growing disposable incomes, and the expansion of the quick-service restaurant segment. However, challenges such as fluctuating ingredient costs, stringent food safety regulations, and intense competition from other culinary options can significantly impact profitability. Supply chain disruptions due to global events have also caused cost increases.
Key Drivers:
- Rising disposable income
- Growing popularity of Japanese cuisine globally
- Convenience of various service models
Key Challenges:
- Fluctuating seafood prices (impact: xx% increase in costs in 2024)
- Stringent food safety regulations
- Intense competition from other restaurants
Emerging Opportunities in Sushi Restaurants And Kiosks
Several emerging trends present significant opportunities for growth in the sushi market. These include the rise of vegan and vegetarian sushi options, the integration of technology in the ordering process (online and app-based ordering), and the development of novel fusion dishes tailored to specific regional tastes. Untapped markets in developing regions and expansion into new service models (e.g., ghost kitchens, delivery-only services) also hold significant potential.
Growth Accelerators in the Sushi Restaurants And Kiosks Industry
Long-term growth in the sushi market will be driven by technological innovations, strategic partnerships, and expansion strategies. Advances in food preparation technology, sustainable sourcing practices, and innovative marketing campaigns will play a critical role in attracting new customers and maintaining market share. Strategic partnerships with food delivery platforms and expansion into new geographical locations and demographic segments will further amplify market growth.
Key Players Shaping the Sushi Restaurants And Kiosks Market
- Sukiyabashi Jiro (Tokyo)
- Sushi Saito (Tokyo)
- Narisawa (Tokyo)
- Shinji by Kanesaka (Singapore, Hong Kong)
- Shoukouwa Restaurant (Singapore)
- Sushi Masato (Bangkok)
- Nobu (New York)
- Masa (New York)
- Sushi Nakazawa (New York)
- Azai Hand Roll Sushi (Los Angeles)
- Tojo's (Vancouver)
- Osaka (Lima, Peru)
- Kinoshita (São Paulo)
- Sushisamba (London, Amsterdam)
- Endo at the Rotunda (London)
- Yashin Sushi (London)
- Zuma (Dubai)
- Sokyo (Sydney)
- Minamishima (Melbourne)
- Genki Sushi (Global)
Notable Milestones in Sushi Restaurants And Kiosks Sector
- 2020: Increased adoption of online ordering and delivery services due to the pandemic.
- 2021: Launch of several innovative sushi kiosks incorporating automation technology.
- 2022: Expansion of several major sushi chains into new international markets.
- 2023: Growing popularity of sustainable and ethically sourced seafood in high-end restaurants.
In-Depth Sushi Restaurants And Kiosks Market Outlook
The future of the sushi restaurant and kiosks market is bright, driven by robust consumer demand, technological advancements, and the increasing popularity of Japanese cuisine globally. Strategic partnerships, expansion into untapped markets, and the development of innovative products and services will be key drivers of long-term market growth. The market is poised for continued expansion, with significant opportunities for both established players and new entrants.
Sushi Restaurants And Kiosks Segmentation
-
1. Application
- 1.1. Convenience-Oriented Diners
- 1.2. Experience-Driven Consumers
- 1.3. Lifestyle-Conscious Consumers
- 1.4. Business Clients
-
2. Type
- 2.1. Chain Restaurants
- 2.2. High-class Sushi Bars
- 2.3. Neighborhood Sushi Bars
- 2.4. Sushi Kiosks
Sushi Restaurants And Kiosks Segmentation By Geography
-
1. North America
- 1.1. United States
- 1.2. Canada
- 1.3. Mexico
-
2. South America
- 2.1. Brazil
- 2.2. Argentina
- 2.3. Rest of South America
-
3. Europe
- 3.1. United Kingdom
- 3.2. Germany
- 3.3. France
- 3.4. Italy
- 3.5. Spain
- 3.6. Russia
- 3.7. Benelux
- 3.8. Nordics
- 3.9. Rest of Europe
-
4. Middle East & Africa
- 4.1. Turkey
- 4.2. Israel
- 4.3. GCC
- 4.4. North Africa
- 4.5. South Africa
- 4.6. Rest of Middle East & Africa
-
5. Asia Pacific
- 5.1. China
- 5.2. India
- 5.3. Japan
- 5.4. South Korea
- 5.5. ASEAN
- 5.6. Oceania
- 5.7. Rest of Asia Pacific
Sushi Restaurants And Kiosks Regional Market Share
Geographic Coverage of Sushi Restaurants And Kiosks
Sushi Restaurants And Kiosks REPORT HIGHLIGHTS
| Aspects | Details |
|---|---|
| Study Period | 2020-2034 |
| Base Year | 2025 |
| Estimated Year | 2026 |
| Forecast Period | 2026-2034 |
| Historical Period | 2020-2025 |
| Growth Rate | CAGR of 3.6% from 2020-2034 |
| Segmentation |
|
Table of Contents
- 1. Introduction
- 1.1. Research Scope
- 1.2. Market Segmentation
- 1.3. Research Methodology
- 1.4. Definitions and Assumptions
- 2. Executive Summary
- 2.1. Introduction
- 3. Market Dynamics
- 3.1. Introduction
- 3.2. Market Drivers
- 3.3. Market Restrains
- 3.4. Market Trends
- 4. Market Factor Analysis
- 4.1. Porters Five Forces
- 4.2. Supply/Value Chain
- 4.3. PESTEL analysis
- 4.4. Market Entropy
- 4.5. Patent/Trademark Analysis
- 5. Global Sushi Restaurants And Kiosks Analysis, Insights and Forecast, 2020-2032
- 5.1. Market Analysis, Insights and Forecast - by Application
- 5.1.1. Convenience-Oriented Diners
- 5.1.2. Experience-Driven Consumers
- 5.1.3. Lifestyle-Conscious Consumers
- 5.1.4. Business Clients
- 5.2. Market Analysis, Insights and Forecast - by Type
- 5.2.1. Chain Restaurants
- 5.2.2. High-class Sushi Bars
- 5.2.3. Neighborhood Sushi Bars
- 5.2.4. Sushi Kiosks
- 5.3. Market Analysis, Insights and Forecast - by Region
- 5.3.1. North America
- 5.3.2. South America
- 5.3.3. Europe
- 5.3.4. Middle East & Africa
- 5.3.5. Asia Pacific
- 5.1. Market Analysis, Insights and Forecast - by Application
- 6. North America Sushi Restaurants And Kiosks Analysis, Insights and Forecast, 2020-2032
- 6.1. Market Analysis, Insights and Forecast - by Application
- 6.1.1. Convenience-Oriented Diners
- 6.1.2. Experience-Driven Consumers
- 6.1.3. Lifestyle-Conscious Consumers
- 6.1.4. Business Clients
- 6.2. Market Analysis, Insights and Forecast - by Type
- 6.2.1. Chain Restaurants
- 6.2.2. High-class Sushi Bars
- 6.2.3. Neighborhood Sushi Bars
- 6.2.4. Sushi Kiosks
- 6.1. Market Analysis, Insights and Forecast - by Application
- 7. South America Sushi Restaurants And Kiosks Analysis, Insights and Forecast, 2020-2032
- 7.1. Market Analysis, Insights and Forecast - by Application
- 7.1.1. Convenience-Oriented Diners
- 7.1.2. Experience-Driven Consumers
- 7.1.3. Lifestyle-Conscious Consumers
- 7.1.4. Business Clients
- 7.2. Market Analysis, Insights and Forecast - by Type
- 7.2.1. Chain Restaurants
- 7.2.2. High-class Sushi Bars
- 7.2.3. Neighborhood Sushi Bars
- 7.2.4. Sushi Kiosks
- 7.1. Market Analysis, Insights and Forecast - by Application
- 8. Europe Sushi Restaurants And Kiosks Analysis, Insights and Forecast, 2020-2032
- 8.1. Market Analysis, Insights and Forecast - by Application
- 8.1.1. Convenience-Oriented Diners
- 8.1.2. Experience-Driven Consumers
- 8.1.3. Lifestyle-Conscious Consumers
- 8.1.4. Business Clients
- 8.2. Market Analysis, Insights and Forecast - by Type
- 8.2.1. Chain Restaurants
- 8.2.2. High-class Sushi Bars
- 8.2.3. Neighborhood Sushi Bars
- 8.2.4. Sushi Kiosks
- 8.1. Market Analysis, Insights and Forecast - by Application
- 9. Middle East & Africa Sushi Restaurants And Kiosks Analysis, Insights and Forecast, 2020-2032
- 9.1. Market Analysis, Insights and Forecast - by Application
- 9.1.1. Convenience-Oriented Diners
- 9.1.2. Experience-Driven Consumers
- 9.1.3. Lifestyle-Conscious Consumers
- 9.1.4. Business Clients
- 9.2. Market Analysis, Insights and Forecast - by Type
- 9.2.1. Chain Restaurants
- 9.2.2. High-class Sushi Bars
- 9.2.3. Neighborhood Sushi Bars
- 9.2.4. Sushi Kiosks
- 9.1. Market Analysis, Insights and Forecast - by Application
- 10. Asia Pacific Sushi Restaurants And Kiosks Analysis, Insights and Forecast, 2020-2032
- 10.1. Market Analysis, Insights and Forecast - by Application
- 10.1.1. Convenience-Oriented Diners
- 10.1.2. Experience-Driven Consumers
- 10.1.3. Lifestyle-Conscious Consumers
- 10.1.4. Business Clients
- 10.2. Market Analysis, Insights and Forecast - by Type
- 10.2.1. Chain Restaurants
- 10.2.2. High-class Sushi Bars
- 10.2.3. Neighborhood Sushi Bars
- 10.2.4. Sushi Kiosks
- 10.1. Market Analysis, Insights and Forecast - by Application
- 11. Competitive Analysis
- 11.1. Global Market Share Analysis 2025
- 11.2. Company Profiles
- 11.2.1 Sukiyabashi Jiro (Tokyo)
- 11.2.1.1. Overview
- 11.2.1.2. Products
- 11.2.1.3. SWOT Analysis
- 11.2.1.4. Recent Developments
- 11.2.1.5. Financials (Based on Availability)
- 11.2.2 Sushi Saito (Tokyo)
- 11.2.2.1. Overview
- 11.2.2.2. Products
- 11.2.2.3. SWOT Analysis
- 11.2.2.4. Recent Developments
- 11.2.2.5. Financials (Based on Availability)
- 11.2.3 Narisawa (Tokyo)
- 11.2.3.1. Overview
- 11.2.3.2. Products
- 11.2.3.3. SWOT Analysis
- 11.2.3.4. Recent Developments
- 11.2.3.5. Financials (Based on Availability)
- 11.2.4 Shinji by Kanesaka (Singapore
- 11.2.4.1. Overview
- 11.2.4.2. Products
- 11.2.4.3. SWOT Analysis
- 11.2.4.4. Recent Developments
- 11.2.4.5. Financials (Based on Availability)
- 11.2.5 Hong Kong)
- 11.2.5.1. Overview
- 11.2.5.2. Products
- 11.2.5.3. SWOT Analysis
- 11.2.5.4. Recent Developments
- 11.2.5.5. Financials (Based on Availability)
- 11.2.6 Shoukouwa Restaurant (Singapore)
- 11.2.6.1. Overview
- 11.2.6.2. Products
- 11.2.6.3. SWOT Analysis
- 11.2.6.4. Recent Developments
- 11.2.6.5. Financials (Based on Availability)
- 11.2.7 Sushi Masato (Bangkok)
- 11.2.7.1. Overview
- 11.2.7.2. Products
- 11.2.7.3. SWOT Analysis
- 11.2.7.4. Recent Developments
- 11.2.7.5. Financials (Based on Availability)
- 11.2.8 Nobu (New York)
- 11.2.8.1. Overview
- 11.2.8.2. Products
- 11.2.8.3. SWOT Analysis
- 11.2.8.4. Recent Developments
- 11.2.8.5. Financials (Based on Availability)
- 11.2.9 Masa (New York)
- 11.2.9.1. Overview
- 11.2.9.2. Products
- 11.2.9.3. SWOT Analysis
- 11.2.9.4. Recent Developments
- 11.2.9.5. Financials (Based on Availability)
- 11.2.10 Sushi Nakazawa (New York)
- 11.2.10.1. Overview
- 11.2.10.2. Products
- 11.2.10.3. SWOT Analysis
- 11.2.10.4. Recent Developments
- 11.2.10.5. Financials (Based on Availability)
- 11.2.11 Azai Hand Roll Sushi (Los Angeles)
- 11.2.11.1. Overview
- 11.2.11.2. Products
- 11.2.11.3. SWOT Analysis
- 11.2.11.4. Recent Developments
- 11.2.11.5. Financials (Based on Availability)
- 11.2.12 Tojo's (Vancouver)
- 11.2.12.1. Overview
- 11.2.12.2. Products
- 11.2.12.3. SWOT Analysis
- 11.2.12.4. Recent Developments
- 11.2.12.5. Financials (Based on Availability)
- 11.2.13 Osaka (Lima
- 11.2.13.1. Overview
- 11.2.13.2. Products
- 11.2.13.3. SWOT Analysis
- 11.2.13.4. Recent Developments
- 11.2.13.5. Financials (Based on Availability)
- 11.2.14 Peru)
- 11.2.14.1. Overview
- 11.2.14.2. Products
- 11.2.14.3. SWOT Analysis
- 11.2.14.4. Recent Developments
- 11.2.14.5. Financials (Based on Availability)
- 11.2.15 Kinoshita (São Paulo)
- 11.2.15.1. Overview
- 11.2.15.2. Products
- 11.2.15.3. SWOT Analysis
- 11.2.15.4. Recent Developments
- 11.2.15.5. Financials (Based on Availability)
- 11.2.16 Sushisamba (London
- 11.2.16.1. Overview
- 11.2.16.2. Products
- 11.2.16.3. SWOT Analysis
- 11.2.16.4. Recent Developments
- 11.2.16.5. Financials (Based on Availability)
- 11.2.17 Amsterdam)
- 11.2.17.1. Overview
- 11.2.17.2. Products
- 11.2.17.3. SWOT Analysis
- 11.2.17.4. Recent Developments
- 11.2.17.5. Financials (Based on Availability)
- 11.2.18 Endo at the Rotunda (London)
- 11.2.18.1. Overview
- 11.2.18.2. Products
- 11.2.18.3. SWOT Analysis
- 11.2.18.4. Recent Developments
- 11.2.18.5. Financials (Based on Availability)
- 11.2.19 Yashin Sushi (London)
- 11.2.19.1. Overview
- 11.2.19.2. Products
- 11.2.19.3. SWOT Analysis
- 11.2.19.4. Recent Developments
- 11.2.19.5. Financials (Based on Availability)
- 11.2.20 Zuma (Dubai)
- 11.2.20.1. Overview
- 11.2.20.2. Products
- 11.2.20.3. SWOT Analysis
- 11.2.20.4. Recent Developments
- 11.2.20.5. Financials (Based on Availability)
- 11.2.21 Sokyo (Sydney)
- 11.2.21.1. Overview
- 11.2.21.2. Products
- 11.2.21.3. SWOT Analysis
- 11.2.21.4. Recent Developments
- 11.2.21.5. Financials (Based on Availability)
- 11.2.22 Minamishima (Melbourne)
- 11.2.22.1. Overview
- 11.2.22.2. Products
- 11.2.22.3. SWOT Analysis
- 11.2.22.4. Recent Developments
- 11.2.22.5. Financials (Based on Availability)
- 11.2.23 Genki Sushi (Global)
- 11.2.23.1. Overview
- 11.2.23.2. Products
- 11.2.23.3. SWOT Analysis
- 11.2.23.4. Recent Developments
- 11.2.23.5. Financials (Based on Availability)
- 11.2.1 Sukiyabashi Jiro (Tokyo)
List of Figures
- Figure 1: Global Sushi Restaurants And Kiosks Revenue Breakdown (million, %) by Region 2025 & 2033
- Figure 2: North America Sushi Restaurants And Kiosks Revenue (million), by Application 2025 & 2033
- Figure 3: North America Sushi Restaurants And Kiosks Revenue Share (%), by Application 2025 & 2033
- Figure 4: North America Sushi Restaurants And Kiosks Revenue (million), by Type 2025 & 2033
- Figure 5: North America Sushi Restaurants And Kiosks Revenue Share (%), by Type 2025 & 2033
- Figure 6: North America Sushi Restaurants And Kiosks Revenue (million), by Country 2025 & 2033
- Figure 7: North America Sushi Restaurants And Kiosks Revenue Share (%), by Country 2025 & 2033
- Figure 8: South America Sushi Restaurants And Kiosks Revenue (million), by Application 2025 & 2033
- Figure 9: South America Sushi Restaurants And Kiosks Revenue Share (%), by Application 2025 & 2033
- Figure 10: South America Sushi Restaurants And Kiosks Revenue (million), by Type 2025 & 2033
- Figure 11: South America Sushi Restaurants And Kiosks Revenue Share (%), by Type 2025 & 2033
- Figure 12: South America Sushi Restaurants And Kiosks Revenue (million), by Country 2025 & 2033
- Figure 13: South America Sushi Restaurants And Kiosks Revenue Share (%), by Country 2025 & 2033
- Figure 14: Europe Sushi Restaurants And Kiosks Revenue (million), by Application 2025 & 2033
- Figure 15: Europe Sushi Restaurants And Kiosks Revenue Share (%), by Application 2025 & 2033
- Figure 16: Europe Sushi Restaurants And Kiosks Revenue (million), by Type 2025 & 2033
- Figure 17: Europe Sushi Restaurants And Kiosks Revenue Share (%), by Type 2025 & 2033
- Figure 18: Europe Sushi Restaurants And Kiosks Revenue (million), by Country 2025 & 2033
- Figure 19: Europe Sushi Restaurants And Kiosks Revenue Share (%), by Country 2025 & 2033
- Figure 20: Middle East & Africa Sushi Restaurants And Kiosks Revenue (million), by Application 2025 & 2033
- Figure 21: Middle East & Africa Sushi Restaurants And Kiosks Revenue Share (%), by Application 2025 & 2033
- Figure 22: Middle East & Africa Sushi Restaurants And Kiosks Revenue (million), by Type 2025 & 2033
- Figure 23: Middle East & Africa Sushi Restaurants And Kiosks Revenue Share (%), by Type 2025 & 2033
- Figure 24: Middle East & Africa Sushi Restaurants And Kiosks Revenue (million), by Country 2025 & 2033
- Figure 25: Middle East & Africa Sushi Restaurants And Kiosks Revenue Share (%), by Country 2025 & 2033
- Figure 26: Asia Pacific Sushi Restaurants And Kiosks Revenue (million), by Application 2025 & 2033
- Figure 27: Asia Pacific Sushi Restaurants And Kiosks Revenue Share (%), by Application 2025 & 2033
- Figure 28: Asia Pacific Sushi Restaurants And Kiosks Revenue (million), by Type 2025 & 2033
- Figure 29: Asia Pacific Sushi Restaurants And Kiosks Revenue Share (%), by Type 2025 & 2033
- Figure 30: Asia Pacific Sushi Restaurants And Kiosks Revenue (million), by Country 2025 & 2033
- Figure 31: Asia Pacific Sushi Restaurants And Kiosks Revenue Share (%), by Country 2025 & 2033
List of Tables
- Table 1: Global Sushi Restaurants And Kiosks Revenue million Forecast, by Application 2020 & 2033
- Table 2: Global Sushi Restaurants And Kiosks Revenue million Forecast, by Type 2020 & 2033
- Table 3: Global Sushi Restaurants And Kiosks Revenue million Forecast, by Region 2020 & 2033
- Table 4: Global Sushi Restaurants And Kiosks Revenue million Forecast, by Application 2020 & 2033
- Table 5: Global Sushi Restaurants And Kiosks Revenue million Forecast, by Type 2020 & 2033
- Table 6: Global Sushi Restaurants And Kiosks Revenue million Forecast, by Country 2020 & 2033
- Table 7: United States Sushi Restaurants And Kiosks Revenue (million) Forecast, by Application 2020 & 2033
- Table 8: Canada Sushi Restaurants And Kiosks Revenue (million) Forecast, by Application 2020 & 2033
- Table 9: Mexico Sushi Restaurants And Kiosks Revenue (million) Forecast, by Application 2020 & 2033
- Table 10: Global Sushi Restaurants And Kiosks Revenue million Forecast, by Application 2020 & 2033
- Table 11: Global Sushi Restaurants And Kiosks Revenue million Forecast, by Type 2020 & 2033
- Table 12: Global Sushi Restaurants And Kiosks Revenue million Forecast, by Country 2020 & 2033
- Table 13: Brazil Sushi Restaurants And Kiosks Revenue (million) Forecast, by Application 2020 & 2033
- Table 14: Argentina Sushi Restaurants And Kiosks Revenue (million) Forecast, by Application 2020 & 2033
- Table 15: Rest of South America Sushi Restaurants And Kiosks Revenue (million) Forecast, by Application 2020 & 2033
- Table 16: Global Sushi Restaurants And Kiosks Revenue million Forecast, by Application 2020 & 2033
- Table 17: Global Sushi Restaurants And Kiosks Revenue million Forecast, by Type 2020 & 2033
- Table 18: Global Sushi Restaurants And Kiosks Revenue million Forecast, by Country 2020 & 2033
- Table 19: United Kingdom Sushi Restaurants And Kiosks Revenue (million) Forecast, by Application 2020 & 2033
- Table 20: Germany Sushi Restaurants And Kiosks Revenue (million) Forecast, by Application 2020 & 2033
- Table 21: France Sushi Restaurants And Kiosks Revenue (million) Forecast, by Application 2020 & 2033
- Table 22: Italy Sushi Restaurants And Kiosks Revenue (million) Forecast, by Application 2020 & 2033
- Table 23: Spain Sushi Restaurants And Kiosks Revenue (million) Forecast, by Application 2020 & 2033
- Table 24: Russia Sushi Restaurants And Kiosks Revenue (million) Forecast, by Application 2020 & 2033
- Table 25: Benelux Sushi Restaurants And Kiosks Revenue (million) Forecast, by Application 2020 & 2033
- Table 26: Nordics Sushi Restaurants And Kiosks Revenue (million) Forecast, by Application 2020 & 2033
- Table 27: Rest of Europe Sushi Restaurants And Kiosks Revenue (million) Forecast, by Application 2020 & 2033
- Table 28: Global Sushi Restaurants And Kiosks Revenue million Forecast, by Application 2020 & 2033
- Table 29: Global Sushi Restaurants And Kiosks Revenue million Forecast, by Type 2020 & 2033
- Table 30: Global Sushi Restaurants And Kiosks Revenue million Forecast, by Country 2020 & 2033
- Table 31: Turkey Sushi Restaurants And Kiosks Revenue (million) Forecast, by Application 2020 & 2033
- Table 32: Israel Sushi Restaurants And Kiosks Revenue (million) Forecast, by Application 2020 & 2033
- Table 33: GCC Sushi Restaurants And Kiosks Revenue (million) Forecast, by Application 2020 & 2033
- Table 34: North Africa Sushi Restaurants And Kiosks Revenue (million) Forecast, by Application 2020 & 2033
- Table 35: South Africa Sushi Restaurants And Kiosks Revenue (million) Forecast, by Application 2020 & 2033
- Table 36: Rest of Middle East & Africa Sushi Restaurants And Kiosks Revenue (million) Forecast, by Application 2020 & 2033
- Table 37: Global Sushi Restaurants And Kiosks Revenue million Forecast, by Application 2020 & 2033
- Table 38: Global Sushi Restaurants And Kiosks Revenue million Forecast, by Type 2020 & 2033
- Table 39: Global Sushi Restaurants And Kiosks Revenue million Forecast, by Country 2020 & 2033
- Table 40: China Sushi Restaurants And Kiosks Revenue (million) Forecast, by Application 2020 & 2033
- Table 41: India Sushi Restaurants And Kiosks Revenue (million) Forecast, by Application 2020 & 2033
- Table 42: Japan Sushi Restaurants And Kiosks Revenue (million) Forecast, by Application 2020 & 2033
- Table 43: South Korea Sushi Restaurants And Kiosks Revenue (million) Forecast, by Application 2020 & 2033
- Table 44: ASEAN Sushi Restaurants And Kiosks Revenue (million) Forecast, by Application 2020 & 2033
- Table 45: Oceania Sushi Restaurants And Kiosks Revenue (million) Forecast, by Application 2020 & 2033
- Table 46: Rest of Asia Pacific Sushi Restaurants And Kiosks Revenue (million) Forecast, by Application 2020 & 2033
Frequently Asked Questions
1. What is the projected Compound Annual Growth Rate (CAGR) of the Sushi Restaurants And Kiosks?
The projected CAGR is approximately 3.6%.
2. Which companies are prominent players in the Sushi Restaurants And Kiosks?
Key companies in the market include Sukiyabashi Jiro (Tokyo), Sushi Saito (Tokyo), Narisawa (Tokyo), Shinji by Kanesaka (Singapore, Hong Kong), Shoukouwa Restaurant (Singapore), Sushi Masato (Bangkok), Nobu (New York), Masa (New York), Sushi Nakazawa (New York), Azai Hand Roll Sushi (Los Angeles), Tojo's (Vancouver), Osaka (Lima, Peru), Kinoshita (São Paulo), Sushisamba (London, Amsterdam), Endo at the Rotunda (London), Yashin Sushi (London), Zuma (Dubai), Sokyo (Sydney), Minamishima (Melbourne), Genki Sushi (Global).
3. What are the main segments of the Sushi Restaurants And Kiosks?
The market segments include Application, Type.
4. Can you provide details about the market size?
The market size is estimated to be USD 30580 million as of 2022.
5. What are some drivers contributing to market growth?
N/A
6. What are the notable trends driving market growth?
N/A
7. Are there any restraints impacting market growth?
N/A
8. Can you provide examples of recent developments in the market?
N/A
9. What pricing options are available for accessing the report?
Pricing options include single-user, multi-user, and enterprise licenses priced at USD 2900.00, USD 4350.00, and USD 5800.00 respectively.
10. Is the market size provided in terms of value or volume?
The market size is provided in terms of value, measured in million.
11. Are there any specific market keywords associated with the report?
Yes, the market keyword associated with the report is "Sushi Restaurants And Kiosks," which aids in identifying and referencing the specific market segment covered.
12. How do I determine which pricing option suits my needs best?
The pricing options vary based on user requirements and access needs. Individual users may opt for single-user licenses, while businesses requiring broader access may choose multi-user or enterprise licenses for cost-effective access to the report.
13. Are there any additional resources or data provided in the Sushi Restaurants And Kiosks report?
While the report offers comprehensive insights, it's advisable to review the specific contents or supplementary materials provided to ascertain if additional resources or data are available.
14. How can I stay updated on further developments or reports in the Sushi Restaurants And Kiosks?
To stay informed about further developments, trends, and reports in the Sushi Restaurants And Kiosks, consider subscribing to industry newsletters, following relevant companies and organizations, or regularly checking reputable industry news sources and publications.
Methodology
Step 1 - Identification of Relevant Samples Size from Population Database


Step 2 - Approaches for Defining Global Market Size (Value, Volume* & Price*)

Note*: In applicable scenarios
Step 3 - Data Sources
Primary Research
- Web Analytics
- Survey Reports
- Research Institute
- Latest Research Reports
- Opinion Leaders
Secondary Research
- Annual Reports
- White Paper
- Latest Press Release
- Industry Association
- Paid Database
- Investor Presentations

Step 4 - Data Triangulation
Involves using different sources of information in order to increase the validity of a study
These sources are likely to be stakeholders in a program - participants, other researchers, program staff, other community members, and so on.
Then we put all data in single framework & apply various statistical tools to find out the dynamic on the market.
During the analysis stage, feedback from the stakeholder groups would be compared to determine areas of agreement as well as areas of divergence