

Key Insights
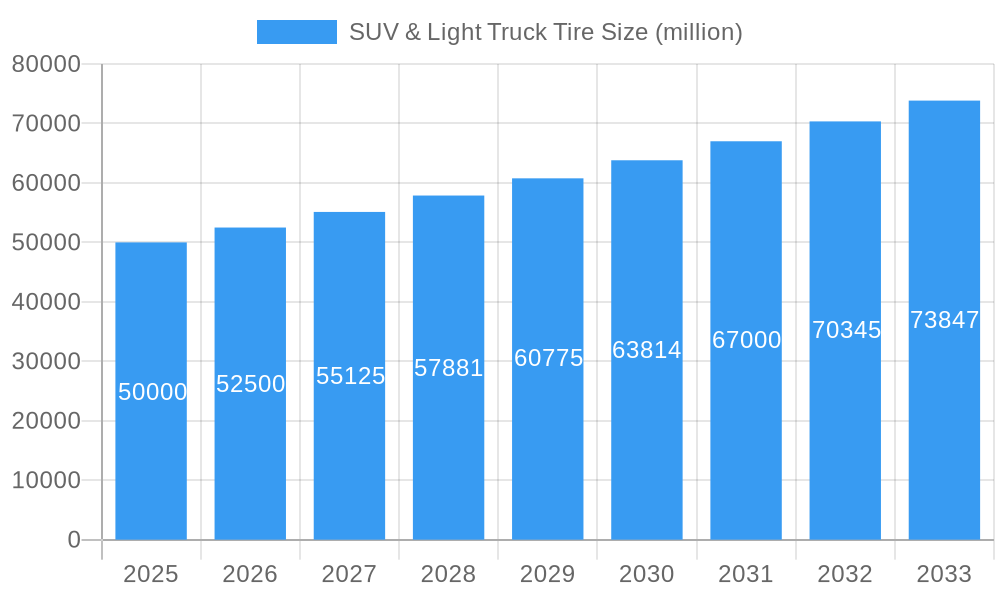
The global SUV & Light Truck tire market is experiencing robust growth, driven by the increasing popularity of SUVs and light trucks globally. This surge in demand is fueled by factors such as rising disposable incomes, particularly in emerging economies, a preference for larger vehicles offering enhanced comfort and space, and the increasing popularity of outdoor recreational activities. Technological advancements in tire manufacturing, including the development of all-season and all-terrain tires with improved fuel efficiency and longer tread life, are also contributing to market expansion. Furthermore, stringent government regulations on tire safety and performance are pushing manufacturers to innovate and improve product quality, further stimulating market growth. We estimate the 2025 market size to be around $50 billion based on industry reports and considering the growth trajectories of related automotive markets. A Compound Annual Growth Rate (CAGR) of 5% is a reasonable projection considering the consistent growth of the SUV and Light Truck segments, leading to a projected market value exceeding $70 billion by 2033.
SUV & Light Truck Tire Market Size (In Billion)
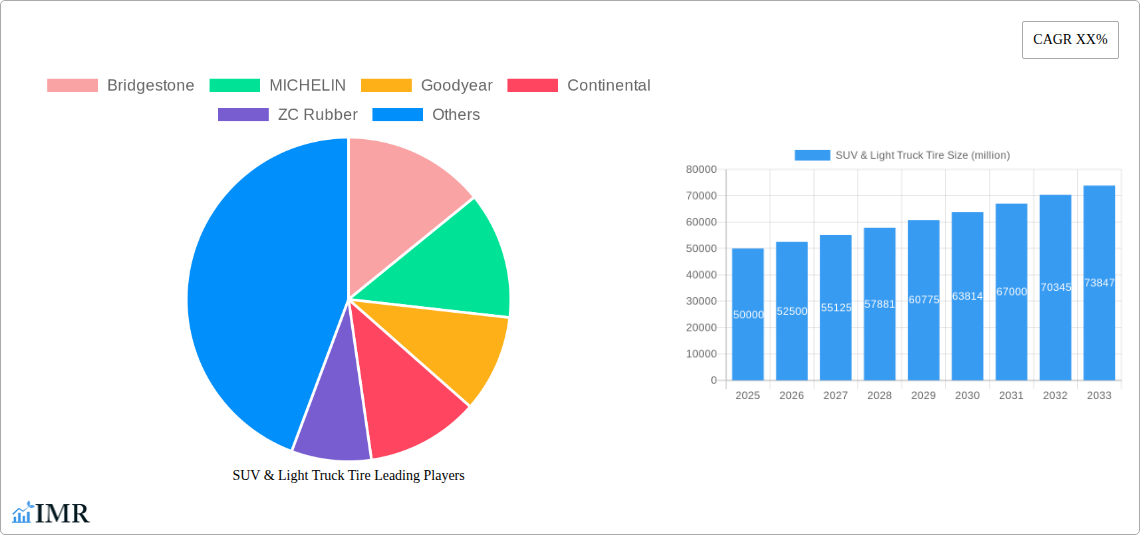
Competitive pressures within this market are intense, with established players like Bridgestone, Michelin, and Goodyear vying for market share alongside emerging players such as ZC Rubber and Sailun Jinyu Group. These companies are engaging in strategic initiatives including mergers and acquisitions, expanding their manufacturing capacity, and investing heavily in research and development to gain a competitive edge. The market is segmented based on tire type (all-season, all-terrain, performance, etc.), vehicle type (SUV, Light Truck), and region. Regional variations in market growth are expected, with faster expansion in emerging markets compared to mature markets, influenced by factors like infrastructure development and vehicle ownership rates. Challenges faced by the industry include fluctuating raw material prices (rubber, steel, etc.), supply chain disruptions, and increasing environmental concerns related to tire production and disposal.
SUV & Light Truck Tire Company Market Share
This comprehensive report provides a detailed analysis of the global SUV & Light Truck Tire market, encompassing market dynamics, growth trends, regional performance, competitive landscape, and future outlook. The study period covers 2019-2033, with a base year of 2025 and a forecast period of 2025-2033. This report is crucial for industry professionals, investors, and strategic decision-makers seeking in-depth insights into this dynamic market. The report analyzes the parent market of automotive tires and the child market segment of SUV & Light Truck tires, providing a granular understanding of market dynamics within this specific niche.
SUV & Light Truck Tire Market Dynamics & Structure
The global SUV & Light Truck tire market, valued at xx million units in 2024, exhibits a moderately concentrated structure with key players such as Bridgestone, Michelin, and Goodyear holding significant market share. Technological innovation, particularly in materials science and tire design, is a major driver. Stringent regulatory frameworks regarding fuel efficiency and safety standards significantly impact product development and market dynamics. The market also faces competition from retreaded tires and alternative mobility solutions, though these currently represent a relatively small portion of the market. End-user demographics, characterized by a rising demand for SUVs and light trucks globally, are a substantial growth factor. Mergers and acquisitions (M&A) activity within the tire industry is noteworthy, with several significant deals recorded in recent years resulting in improved market consolidation and technological integration.
- Market Concentration: High, with top 5 players holding approximately xx% market share in 2024.
- Technological Innovation: Focus on enhanced fuel efficiency, longer tread life, and improved grip in diverse weather conditions.
- Regulatory Framework: Stringent safety and environmental regulations drive innovation and standardization.
- Competitive Substitutes: Retreaded tires and alternative mobility options pose limited, but growing competition.
- M&A Activity: xx major deals recorded between 2019 and 2024, leading to increased market consolidation.
SUV & Light Truck Tire Growth Trends & Insights
The SUV & Light Truck tire market has witnessed significant growth over the historical period (2019-2024), driven by increasing SUV and light truck sales globally. The market size is expected to grow at a Compound Annual Growth Rate (CAGR) of xx% during the forecast period (2025-2033), reaching xx million units by 2033. Technological advancements, such as the development of run-flat tires and all-season tires, have increased adoption rates. Consumer behavior shifts towards premium and high-performance tires, driven by increasing disposable incomes, further fuel market growth. Market penetration in developing economies remains significant opportunity for expansion.
Dominant Regions, Countries, or Segments in SUV & Light Truck Tire
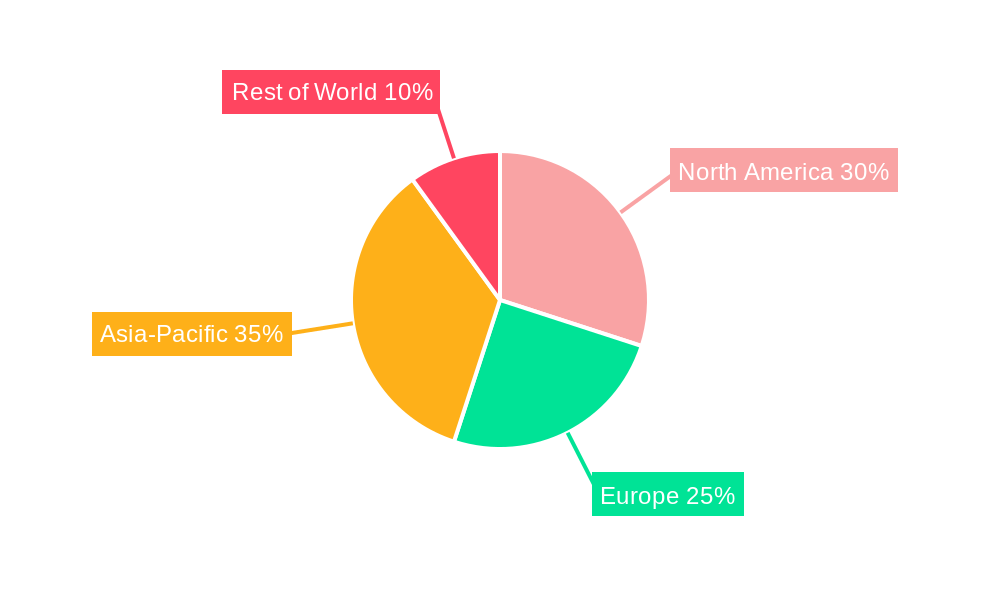
North America and Asia Pacific are currently the dominant regions for SUV & Light Truck tire consumption, accounting for xx% and xx% of the global market in 2024 respectively. The strong growth in these regions is fueled by factors including robust automotive production, increasing vehicle ownership rates, and expanding infrastructure. Within these regions, specific countries like the US, China, and Japan stand out as key markets.
- Key Drivers in North America: High vehicle ownership rates, strong automotive industry, and preference for large SUVs and trucks.
- Key Drivers in Asia Pacific: Rapid economic growth, increasing urbanization, and rising middle-class incomes.
- Market Share: North America holds xx% market share, while Asia Pacific holds xx% in 2024.
- Growth Potential: Developing economies in Asia Pacific and South America offer significant growth opportunities.
SUV & Light Truck Tire Product Landscape
The SUV & Light Truck tire market offers a diverse product range, encompassing various sizes, tread patterns, and performance characteristics. Innovations focus on enhancing fuel efficiency, wet grip, and durability. High-performance tires, all-season tires, and run-flat tires are gaining popularity. Unique selling propositions often center around improved handling, extended tread life, and specialized features for specific driving conditions. Technological advancements include the use of advanced materials like silica and nano-composites to optimize performance.
Key Drivers, Barriers & Challenges in SUV & Light Truck Tire
Key Drivers: Rising SUV and light truck sales, increasing demand for high-performance tires, technological advancements, and government regulations promoting fuel efficiency.
Challenges: Fluctuations in raw material prices, intense competition, stringent environmental regulations, and potential supply chain disruptions. These disruptions can lead to production delays and increased costs, impacting profitability. The impact of these challenges is estimated to result in a xx% reduction in projected growth in 2027.
Emerging Opportunities in SUV & Light Truck Tire
Emerging markets in developing countries present significant untapped potential. The growing demand for electric vehicles (EVs) creates opportunities for specialized tires optimized for EV performance characteristics. Innovative tire technologies, such as self-healing tires and tires with integrated sensors, offer promising avenues for growth. Customization and personalization of tires based on consumer preferences is also an emerging trend.
Growth Accelerators in the SUV & Light Truck Tire Industry
Technological breakthroughs in material science and tire design, strategic partnerships between tire manufacturers and automotive companies, and expansion into new markets are key growth accelerators. Investment in research and development to improve fuel efficiency and performance characteristics will play a vital role in long-term growth.
Key Players Shaping the SUV & Light Truck Tire Market
- Bridgestone
- MICHELIN
- Goodyear
- Continental
- ZC Rubber
- Sumitomo Rubber
- Double Coin
- Pirelli
- Aeolus Tyre
- Sailun Jinyu Group
- Cooper Tire
- Hankook
- YOKOHAMA
- Giti Tire
- KUMHO TIRE
- Triangle Tire Group
- Cheng Shin Rubber
- Linglong Tire
- Toyo Tires
- Xingyuan group
Notable Milestones in SUV & Light Truck Tire Sector
- 2020: Goodyear launches a new line of all-season tires for SUVs.
- 2021: Bridgestone and Michelin announce a joint venture focused on sustainable tire technologies.
- 2022: Continental introduces a new run-flat tire with improved performance.
- 2023: Several major tire manufacturers announce significant investments in new production facilities.
In-Depth SUV & Light Truck Tire Market Outlook
The SUV & Light Truck tire market is poised for continued growth, driven by sustained demand for SUVs and light trucks and ongoing technological advancements. Strategic partnerships and investments in sustainable technologies will be crucial for long-term success. Expanding into emerging markets and focusing on customized solutions will present significant opportunities for market players. The market is expected to reach xx million units by 2033, presenting substantial opportunities for growth and innovation.
SUV & Light Truck Tire Segmentation
-
1. Application
- 1.1. SUV
- 1.2. Light Truck
- 1.3. Other
-
2. Types
- 2.1. OEM Tire
- 2.2. Replacement Tire
SUV & Light Truck Tire Segmentation By Geography
-
1. North America
- 1.1. United States
- 1.2. Canada
- 1.3. Mexico
-
2. South America
- 2.1. Brazil
- 2.2. Argentina
- 2.3. Rest of South America
-
3. Europe
- 3.1. United Kingdom
- 3.2. Germany
- 3.3. France
- 3.4. Italy
- 3.5. Spain
- 3.6. Russia
- 3.7. Benelux
- 3.8. Nordics
- 3.9. Rest of Europe
-
4. Middle East & Africa
- 4.1. Turkey
- 4.2. Israel
- 4.3. GCC
- 4.4. North Africa
- 4.5. South Africa
- 4.6. Rest of Middle East & Africa
-
5. Asia Pacific
- 5.1. China
- 5.2. India
- 5.3. Japan
- 5.4. South Korea
- 5.5. ASEAN
- 5.6. Oceania
- 5.7. Rest of Asia Pacific
SUV & Light Truck Tire Regional Market Share
Geographic Coverage of SUV & Light Truck Tire
SUV & Light Truck Tire REPORT HIGHLIGHTS
| Aspects | Details |
|---|---|
| Study Period | 2020-2034 |
| Base Year | 2025 |
| Estimated Year | 2026 |
| Forecast Period | 2026-2034 |
| Historical Period | 2020-2025 |
| Growth Rate | CAGR of 2.63% from 2020-2034 |
| Segmentation |
|
Table of Contents
- 1. Introduction
- 1.1. Research Scope
- 1.2. Market Segmentation
- 1.3. Research Objective
- 1.4. Definitions and Assumptions
- 2. Executive Summary
- 2.1. Market Snapshot
- 3. Market Dynamics
- 3.1. Market Drivers
- 3.2. Market Restrains
- 3.3. Market Trends
- 3.4. Market Opportunities
- 4. Market Factor Analysis
- 4.1. Porters Five Forces
- 4.1.1. Bargaining Power of Suppliers
- 4.1.2. Bargaining Power of Buyers
- 4.1.3. Threat of New Entrants
- 4.1.4. Threat of Substitutes
- 4.1.5. Competitive Rivalry
- 4.2. PESTEL analysis
- 4.3. BCG Analysis
- 4.3.1. Stars (High Growth, High Market Share)
- 4.3.2. Cash Cows (Low Growth, High Market Share)
- 4.3.3. Question Mark (High Growth, Low Market Share)
- 4.3.4. Dogs (Low Growth, Low Market Share)
- 4.4. Ansoff Matrix Analysis
- 4.5. Supply Chain Analysis
- 4.6. Regulatory Landscape
- 4.7. Current Market Potential and Opportunity Assessment (TAM–SAM–SOM Framework)
- 4.8. IMR Analyst Note
- 4.1. Porters Five Forces
- 5. Market Analysis, Insights and Forecast 2021-2033
- 5.1. Market Analysis, Insights and Forecast - by Application
- 5.1.1. SUV
- 5.1.2. Light Truck
- 5.1.3. Other
- 5.2. Market Analysis, Insights and Forecast - by Types
- 5.2.1. OEM Tire
- 5.2.2. Replacement Tire
- 5.3. Market Analysis, Insights and Forecast - by Region
- 5.3.1. North America
- 5.3.2. South America
- 5.3.3. Europe
- 5.3.4. Middle East & Africa
- 5.3.5. Asia Pacific
- 5.1. Market Analysis, Insights and Forecast - by Application
- 6. Global SUV & Light Truck Tire Analysis, Insights and Forecast, 2021-2033
- 6.1. Market Analysis, Insights and Forecast - by Application
- 6.1.1. SUV
- 6.1.2. Light Truck
- 6.1.3. Other
- 6.2. Market Analysis, Insights and Forecast - by Types
- 6.2.1. OEM Tire
- 6.2.2. Replacement Tire
- 6.1. Market Analysis, Insights and Forecast - by Application
- 7. North America SUV & Light Truck Tire Analysis, Insights and Forecast, 2020-2032
- 7.1. Market Analysis, Insights and Forecast - by Application
- 7.1.1. SUV
- 7.1.2. Light Truck
- 7.1.3. Other
- 7.2. Market Analysis, Insights and Forecast - by Types
- 7.2.1. OEM Tire
- 7.2.2. Replacement Tire
- 7.1. Market Analysis, Insights and Forecast - by Application
- 8. South America SUV & Light Truck Tire Analysis, Insights and Forecast, 2020-2032
- 8.1. Market Analysis, Insights and Forecast - by Application
- 8.1.1. SUV
- 8.1.2. Light Truck
- 8.1.3. Other
- 8.2. Market Analysis, Insights and Forecast - by Types
- 8.2.1. OEM Tire
- 8.2.2. Replacement Tire
- 8.1. Market Analysis, Insights and Forecast - by Application
- 9. Europe SUV & Light Truck Tire Analysis, Insights and Forecast, 2020-2032
- 9.1. Market Analysis, Insights and Forecast - by Application
- 9.1.1. SUV
- 9.1.2. Light Truck
- 9.1.3. Other
- 9.2. Market Analysis, Insights and Forecast - by Types
- 9.2.1. OEM Tire
- 9.2.2. Replacement Tire
- 9.1. Market Analysis, Insights and Forecast - by Application
- 10. Middle East & Africa SUV & Light Truck Tire Analysis, Insights and Forecast, 2020-2032
- 10.1. Market Analysis, Insights and Forecast - by Application
- 10.1.1. SUV
- 10.1.2. Light Truck
- 10.1.3. Other
- 10.2. Market Analysis, Insights and Forecast - by Types
- 10.2.1. OEM Tire
- 10.2.2. Replacement Tire
- 10.1. Market Analysis, Insights and Forecast - by Application
- 11. Asia Pacific SUV & Light Truck Tire Analysis, Insights and Forecast, 2020-2032
- 11.1. Market Analysis, Insights and Forecast - by Application
- 11.1.1. SUV
- 11.1.2. Light Truck
- 11.1.3. Other
- 11.2. Market Analysis, Insights and Forecast - by Types
- 11.2.1. OEM Tire
- 11.2.2. Replacement Tire
- 11.1. Market Analysis, Insights and Forecast - by Application
- 12. Competitive Analysis
- 12.1. Company Profiles
- 12.1.1 Bridgestone
- 12.1.1.1. Company Overview
- 12.1.1.2. Products
- 12.1.1.3. Company Financials
- 12.1.1.4. SWOT Analysis
- 12.1.2 MICHELIN
- 12.1.2.1. Company Overview
- 12.1.2.2. Products
- 12.1.2.3. Company Financials
- 12.1.2.4. SWOT Analysis
- 12.1.3 Goodyear
- 12.1.3.1. Company Overview
- 12.1.3.2. Products
- 12.1.3.3. Company Financials
- 12.1.3.4. SWOT Analysis
- 12.1.4 Continental
- 12.1.4.1. Company Overview
- 12.1.4.2. Products
- 12.1.4.3. Company Financials
- 12.1.4.4. SWOT Analysis
- 12.1.5 ZC Rubber
- 12.1.5.1. Company Overview
- 12.1.5.2. Products
- 12.1.5.3. Company Financials
- 12.1.5.4. SWOT Analysis
- 12.1.6 Sumitomo Rubber
- 12.1.6.1. Company Overview
- 12.1.6.2. Products
- 12.1.6.3. Company Financials
- 12.1.6.4. SWOT Analysis
- 12.1.7 Double Coin
- 12.1.7.1. Company Overview
- 12.1.7.2. Products
- 12.1.7.3. Company Financials
- 12.1.7.4. SWOT Analysis
- 12.1.8 Pirelli
- 12.1.8.1. Company Overview
- 12.1.8.2. Products
- 12.1.8.3. Company Financials
- 12.1.8.4. SWOT Analysis
- 12.1.9 Aeolus Tyre
- 12.1.9.1. Company Overview
- 12.1.9.2. Products
- 12.1.9.3. Company Financials
- 12.1.9.4. SWOT Analysis
- 12.1.10 Sailun jinyu Group
- 12.1.10.1. Company Overview
- 12.1.10.2. Products
- 12.1.10.3. Company Financials
- 12.1.10.4. SWOT Analysis
- 12.1.11 Cooper tire
- 12.1.11.1. Company Overview
- 12.1.11.2. Products
- 12.1.11.3. Company Financials
- 12.1.11.4. SWOT Analysis
- 12.1.12 Hankook
- 12.1.12.1. Company Overview
- 12.1.12.2. Products
- 12.1.12.3. Company Financials
- 12.1.12.4. SWOT Analysis
- 12.1.13 YOKOHAMA
- 12.1.13.1. Company Overview
- 12.1.13.2. Products
- 12.1.13.3. Company Financials
- 12.1.13.4. SWOT Analysis
- 12.1.14 Giti Tire
- 12.1.14.1. Company Overview
- 12.1.14.2. Products
- 12.1.14.3. Company Financials
- 12.1.14.4. SWOT Analysis
- 12.1.15 KUMHO TIRE
- 12.1.15.1. Company Overview
- 12.1.15.2. Products
- 12.1.15.3. Company Financials
- 12.1.15.4. SWOT Analysis
- 12.1.16 Triangle Tire Group
- 12.1.16.1. Company Overview
- 12.1.16.2. Products
- 12.1.16.3. Company Financials
- 12.1.16.4. SWOT Analysis
- 12.1.17 Cheng Shin Rubber
- 12.1.17.1. Company Overview
- 12.1.17.2. Products
- 12.1.17.3. Company Financials
- 12.1.17.4. SWOT Analysis
- 12.1.18 Linglong Tire
- 12.1.18.1. Company Overview
- 12.1.18.2. Products
- 12.1.18.3. Company Financials
- 12.1.18.4. SWOT Analysis
- 12.1.19 Toyo Tires
- 12.1.19.1. Company Overview
- 12.1.19.2. Products
- 12.1.19.3. Company Financials
- 12.1.19.4. SWOT Analysis
- 12.1.20 Xingyuan group
- 12.1.20.1. Company Overview
- 12.1.20.2. Products
- 12.1.20.3. Company Financials
- 12.1.20.4. SWOT Analysis
- 12.1.1 Bridgestone
- 12.2. Market Entropy
- 12.2.1 Company's Key Areas Served
- 12.2.2 Recent Developments
- 12.3. Company Market Share Analysis 2025
- 12.3.1 Top 5 Companies Market Share Analysis
- 12.3.2 Top 3 Companies Market Share Analysis
- 12.4. List of Potential Customers
- 13. Research Methodology
List of Figures
- Figure 1: Global SUV & Light Truck Tire Revenue Breakdown (undefined, %) by Region 2025 & 2033
- Figure 2: Global SUV & Light Truck Tire Volume Breakdown (K, %) by Region 2025 & 2033
- Figure 3: North America SUV & Light Truck Tire Revenue (undefined), by Application 2025 & 2033
- Figure 4: North America SUV & Light Truck Tire Volume (K), by Application 2025 & 2033
- Figure 5: North America SUV & Light Truck Tire Revenue Share (%), by Application 2025 & 2033
- Figure 6: North America SUV & Light Truck Tire Volume Share (%), by Application 2025 & 2033
- Figure 7: North America SUV & Light Truck Tire Revenue (undefined), by Types 2025 & 2033
- Figure 8: North America SUV & Light Truck Tire Volume (K), by Types 2025 & 2033
- Figure 9: North America SUV & Light Truck Tire Revenue Share (%), by Types 2025 & 2033
- Figure 10: North America SUV & Light Truck Tire Volume Share (%), by Types 2025 & 2033
- Figure 11: North America SUV & Light Truck Tire Revenue (undefined), by Country 2025 & 2033
- Figure 12: North America SUV & Light Truck Tire Volume (K), by Country 2025 & 2033
- Figure 13: North America SUV & Light Truck Tire Revenue Share (%), by Country 2025 & 2033
- Figure 14: North America SUV & Light Truck Tire Volume Share (%), by Country 2025 & 2033
- Figure 15: South America SUV & Light Truck Tire Revenue (undefined), by Application 2025 & 2033
- Figure 16: South America SUV & Light Truck Tire Volume (K), by Application 2025 & 2033
- Figure 17: South America SUV & Light Truck Tire Revenue Share (%), by Application 2025 & 2033
- Figure 18: South America SUV & Light Truck Tire Volume Share (%), by Application 2025 & 2033
- Figure 19: South America SUV & Light Truck Tire Revenue (undefined), by Types 2025 & 2033
- Figure 20: South America SUV & Light Truck Tire Volume (K), by Types 2025 & 2033
- Figure 21: South America SUV & Light Truck Tire Revenue Share (%), by Types 2025 & 2033
- Figure 22: South America SUV & Light Truck Tire Volume Share (%), by Types 2025 & 2033
- Figure 23: South America SUV & Light Truck Tire Revenue (undefined), by Country 2025 & 2033
- Figure 24: South America SUV & Light Truck Tire Volume (K), by Country 2025 & 2033
- Figure 25: South America SUV & Light Truck Tire Revenue Share (%), by Country 2025 & 2033
- Figure 26: South America SUV & Light Truck Tire Volume Share (%), by Country 2025 & 2033
- Figure 27: Europe SUV & Light Truck Tire Revenue (undefined), by Application 2025 & 2033
- Figure 28: Europe SUV & Light Truck Tire Volume (K), by Application 2025 & 2033
- Figure 29: Europe SUV & Light Truck Tire Revenue Share (%), by Application 2025 & 2033
- Figure 30: Europe SUV & Light Truck Tire Volume Share (%), by Application 2025 & 2033
- Figure 31: Europe SUV & Light Truck Tire Revenue (undefined), by Types 2025 & 2033
- Figure 32: Europe SUV & Light Truck Tire Volume (K), by Types 2025 & 2033
- Figure 33: Europe SUV & Light Truck Tire Revenue Share (%), by Types 2025 & 2033
- Figure 34: Europe SUV & Light Truck Tire Volume Share (%), by Types 2025 & 2033
- Figure 35: Europe SUV & Light Truck Tire Revenue (undefined), by Country 2025 & 2033
- Figure 36: Europe SUV & Light Truck Tire Volume (K), by Country 2025 & 2033
- Figure 37: Europe SUV & Light Truck Tire Revenue Share (%), by Country 2025 & 2033
- Figure 38: Europe SUV & Light Truck Tire Volume Share (%), by Country 2025 & 2033
- Figure 39: Middle East & Africa SUV & Light Truck Tire Revenue (undefined), by Application 2025 & 2033
- Figure 40: Middle East & Africa SUV & Light Truck Tire Volume (K), by Application 2025 & 2033
- Figure 41: Middle East & Africa SUV & Light Truck Tire Revenue Share (%), by Application 2025 & 2033
- Figure 42: Middle East & Africa SUV & Light Truck Tire Volume Share (%), by Application 2025 & 2033
- Figure 43: Middle East & Africa SUV & Light Truck Tire Revenue (undefined), by Types 2025 & 2033
- Figure 44: Middle East & Africa SUV & Light Truck Tire Volume (K), by Types 2025 & 2033
- Figure 45: Middle East & Africa SUV & Light Truck Tire Revenue Share (%), by Types 2025 & 2033
- Figure 46: Middle East & Africa SUV & Light Truck Tire Volume Share (%), by Types 2025 & 2033
- Figure 47: Middle East & Africa SUV & Light Truck Tire Revenue (undefined), by Country 2025 & 2033
- Figure 48: Middle East & Africa SUV & Light Truck Tire Volume (K), by Country 2025 & 2033
- Figure 49: Middle East & Africa SUV & Light Truck Tire Revenue Share (%), by Country 2025 & 2033
- Figure 50: Middle East & Africa SUV & Light Truck Tire Volume Share (%), by Country 2025 & 2033
- Figure 51: Asia Pacific SUV & Light Truck Tire Revenue (undefined), by Application 2025 & 2033
- Figure 52: Asia Pacific SUV & Light Truck Tire Volume (K), by Application 2025 & 2033
- Figure 53: Asia Pacific SUV & Light Truck Tire Revenue Share (%), by Application 2025 & 2033
- Figure 54: Asia Pacific SUV & Light Truck Tire Volume Share (%), by Application 2025 & 2033
- Figure 55: Asia Pacific SUV & Light Truck Tire Revenue (undefined), by Types 2025 & 2033
- Figure 56: Asia Pacific SUV & Light Truck Tire Volume (K), by Types 2025 & 2033
- Figure 57: Asia Pacific SUV & Light Truck Tire Revenue Share (%), by Types 2025 & 2033
- Figure 58: Asia Pacific SUV & Light Truck Tire Volume Share (%), by Types 2025 & 2033
- Figure 59: Asia Pacific SUV & Light Truck Tire Revenue (undefined), by Country 2025 & 2033
- Figure 60: Asia Pacific SUV & Light Truck Tire Volume (K), by Country 2025 & 2033
- Figure 61: Asia Pacific SUV & Light Truck Tire Revenue Share (%), by Country 2025 & 2033
- Figure 62: Asia Pacific SUV & Light Truck Tire Volume Share (%), by Country 2025 & 2033
List of Tables
- Table 1: Global SUV & Light Truck Tire Revenue undefined Forecast, by Application 2020 & 2033
- Table 2: Global SUV & Light Truck Tire Volume K Forecast, by Application 2020 & 2033
- Table 3: Global SUV & Light Truck Tire Revenue undefined Forecast, by Types 2020 & 2033
- Table 4: Global SUV & Light Truck Tire Volume K Forecast, by Types 2020 & 2033
- Table 5: Global SUV & Light Truck Tire Revenue undefined Forecast, by Region 2020 & 2033
- Table 6: Global SUV & Light Truck Tire Volume K Forecast, by Region 2020 & 2033
- Table 7: Global SUV & Light Truck Tire Revenue undefined Forecast, by Application 2020 & 2033
- Table 8: Global SUV & Light Truck Tire Volume K Forecast, by Application 2020 & 2033
- Table 9: Global SUV & Light Truck Tire Revenue undefined Forecast, by Types 2020 & 2033
- Table 10: Global SUV & Light Truck Tire Volume K Forecast, by Types 2020 & 2033
- Table 11: Global SUV & Light Truck Tire Revenue undefined Forecast, by Country 2020 & 2033
- Table 12: Global SUV & Light Truck Tire Volume K Forecast, by Country 2020 & 2033
- Table 13: United States SUV & Light Truck Tire Revenue (undefined) Forecast, by Application 2020 & 2033
- Table 14: United States SUV & Light Truck Tire Volume (K) Forecast, by Application 2020 & 2033
- Table 15: Canada SUV & Light Truck Tire Revenue (undefined) Forecast, by Application 2020 & 2033
- Table 16: Canada SUV & Light Truck Tire Volume (K) Forecast, by Application 2020 & 2033
- Table 17: Mexico SUV & Light Truck Tire Revenue (undefined) Forecast, by Application 2020 & 2033
- Table 18: Mexico SUV & Light Truck Tire Volume (K) Forecast, by Application 2020 & 2033
- Table 19: Global SUV & Light Truck Tire Revenue undefined Forecast, by Application 2020 & 2033
- Table 20: Global SUV & Light Truck Tire Volume K Forecast, by Application 2020 & 2033
- Table 21: Global SUV & Light Truck Tire Revenue undefined Forecast, by Types 2020 & 2033
- Table 22: Global SUV & Light Truck Tire Volume K Forecast, by Types 2020 & 2033
- Table 23: Global SUV & Light Truck Tire Revenue undefined Forecast, by Country 2020 & 2033
- Table 24: Global SUV & Light Truck Tire Volume K Forecast, by Country 2020 & 2033
- Table 25: Brazil SUV & Light Truck Tire Revenue (undefined) Forecast, by Application 2020 & 2033
- Table 26: Brazil SUV & Light Truck Tire Volume (K) Forecast, by Application 2020 & 2033
- Table 27: Argentina SUV & Light Truck Tire Revenue (undefined) Forecast, by Application 2020 & 2033
- Table 28: Argentina SUV & Light Truck Tire Volume (K) Forecast, by Application 2020 & 2033
- Table 29: Rest of South America SUV & Light Truck Tire Revenue (undefined) Forecast, by Application 2020 & 2033
- Table 30: Rest of South America SUV & Light Truck Tire Volume (K) Forecast, by Application 2020 & 2033
- Table 31: Global SUV & Light Truck Tire Revenue undefined Forecast, by Application 2020 & 2033
- Table 32: Global SUV & Light Truck Tire Volume K Forecast, by Application 2020 & 2033
- Table 33: Global SUV & Light Truck Tire Revenue undefined Forecast, by Types 2020 & 2033
- Table 34: Global SUV & Light Truck Tire Volume K Forecast, by Types 2020 & 2033
- Table 35: Global SUV & Light Truck Tire Revenue undefined Forecast, by Country 2020 & 2033
- Table 36: Global SUV & Light Truck Tire Volume K Forecast, by Country 2020 & 2033
- Table 37: United Kingdom SUV & Light Truck Tire Revenue (undefined) Forecast, by Application 2020 & 2033
- Table 38: United Kingdom SUV & Light Truck Tire Volume (K) Forecast, by Application 2020 & 2033
- Table 39: Germany SUV & Light Truck Tire Revenue (undefined) Forecast, by Application 2020 & 2033
- Table 40: Germany SUV & Light Truck Tire Volume (K) Forecast, by Application 2020 & 2033
- Table 41: France SUV & Light Truck Tire Revenue (undefined) Forecast, by Application 2020 & 2033
- Table 42: France SUV & Light Truck Tire Volume (K) Forecast, by Application 2020 & 2033
- Table 43: Italy SUV & Light Truck Tire Revenue (undefined) Forecast, by Application 2020 & 2033
- Table 44: Italy SUV & Light Truck Tire Volume (K) Forecast, by Application 2020 & 2033
- Table 45: Spain SUV & Light Truck Tire Revenue (undefined) Forecast, by Application 2020 & 2033
- Table 46: Spain SUV & Light Truck Tire Volume (K) Forecast, by Application 2020 & 2033
- Table 47: Russia SUV & Light Truck Tire Revenue (undefined) Forecast, by Application 2020 & 2033
- Table 48: Russia SUV & Light Truck Tire Volume (K) Forecast, by Application 2020 & 2033
- Table 49: Benelux SUV & Light Truck Tire Revenue (undefined) Forecast, by Application 2020 & 2033
- Table 50: Benelux SUV & Light Truck Tire Volume (K) Forecast, by Application 2020 & 2033
- Table 51: Nordics SUV & Light Truck Tire Revenue (undefined) Forecast, by Application 2020 & 2033
- Table 52: Nordics SUV & Light Truck Tire Volume (K) Forecast, by Application 2020 & 2033
- Table 53: Rest of Europe SUV & Light Truck Tire Revenue (undefined) Forecast, by Application 2020 & 2033
- Table 54: Rest of Europe SUV & Light Truck Tire Volume (K) Forecast, by Application 2020 & 2033
- Table 55: Global SUV & Light Truck Tire Revenue undefined Forecast, by Application 2020 & 2033
- Table 56: Global SUV & Light Truck Tire Volume K Forecast, by Application 2020 & 2033
- Table 57: Global SUV & Light Truck Tire Revenue undefined Forecast, by Types 2020 & 2033
- Table 58: Global SUV & Light Truck Tire Volume K Forecast, by Types 2020 & 2033
- Table 59: Global SUV & Light Truck Tire Revenue undefined Forecast, by Country 2020 & 2033
- Table 60: Global SUV & Light Truck Tire Volume K Forecast, by Country 2020 & 2033
- Table 61: Turkey SUV & Light Truck Tire Revenue (undefined) Forecast, by Application 2020 & 2033
- Table 62: Turkey SUV & Light Truck Tire Volume (K) Forecast, by Application 2020 & 2033
- Table 63: Israel SUV & Light Truck Tire Revenue (undefined) Forecast, by Application 2020 & 2033
- Table 64: Israel SUV & Light Truck Tire Volume (K) Forecast, by Application 2020 & 2033
- Table 65: GCC SUV & Light Truck Tire Revenue (undefined) Forecast, by Application 2020 & 2033
- Table 66: GCC SUV & Light Truck Tire Volume (K) Forecast, by Application 2020 & 2033
- Table 67: North Africa SUV & Light Truck Tire Revenue (undefined) Forecast, by Application 2020 & 2033
- Table 68: North Africa SUV & Light Truck Tire Volume (K) Forecast, by Application 2020 & 2033
- Table 69: South Africa SUV & Light Truck Tire Revenue (undefined) Forecast, by Application 2020 & 2033
- Table 70: South Africa SUV & Light Truck Tire Volume (K) Forecast, by Application 2020 & 2033
- Table 71: Rest of Middle East & Africa SUV & Light Truck Tire Revenue (undefined) Forecast, by Application 2020 & 2033
- Table 72: Rest of Middle East & Africa SUV & Light Truck Tire Volume (K) Forecast, by Application 2020 & 2033
- Table 73: Global SUV & Light Truck Tire Revenue undefined Forecast, by Application 2020 & 2033
- Table 74: Global SUV & Light Truck Tire Volume K Forecast, by Application 2020 & 2033
- Table 75: Global SUV & Light Truck Tire Revenue undefined Forecast, by Types 2020 & 2033
- Table 76: Global SUV & Light Truck Tire Volume K Forecast, by Types 2020 & 2033
- Table 77: Global SUV & Light Truck Tire Revenue undefined Forecast, by Country 2020 & 2033
- Table 78: Global SUV & Light Truck Tire Volume K Forecast, by Country 2020 & 2033
- Table 79: China SUV & Light Truck Tire Revenue (undefined) Forecast, by Application 2020 & 2033
- Table 80: China SUV & Light Truck Tire Volume (K) Forecast, by Application 2020 & 2033
- Table 81: India SUV & Light Truck Tire Revenue (undefined) Forecast, by Application 2020 & 2033
- Table 82: India SUV & Light Truck Tire Volume (K) Forecast, by Application 2020 & 2033
- Table 83: Japan SUV & Light Truck Tire Revenue (undefined) Forecast, by Application 2020 & 2033
- Table 84: Japan SUV & Light Truck Tire Volume (K) Forecast, by Application 2020 & 2033
- Table 85: South Korea SUV & Light Truck Tire Revenue (undefined) Forecast, by Application 2020 & 2033
- Table 86: South Korea SUV & Light Truck Tire Volume (K) Forecast, by Application 2020 & 2033
- Table 87: ASEAN SUV & Light Truck Tire Revenue (undefined) Forecast, by Application 2020 & 2033
- Table 88: ASEAN SUV & Light Truck Tire Volume (K) Forecast, by Application 2020 & 2033
- Table 89: Oceania SUV & Light Truck Tire Revenue (undefined) Forecast, by Application 2020 & 2033
- Table 90: Oceania SUV & Light Truck Tire Volume (K) Forecast, by Application 2020 & 2033
- Table 91: Rest of Asia Pacific SUV & Light Truck Tire Revenue (undefined) Forecast, by Application 2020 & 2033
- Table 92: Rest of Asia Pacific SUV & Light Truck Tire Volume (K) Forecast, by Application 2020 & 2033
Frequently Asked Questions
1. What is the projected Compound Annual Growth Rate (CAGR) of the SUV & Light Truck Tire?
The projected CAGR is approximately 2.63%.
2. Which companies are prominent players in the SUV & Light Truck Tire?
Key companies in the market include Bridgestone, MICHELIN, Goodyear, Continental, ZC Rubber, Sumitomo Rubber, Double Coin, Pirelli, Aeolus Tyre, Sailun jinyu Group, Cooper tire, Hankook, YOKOHAMA, Giti Tire, KUMHO TIRE, Triangle Tire Group, Cheng Shin Rubber, Linglong Tire, Toyo Tires, Xingyuan group.
3. What are the main segments of the SUV & Light Truck Tire?
The market segments include Application, Types.
4. Can you provide details about the market size?
The market size is estimated to be USD XXX N/A as of 2022.
5. What are some drivers contributing to market growth?
N/A
6. What are the notable trends driving market growth?
N/A
7. Are there any restraints impacting market growth?
N/A
8. Can you provide examples of recent developments in the market?
N/A
9. What pricing options are available for accessing the report?
Pricing options include single-user, multi-user, and enterprise licenses priced at USD 3350.00, USD 5025.00, and USD 6700.00 respectively.
10. Is the market size provided in terms of value or volume?
The market size is provided in terms of value, measured in N/A and volume, measured in K.
11. Are there any specific market keywords associated with the report?
Yes, the market keyword associated with the report is "SUV & Light Truck Tire," which aids in identifying and referencing the specific market segment covered.
12. How do I determine which pricing option suits my needs best?
The pricing options vary based on user requirements and access needs. Individual users may opt for single-user licenses, while businesses requiring broader access may choose multi-user or enterprise licenses for cost-effective access to the report.
13. Are there any additional resources or data provided in the SUV & Light Truck Tire report?
While the report offers comprehensive insights, it's advisable to review the specific contents or supplementary materials provided to ascertain if additional resources or data are available.
14. How can I stay updated on further developments or reports in the SUV & Light Truck Tire?
To stay informed about further developments, trends, and reports in the SUV & Light Truck Tire, consider subscribing to industry newsletters, following relevant companies and organizations, or regularly checking reputable industry news sources and publications.
Methodology
Step 1 - Identification of Relevant Samples Size from Population Database


Step 2 - Approaches for Defining Global Market Size (Value, Volume* & Price*)

Note*: In applicable scenarios
Step 3 - Data Sources
Primary Research
- Web Analytics
- Survey Reports
- Research Institute
- Latest Research Reports
- Opinion Leaders
Secondary Research
- Annual Reports
- White Paper
- Latest Press Release
- Industry Association
- Paid Database
- Investor Presentations

Step 4 - Data Triangulation
Involves using different sources of information in order to increase the validity of a study
These sources are likely to be stakeholders in a program - participants, other researchers, program staff, other community members, and so on.
Then we put all data in single framework & apply various statistical tools to find out the dynamic on the market.
During the analysis stage, feedback from the stakeholder groups would be compared to determine areas of agreement as well as areas of divergence