

Key Insights
The global Taste Modulation market is poised for significant expansion, with a projected market size of approximately $15,800 million in 2025, growing at a Compound Annual Growth Rate (CAGR) of 8.60% through 2033. This robust growth is primarily fueled by evolving consumer preferences towards healthier and more palatable food and beverage options. Consumers are increasingly seeking products with reduced sugar, salt, and fat content without compromising on taste. This demand is driving innovation in taste modulation technologies, particularly in the development of natural and clean-label solutions. The "Sweet Modulators" segment is expected to lead the market due to the ongoing global concern around sugar consumption and the rising popularity of low-sugar and sugar-free products across various food and beverage categories. The Beverage segment, especially Non-Alcoholic Beverages, is a key application area, benefiting from the trend of functional beverages and the demand for improved taste profiles in plant-based drinks, ready-to-drink options, and enhanced water.
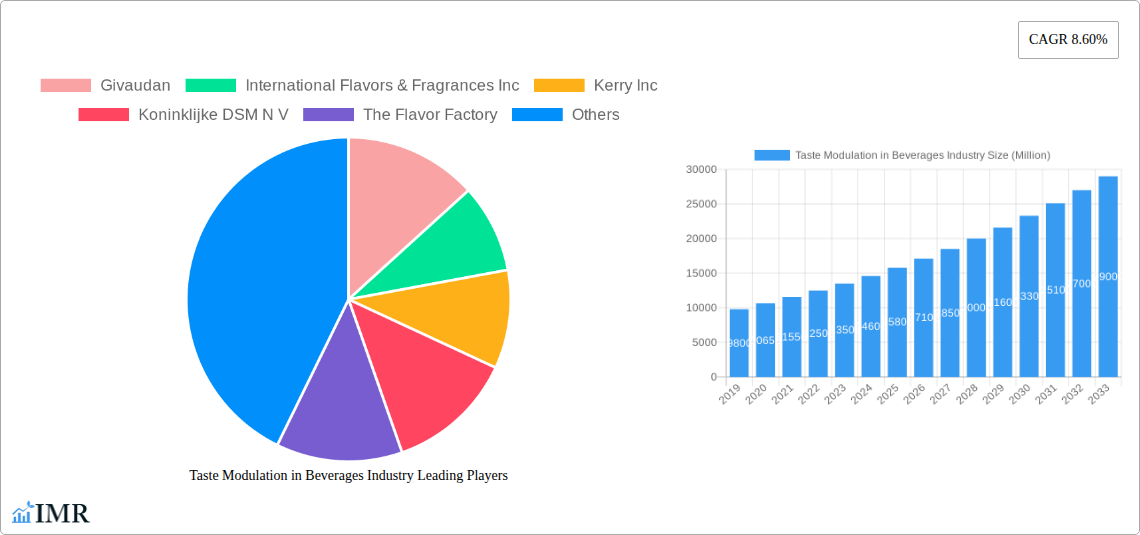
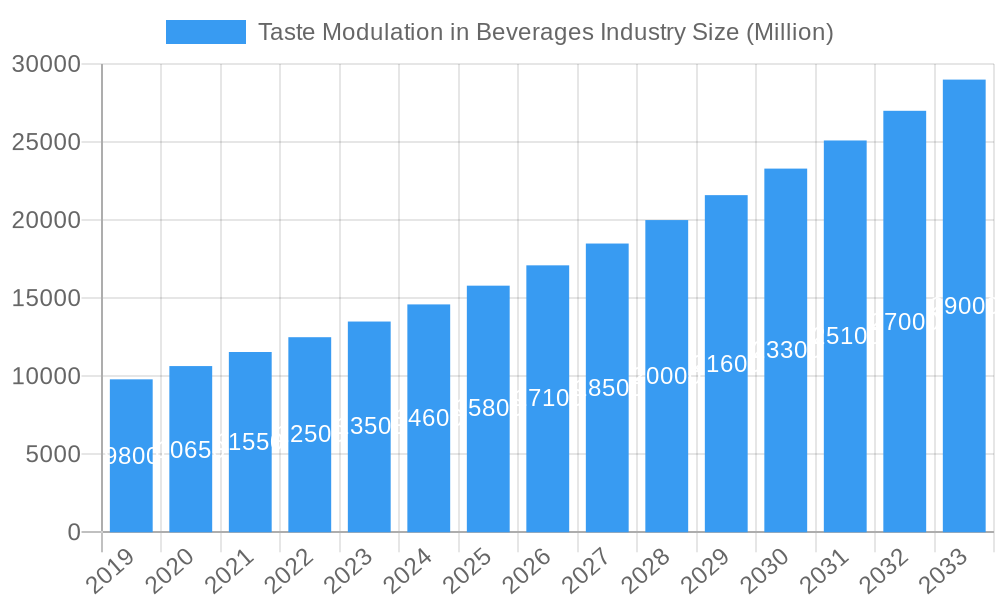
Taste Modulation in Beverages Industry Market Size (In Billion)
The market landscape is characterized by intense competition and strategic collaborations among key players like Givaudan, International Flavors & Fragrances Inc., and Kerry Inc. These companies are investing heavily in research and development to create novel taste modulators that can effectively mask undesirable flavors, enhance existing ones, and improve the overall sensory experience of food and beverages. Emerging trends such as the use of fermentation-derived ingredients and biotechnology for taste modulation are also gaining traction. However, challenges such as stringent regulatory approvals for novel ingredients and the high cost of R&D can pose restraints. Geographically, Asia Pacific is anticipated to witness the fastest growth, driven by a burgeoning middle class, increasing disposable incomes, and a growing awareness of health and wellness trends, leading to a higher adoption of sophisticated taste modulation solutions in their diverse food and beverage industries.
Taste Modulation in Beverages Industry Company Market Share
This in-depth report provides a strategic overview of the global Taste Modulation in Beverages Industry, a dynamic sector driven by evolving consumer preferences and technological advancements. The study meticulously analyzes market dynamics, growth trends, dominant regions, product innovations, key players, and future outlook. With a robust forecast period spanning 2025–2033, this report is an indispensable resource for industry professionals seeking to navigate the complexities and capitalize on the opportunities within this rapidly expanding market.
Taste Modulation in Beverages Industry Market Dynamics & Structure
The Taste Modulation in Beverages Industry exhibits a moderately concentrated market structure, with a handful of global giants and a growing number of specialized players vying for market share. Technological innovation is a primary driver, focusing on the development of novel flavor enhancers, masking agents, and ingredient combinations that cater to demand for healthier, more sophisticated taste profiles. Regulatory frameworks, particularly concerning food additives and labeling, significantly influence product development and market entry strategies. Competitive product substitutes, ranging from natural extracts to synthetic compounds, present ongoing challenges and opportunities for innovation. End-user demographics are increasingly health-conscious and adventurous, seeking novel flavor experiences and reduced sugar/salt content, directly impacting product demand. Mergers & Acquisitions (M&A) trends highlight consolidation efforts as key players seek to expand their portfolios and technological capabilities. For instance, recent M&A activities in the broader flavor ingredients market have seen deals valued in the hundreds of millions of dollars, indicating strategic investment in this area.
- Market Concentration: Moderately concentrated, with leading companies holding substantial market shares.
- Technological Innovation: Driven by novel flavor enhancers, masking agents, and natural ingredient research.
- Regulatory Frameworks: Stringent regulations impact product formulation and approval processes.
- Competitive Landscape: Characterized by a mix of established global players and emerging niche providers.
- End-User Demographics: Shifting towards health-conscious consumers seeking sugar/salt reduction and unique flavor experiences.
- M&A Trends: Active consolidation to gain market access and technological advantages, with an estimated 25 M&A deals in the broader flavor ingredient sector between 2022-2024, valued at over $500 million.
Taste Modulation in Beverages Industry Growth Trends & Insights
The global Taste Modulation in Beverages Industry is poised for significant expansion, projected to grow at a compound annual growth rate (CAGR) of 7.2% from 2025 to 2033. This robust growth is underpinned by a confluence of factors, including escalating consumer demand for reduced-sugar and low-calorie beverage options, a burgeoning interest in complex and exotic flavor profiles, and advancements in scientific understanding of taste perception. The market size for taste modulation solutions in beverages, estimated at $15,200 million in 2025, is expected to reach a substantial $26,500 million by 2033. Adoption rates for innovative taste modulation technologies are accelerating as beverage manufacturers recognize their potential to differentiate products, improve palatability, and meet evolving dietary needs. Technological disruptions, such as the development of intelligent flavor release systems and bio-based flavor compounds, are creating new avenues for product innovation and consumer engagement. Consumer behavior shifts are a critical influencer; a growing preference for natural and "clean label" ingredients, coupled with a desire for personalized taste experiences, is compelling manufacturers to invest heavily in taste modulation solutions that align with these trends. Furthermore, the increasing prevalence of chronic diseases like diabetes and obesity is driving a powerful demand for sugar-reduced beverages, making effective sweetness modulation a paramount concern. The ability of taste modulators to mask off-notes from artificial sweeteners or improve the mouthfeel of reduced-fat formulations further enhances their utility. The market penetration of advanced taste modulation ingredients is projected to increase by approximately 15% over the forecast period, driven by both technological innovation and consumer acceptance. The synergistic effect of these trends is creating a fertile ground for innovation and market growth within the Taste Modulation in Beverages Industry.
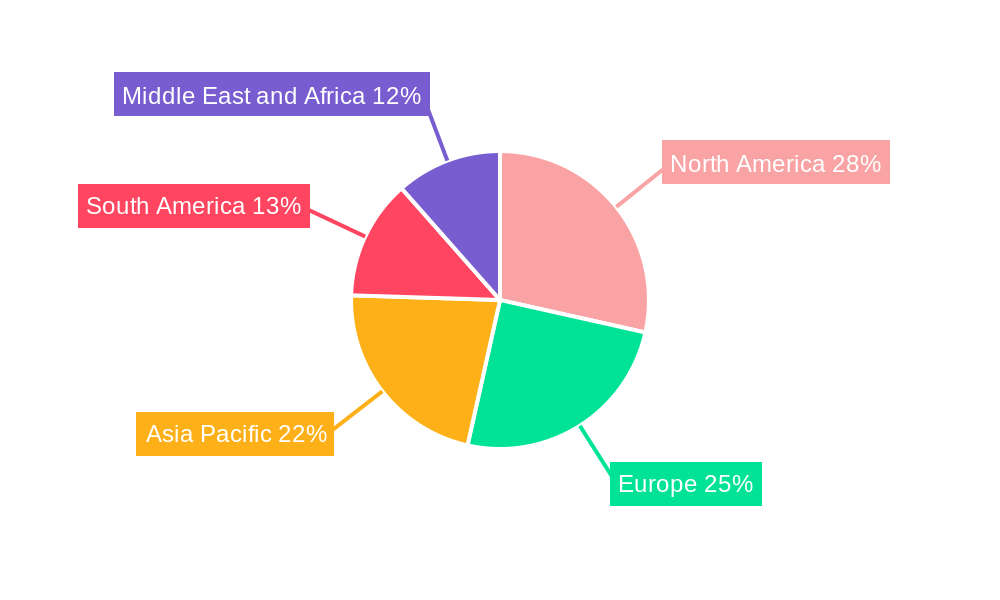
Dominant Regions, Countries, or Segments in Taste Modulation in Beverages Industry
North America currently stands as the dominant region in the Taste Modulation in Beverages Industry, driven by its sophisticated consumer base, advanced food and beverage manufacturing infrastructure, and strong emphasis on health and wellness. The Non-Alcoholic Beverages segment, encompassing carbonated soft drinks, juices, teas, and functional beverages, is the leading application, accounting for an estimated 65% of the total beverage taste modulation market share in 2025. Within this segment, the demand for Sweet Modulators is particularly pronounced, fueled by the ongoing global trend towards sugar reduction. North America's market size within this segment is projected to be approximately $6,000 million in 2025, driven by widespread adoption of sugar substitutes and intense competition among beverage manufacturers to offer healthier alternatives without compromising taste.
Key Drivers in North America's Dominance:
- High Consumer Awareness: A well-informed consumer base actively seeking healthier beverage options.
- Advanced R&D: Significant investment in research and development for innovative taste modulation solutions.
- Regulatory Support: Favorable regulatory environments that encourage product innovation in line with health objectives.
- Strong Beverage Manufacturing Hub: Presence of major global beverage corporations with extensive product portfolios.
- Economic Policies: Policies that promote healthy eating and living indirectly support the growth of taste modulation solutions.
The United States leads the charge within North America, representing a substantial portion of the regional market share. The country's robust economy and high disposable income allow for greater consumer spending on premium and health-conscious beverage products. Furthermore, the active presence of major flavor houses and beverage manufacturers in the US fosters a highly competitive and innovative landscape. The market share within the Non-Alcoholic Beverages segment is further amplified by the burgeoning demand for functional beverages and plant-based alternatives, both of which often require sophisticated taste modulation to achieve optimal palatability. The estimated market value for taste modulation in the U.S. non-alcoholic beverage sector alone is expected to reach $4,500 million by 2025.
Taste Modulation in Beverages Industry Product Landscape
The product landscape within the Taste Modulation in Beverages Industry is characterized by continuous innovation aimed at enhancing sensory experiences and meeting evolving consumer demands. Key product categories include sweetness modulators that enable sugar reduction without sacrificing taste, salt modulators that offer savory depth with reduced sodium, and fat modulators that improve mouthfeel in low-fat formulations. Advancements in encapsulation technologies are enabling controlled release of flavors, while bio-fermentation processes are yielding novel natural taste compounds. Companies are increasingly focusing on clean-label and plant-derived solutions, offering a compelling unique selling proposition. Performance metrics are centered on efficacy in taste enhancement, masking of undesirable notes, and stability across diverse beverage matrices. The development of natural sweet modulators, for instance, is a significant trend, with products offering taste profiles closer to natural sugars, contributing to a growing segment valued at $3,000 million globally in 2025.
Key Drivers, Barriers & Challenges in Taste Modulation in Beverages Industry
Key Drivers:
- Growing Demand for Healthier Beverages: Consumer push for reduced sugar, salt, and fat drives innovation in taste modulation.
- Technological Advancements: Innovations in natural extracts, fermentation, and delivery systems enhance efficacy.
- Clean Label Trend: Demand for natural and recognizable ingredients spurs development of plant-based modulators.
- Emerging Markets: Rising disposable incomes and evolving tastes in developing nations create new opportunities.
- Product Differentiation: Beverage manufacturers leverage taste modulation to create unique and appealing products.
Barriers & Challenges:
- Regulatory Hurdles: Stringent approval processes for novel ingredients and labeling requirements can delay market entry.
- Consumer Perception: Skepticism towards artificial ingredients and a preference for "real" flavors can be a restraint.
- Cost of Innovation: High R&D investment and scaling up production of new taste modulators can be expensive.
- Supply Chain Volatility: Sourcing of natural ingredients and ensuring consistent quality can be challenging.
- Competitive Pressures: Intense competition from established flavor houses and ingredient suppliers. The cost impact of regulatory non-compliance can lead to fines of up to $10,000 per infraction.
Emerging Opportunities in Taste Modulation in Beverages Industry
Emerging opportunities lie in the development of sophisticated umami modulators for savory beverages, expanding the application of taste modulation beyond sweet and salty profiles. The growing demand for functional beverages with enhanced taste profiles to mask medicinal notes presents a significant untapped market. Furthermore, the rise of personalized nutrition is creating a niche for taste modulation solutions tailored to individual dietary needs and preferences. The Asia-Pacific region, with its rapidly expanding middle class and evolving beverage consumption habits, represents a key emerging market for taste modulation technologies.
Growth Accelerators in the Taste Modulation in Beverages Industry Industry
Long-term growth in the Taste Modulation in Beverages Industry is being significantly accelerated by breakthroughs in biotechnology and precision fermentation, enabling the sustainable and cost-effective production of complex flavor compounds. Strategic partnerships between flavor houses, ingredient suppliers, and beverage manufacturers are crucial for co-creating innovative solutions and accelerating market adoption. Furthermore, market expansion strategies targeting emerging economies, coupled with a focus on educating consumers and manufacturers about the benefits of sophisticated taste modulation, are critical catalysts for sustained growth. The investment in research for bitterness masking in plant-based proteins is a prime example of a growth accelerator.
Key Players Shaping the Taste Modulation in Beverages Industry Market
- Givaudan
- International Flavors & Fragrances Inc.
- Kerry Inc.
- Koninklijke DSM N.V.
- The Flavor Factory
- Sensient Technologies Corporation
- Ingredion Incorporated
- Flavorchem Corporation
Notable Milestones in Taste Modulation in Beverages Industry Sector
- 2021: Givaudan launches a new suite of natural sweetness modulators to address sugar reduction demands.
- 2022: International Flavors & Fragrances Inc. acquires a leading player in plant-based savory ingredients, strengthening its savory taste modulation capabilities.
- 2023 (Q1): Kerry Inc. invests significantly in R&D for advanced salt reduction technologies, signaling a focus on sodium modulation.
- 2023 (Q3): Sensient Technologies Corporation introduces a new range of botanical extracts for natural flavor enhancement in beverages.
- 2024 (H1): Ingredion Incorporated expands its portfolio of starch-based texturizers and sweeteners, crucial for mouthfeel and taste in beverages.
- 2024 (H2): Koninklijke DSM N.V. announces a strategic partnership to develop novel taste modulators derived from fermentation.
In-Depth Taste Modulation in Beverages Industry Market Outlook
The future of the Taste Modulation in Beverages Industry is exceptionally promising, driven by an unwavering consumer pursuit of healthier, more enjoyable beverage experiences. Growth accelerators, including advanced biotechnological processes and strategic collaborations, will continue to fuel innovation and expand market reach. The increasing demand for personalized and functional beverages will create lucrative niches for specialized taste modulation solutions. Beverage manufacturers that effectively leverage these technologies to create compelling product offerings will be well-positioned to capture significant market share. The outlook indicates sustained high growth, with an estimated market expansion of over 60% from 2025 to 2033, underscoring the strategic importance of taste modulation in shaping the future of the beverage industry.
Taste Modulation in Beverages Industry Segmentation
-
1. Application
-
1.1. Food
- 1.1.1. Bakery and Confectionery Products
- 1.1.2. Dairy Products
- 1.1.3. Snacks & Savory Products
- 1.1.4. Meat Products
- 1.1.5. Others
-
1.2. Beverage
- 1.2.1. Alcoholic Beverages
- 1.2.2. Non-Alcoholic Beverages
-
1.1. Food
-
2. Type
- 2.1. Sweet Modulators
- 2.2. Salt Modulators
- 2.3. Fat Modulators
Taste Modulation in Beverages Industry Segmentation By Geography
-
1. North America
- 1.1. United States
- 1.2. Canada
- 1.3. Mexico
- 1.4. Rest of North America
-
2. Europe
- 2.1. Spain
- 2.2. United Kingdom
- 2.3. Germany
- 2.4. France
- 2.5. Italy
- 2.6. Russia
- 2.7. Rest of Europe
-
3. Asia Pacific
- 3.1. China
- 3.2. Japan
- 3.3. India
- 3.4. Australia
- 3.5. Rest of Asia Pacific
-
4. South America
- 4.1. Brazil
- 4.2. Argentina
- 4.3. Rest of South America
-
5. Middle East and Africa
- 5.1. South Africa
- 5.2. United Arab Emirates
- 5.3. Rest of Middle East and Africa
Taste Modulation in Beverages Industry Regional Market Share
Geographic Coverage of Taste Modulation in Beverages Industry
Taste Modulation in Beverages Industry REPORT HIGHLIGHTS
| Aspects | Details |
|---|---|
| Study Period | 2020-2034 |
| Base Year | 2025 |
| Estimated Year | 2026 |
| Forecast Period | 2026-2034 |
| Historical Period | 2020-2025 |
| Growth Rate | CAGR of 8.60% from 2020-2034 |
| Segmentation |
|
Table of Contents
- 1. Introduction
- 1.1. Research Scope
- 1.2. Market Segmentation
- 1.3. Research Objective
- 1.4. Definitions and Assumptions
- 2. Executive Summary
- 2.1. Market Snapshot
- 3. Market Dynamics
- 3.1. Market Drivers
- 3.2. Market Restrains
- 3.3. Market Trends
- 3.4. Market Opportunities
- 4. Market Factor Analysis
- 4.1. Porters Five Forces
- 4.1.1. Bargaining Power of Suppliers
- 4.1.2. Bargaining Power of Buyers
- 4.1.3. Threat of New Entrants
- 4.1.4. Threat of Substitutes
- 4.1.5. Competitive Rivalry
- 4.2. PESTEL analysis
- 4.3. BCG Analysis
- 4.3.1. Stars (High Growth, High Market Share)
- 4.3.2. Cash Cows (Low Growth, High Market Share)
- 4.3.3. Question Mark (High Growth, Low Market Share)
- 4.3.4. Dogs (Low Growth, Low Market Share)
- 4.4. Ansoff Matrix Analysis
- 4.5. Supply Chain Analysis
- 4.6. Regulatory Landscape
- 4.7. Current Market Potential and Opportunity Assessment (TAM–SAM–SOM Framework)
- 4.8. IMR Analyst Note
- 4.1. Porters Five Forces
- 5. Market Analysis, Insights and Forecast 2021-2033
- 5.1. Market Analysis, Insights and Forecast - by Application
- 5.1.1. Food
- 5.1.1.1. Bakery and Confectionery Products
- 5.1.1.2. Dairy Products
- 5.1.1.3. Snacks & Savory Products
- 5.1.1.4. Meat Products
- 5.1.1.5. Others
- 5.1.2. Beverage
- 5.1.2.1. Alcoholic Beverages
- 5.1.2.2. Non-Alcoholic Beverages
- 5.1.1. Food
- 5.2. Market Analysis, Insights and Forecast - by Type
- 5.2.1. Sweet Modulators
- 5.2.2. Salt Modulators
- 5.2.3. Fat Modulators
- 5.3. Market Analysis, Insights and Forecast - by Region
- 5.3.1. North America
- 5.3.2. Europe
- 5.3.3. Asia Pacific
- 5.3.4. South America
- 5.3.5. Middle East and Africa
- 5.1. Market Analysis, Insights and Forecast - by Application
- 6. Global Taste Modulation in Beverages Industry Analysis, Insights and Forecast, 2021-2033
- 6.1. Market Analysis, Insights and Forecast - by Application
- 6.1.1. Food
- 6.1.1.1. Bakery and Confectionery Products
- 6.1.1.2. Dairy Products
- 6.1.1.3. Snacks & Savory Products
- 6.1.1.4. Meat Products
- 6.1.1.5. Others
- 6.1.2. Beverage
- 6.1.2.1. Alcoholic Beverages
- 6.1.2.2. Non-Alcoholic Beverages
- 6.1.1. Food
- 6.2. Market Analysis, Insights and Forecast - by Type
- 6.2.1. Sweet Modulators
- 6.2.2. Salt Modulators
- 6.2.3. Fat Modulators
- 6.1. Market Analysis, Insights and Forecast - by Application
- 7. North America Taste Modulation in Beverages Industry Analysis, Insights and Forecast, 2020-2032
- 7.1. Market Analysis, Insights and Forecast - by Application
- 7.1.1. Food
- 7.1.1.1. Bakery and Confectionery Products
- 7.1.1.2. Dairy Products
- 7.1.1.3. Snacks & Savory Products
- 7.1.1.4. Meat Products
- 7.1.1.5. Others
- 7.1.2. Beverage
- 7.1.2.1. Alcoholic Beverages
- 7.1.2.2. Non-Alcoholic Beverages
- 7.1.1. Food
- 7.2. Market Analysis, Insights and Forecast - by Type
- 7.2.1. Sweet Modulators
- 7.2.2. Salt Modulators
- 7.2.3. Fat Modulators
- 7.1. Market Analysis, Insights and Forecast - by Application
- 8. Europe Taste Modulation in Beverages Industry Analysis, Insights and Forecast, 2020-2032
- 8.1. Market Analysis, Insights and Forecast - by Application
- 8.1.1. Food
- 8.1.1.1. Bakery and Confectionery Products
- 8.1.1.2. Dairy Products
- 8.1.1.3. Snacks & Savory Products
- 8.1.1.4. Meat Products
- 8.1.1.5. Others
- 8.1.2. Beverage
- 8.1.2.1. Alcoholic Beverages
- 8.1.2.2. Non-Alcoholic Beverages
- 8.1.1. Food
- 8.2. Market Analysis, Insights and Forecast - by Type
- 8.2.1. Sweet Modulators
- 8.2.2. Salt Modulators
- 8.2.3. Fat Modulators
- 8.1. Market Analysis, Insights and Forecast - by Application
- 9. Asia Pacific Taste Modulation in Beverages Industry Analysis, Insights and Forecast, 2020-2032
- 9.1. Market Analysis, Insights and Forecast - by Application
- 9.1.1. Food
- 9.1.1.1. Bakery and Confectionery Products
- 9.1.1.2. Dairy Products
- 9.1.1.3. Snacks & Savory Products
- 9.1.1.4. Meat Products
- 9.1.1.5. Others
- 9.1.2. Beverage
- 9.1.2.1. Alcoholic Beverages
- 9.1.2.2. Non-Alcoholic Beverages
- 9.1.1. Food
- 9.2. Market Analysis, Insights and Forecast - by Type
- 9.2.1. Sweet Modulators
- 9.2.2. Salt Modulators
- 9.2.3. Fat Modulators
- 9.1. Market Analysis, Insights and Forecast - by Application
- 10. South America Taste Modulation in Beverages Industry Analysis, Insights and Forecast, 2020-2032
- 10.1. Market Analysis, Insights and Forecast - by Application
- 10.1.1. Food
- 10.1.1.1. Bakery and Confectionery Products
- 10.1.1.2. Dairy Products
- 10.1.1.3. Snacks & Savory Products
- 10.1.1.4. Meat Products
- 10.1.1.5. Others
- 10.1.2. Beverage
- 10.1.2.1. Alcoholic Beverages
- 10.1.2.2. Non-Alcoholic Beverages
- 10.1.1. Food
- 10.2. Market Analysis, Insights and Forecast - by Type
- 10.2.1. Sweet Modulators
- 10.2.2. Salt Modulators
- 10.2.3. Fat Modulators
- 10.1. Market Analysis, Insights and Forecast - by Application
- 11. Middle East and Africa Taste Modulation in Beverages Industry Analysis, Insights and Forecast, 2020-2032
- 11.1. Market Analysis, Insights and Forecast - by Application
- 11.1.1. Food
- 11.1.1.1. Bakery and Confectionery Products
- 11.1.1.2. Dairy Products
- 11.1.1.3. Snacks & Savory Products
- 11.1.1.4. Meat Products
- 11.1.1.5. Others
- 11.1.2. Beverage
- 11.1.2.1. Alcoholic Beverages
- 11.1.2.2. Non-Alcoholic Beverages
- 11.1.1. Food
- 11.2. Market Analysis, Insights and Forecast - by Type
- 11.2.1. Sweet Modulators
- 11.2.2. Salt Modulators
- 11.2.3. Fat Modulators
- 11.1. Market Analysis, Insights and Forecast - by Application
- 12. Competitive Analysis
- 12.1. Company Profiles
- 12.1.1 Givaudan
- 12.1.1.1. Company Overview
- 12.1.1.2. Products
- 12.1.1.3. Company Financials
- 12.1.1.4. SWOT Analysis
- 12.1.2 International Flavors & Fragrances Inc
- 12.1.2.1. Company Overview
- 12.1.2.2. Products
- 12.1.2.3. Company Financials
- 12.1.2.4. SWOT Analysis
- 12.1.3 Kerry Inc
- 12.1.3.1. Company Overview
- 12.1.3.2. Products
- 12.1.3.3. Company Financials
- 12.1.3.4. SWOT Analysis
- 12.1.4 Koninklijke DSM N V
- 12.1.4.1. Company Overview
- 12.1.4.2. Products
- 12.1.4.3. Company Financials
- 12.1.4.4. SWOT Analysis
- 12.1.5 The Flavor Factory
- 12.1.5.1. Company Overview
- 12.1.5.2. Products
- 12.1.5.3. Company Financials
- 12.1.5.4. SWOT Analysis
- 12.1.6 Sensient Technologies Corporation
- 12.1.6.1. Company Overview
- 12.1.6.2. Products
- 12.1.6.3. Company Financials
- 12.1.6.4. SWOT Analysis
- 12.1.7 Ingredion Incorporated
- 12.1.7.1. Company Overview
- 12.1.7.2. Products
- 12.1.7.3. Company Financials
- 12.1.7.4. SWOT Analysis
- 12.1.8 Flavorchem Corporatio
- 12.1.8.1. Company Overview
- 12.1.8.2. Products
- 12.1.8.3. Company Financials
- 12.1.8.4. SWOT Analysis
- 12.1.1 Givaudan
- 12.2. Market Entropy
- 12.2.1 Company's Key Areas Served
- 12.2.2 Recent Developments
- 12.3. Company Market Share Analysis 2025
- 12.3.1 Top 5 Companies Market Share Analysis
- 12.3.2 Top 3 Companies Market Share Analysis
- 12.4. List of Potential Customers
- 13. Research Methodology
List of Figures
- Figure 1: Global Taste Modulation in Beverages Industry Revenue Breakdown (Million, %) by Region 2025 & 2033
- Figure 2: North America Taste Modulation in Beverages Industry Revenue (Million), by Application 2025 & 2033
- Figure 3: North America Taste Modulation in Beverages Industry Revenue Share (%), by Application 2025 & 2033
- Figure 4: North America Taste Modulation in Beverages Industry Revenue (Million), by Type 2025 & 2033
- Figure 5: North America Taste Modulation in Beverages Industry Revenue Share (%), by Type 2025 & 2033
- Figure 6: North America Taste Modulation in Beverages Industry Revenue (Million), by Country 2025 & 2033
- Figure 7: North America Taste Modulation in Beverages Industry Revenue Share (%), by Country 2025 & 2033
- Figure 8: Europe Taste Modulation in Beverages Industry Revenue (Million), by Application 2025 & 2033
- Figure 9: Europe Taste Modulation in Beverages Industry Revenue Share (%), by Application 2025 & 2033
- Figure 10: Europe Taste Modulation in Beverages Industry Revenue (Million), by Type 2025 & 2033
- Figure 11: Europe Taste Modulation in Beverages Industry Revenue Share (%), by Type 2025 & 2033
- Figure 12: Europe Taste Modulation in Beverages Industry Revenue (Million), by Country 2025 & 2033
- Figure 13: Europe Taste Modulation in Beverages Industry Revenue Share (%), by Country 2025 & 2033
- Figure 14: Asia Pacific Taste Modulation in Beverages Industry Revenue (Million), by Application 2025 & 2033
- Figure 15: Asia Pacific Taste Modulation in Beverages Industry Revenue Share (%), by Application 2025 & 2033
- Figure 16: Asia Pacific Taste Modulation in Beverages Industry Revenue (Million), by Type 2025 & 2033
- Figure 17: Asia Pacific Taste Modulation in Beverages Industry Revenue Share (%), by Type 2025 & 2033
- Figure 18: Asia Pacific Taste Modulation in Beverages Industry Revenue (Million), by Country 2025 & 2033
- Figure 19: Asia Pacific Taste Modulation in Beverages Industry Revenue Share (%), by Country 2025 & 2033
- Figure 20: South America Taste Modulation in Beverages Industry Revenue (Million), by Application 2025 & 2033
- Figure 21: South America Taste Modulation in Beverages Industry Revenue Share (%), by Application 2025 & 2033
- Figure 22: South America Taste Modulation in Beverages Industry Revenue (Million), by Type 2025 & 2033
- Figure 23: South America Taste Modulation in Beverages Industry Revenue Share (%), by Type 2025 & 2033
- Figure 24: South America Taste Modulation in Beverages Industry Revenue (Million), by Country 2025 & 2033
- Figure 25: South America Taste Modulation in Beverages Industry Revenue Share (%), by Country 2025 & 2033
- Figure 26: Middle East and Africa Taste Modulation in Beverages Industry Revenue (Million), by Application 2025 & 2033
- Figure 27: Middle East and Africa Taste Modulation in Beverages Industry Revenue Share (%), by Application 2025 & 2033
- Figure 28: Middle East and Africa Taste Modulation in Beverages Industry Revenue (Million), by Type 2025 & 2033
- Figure 29: Middle East and Africa Taste Modulation in Beverages Industry Revenue Share (%), by Type 2025 & 2033
- Figure 30: Middle East and Africa Taste Modulation in Beverages Industry Revenue (Million), by Country 2025 & 2033
- Figure 31: Middle East and Africa Taste Modulation in Beverages Industry Revenue Share (%), by Country 2025 & 2033
List of Tables
- Table 1: Global Taste Modulation in Beverages Industry Revenue Million Forecast, by Application 2020 & 2033
- Table 2: Global Taste Modulation in Beverages Industry Revenue Million Forecast, by Type 2020 & 2033
- Table 3: Global Taste Modulation in Beverages Industry Revenue Million Forecast, by Region 2020 & 2033
- Table 4: Global Taste Modulation in Beverages Industry Revenue Million Forecast, by Application 2020 & 2033
- Table 5: Global Taste Modulation in Beverages Industry Revenue Million Forecast, by Type 2020 & 2033
- Table 6: Global Taste Modulation in Beverages Industry Revenue Million Forecast, by Country 2020 & 2033
- Table 7: United States Taste Modulation in Beverages Industry Revenue (Million) Forecast, by Application 2020 & 2033
- Table 8: Canada Taste Modulation in Beverages Industry Revenue (Million) Forecast, by Application 2020 & 2033
- Table 9: Mexico Taste Modulation in Beverages Industry Revenue (Million) Forecast, by Application 2020 & 2033
- Table 10: Rest of North America Taste Modulation in Beverages Industry Revenue (Million) Forecast, by Application 2020 & 2033
- Table 11: Global Taste Modulation in Beverages Industry Revenue Million Forecast, by Application 2020 & 2033
- Table 12: Global Taste Modulation in Beverages Industry Revenue Million Forecast, by Type 2020 & 2033
- Table 13: Global Taste Modulation in Beverages Industry Revenue Million Forecast, by Country 2020 & 2033
- Table 14: Spain Taste Modulation in Beverages Industry Revenue (Million) Forecast, by Application 2020 & 2033
- Table 15: United Kingdom Taste Modulation in Beverages Industry Revenue (Million) Forecast, by Application 2020 & 2033
- Table 16: Germany Taste Modulation in Beverages Industry Revenue (Million) Forecast, by Application 2020 & 2033
- Table 17: France Taste Modulation in Beverages Industry Revenue (Million) Forecast, by Application 2020 & 2033
- Table 18: Italy Taste Modulation in Beverages Industry Revenue (Million) Forecast, by Application 2020 & 2033
- Table 19: Russia Taste Modulation in Beverages Industry Revenue (Million) Forecast, by Application 2020 & 2033
- Table 20: Rest of Europe Taste Modulation in Beverages Industry Revenue (Million) Forecast, by Application 2020 & 2033
- Table 21: Global Taste Modulation in Beverages Industry Revenue Million Forecast, by Application 2020 & 2033
- Table 22: Global Taste Modulation in Beverages Industry Revenue Million Forecast, by Type 2020 & 2033
- Table 23: Global Taste Modulation in Beverages Industry Revenue Million Forecast, by Country 2020 & 2033
- Table 24: China Taste Modulation in Beverages Industry Revenue (Million) Forecast, by Application 2020 & 2033
- Table 25: Japan Taste Modulation in Beverages Industry Revenue (Million) Forecast, by Application 2020 & 2033
- Table 26: India Taste Modulation in Beverages Industry Revenue (Million) Forecast, by Application 2020 & 2033
- Table 27: Australia Taste Modulation in Beverages Industry Revenue (Million) Forecast, by Application 2020 & 2033
- Table 28: Rest of Asia Pacific Taste Modulation in Beverages Industry Revenue (Million) Forecast, by Application 2020 & 2033
- Table 29: Global Taste Modulation in Beverages Industry Revenue Million Forecast, by Application 2020 & 2033
- Table 30: Global Taste Modulation in Beverages Industry Revenue Million Forecast, by Type 2020 & 2033
- Table 31: Global Taste Modulation in Beverages Industry Revenue Million Forecast, by Country 2020 & 2033
- Table 32: Brazil Taste Modulation in Beverages Industry Revenue (Million) Forecast, by Application 2020 & 2033
- Table 33: Argentina Taste Modulation in Beverages Industry Revenue (Million) Forecast, by Application 2020 & 2033
- Table 34: Rest of South America Taste Modulation in Beverages Industry Revenue (Million) Forecast, by Application 2020 & 2033
- Table 35: Global Taste Modulation in Beverages Industry Revenue Million Forecast, by Application 2020 & 2033
- Table 36: Global Taste Modulation in Beverages Industry Revenue Million Forecast, by Type 2020 & 2033
- Table 37: Global Taste Modulation in Beverages Industry Revenue Million Forecast, by Country 2020 & 2033
- Table 38: South Africa Taste Modulation in Beverages Industry Revenue (Million) Forecast, by Application 2020 & 2033
- Table 39: United Arab Emirates Taste Modulation in Beverages Industry Revenue (Million) Forecast, by Application 2020 & 2033
- Table 40: Rest of Middle East and Africa Taste Modulation in Beverages Industry Revenue (Million) Forecast, by Application 2020 & 2033
Frequently Asked Questions
1. What is the projected Compound Annual Growth Rate (CAGR) of the Taste Modulation in Beverages Industry?
The projected CAGR is approximately 8.60%.
2. Which companies are prominent players in the Taste Modulation in Beverages Industry?
Key companies in the market include Givaudan, International Flavors & Fragrances Inc, Kerry Inc, Koninklijke DSM N V, The Flavor Factory, Sensient Technologies Corporation, Ingredion Incorporated, Flavorchem Corporatio.
3. What are the main segments of the Taste Modulation in Beverages Industry?
The market segments include Application, Type.
4. Can you provide details about the market size?
The market size is estimated to be USD XX Million as of 2022.
5. What are some drivers contributing to market growth?
The Rising Awareness of the Health Benefits Associated with Collagen Consumption; Rising Sport and Fitness Trends Drives the Market Growth.
6. What are the notable trends driving market growth?
Increasing Demand For Functional Food and Beverage.
7. Are there any restraints impacting market growth?
Concerns over the Source and Animal Welfare in Collagen Extraction Limit the Market Growth.
8. Can you provide examples of recent developments in the market?
N/A
9. What pricing options are available for accessing the report?
Pricing options include single-user, multi-user, and enterprise licenses priced at USD 4750, USD 5250, and USD 8750 respectively.
10. Is the market size provided in terms of value or volume?
The market size is provided in terms of value, measured in Million.
11. Are there any specific market keywords associated with the report?
Yes, the market keyword associated with the report is "Taste Modulation in Beverages Industry," which aids in identifying and referencing the specific market segment covered.
12. How do I determine which pricing option suits my needs best?
The pricing options vary based on user requirements and access needs. Individual users may opt for single-user licenses, while businesses requiring broader access may choose multi-user or enterprise licenses for cost-effective access to the report.
13. Are there any additional resources or data provided in the Taste Modulation in Beverages Industry report?
While the report offers comprehensive insights, it's advisable to review the specific contents or supplementary materials provided to ascertain if additional resources or data are available.
14. How can I stay updated on further developments or reports in the Taste Modulation in Beverages Industry?
To stay informed about further developments, trends, and reports in the Taste Modulation in Beverages Industry, consider subscribing to industry newsletters, following relevant companies and organizations, or regularly checking reputable industry news sources and publications.
Methodology
Step 1 - Identification of Relevant Samples Size from Population Database


Step 2 - Approaches for Defining Global Market Size (Value, Volume* & Price*)

Note*: In applicable scenarios
Step 3 - Data Sources
Primary Research
- Web Analytics
- Survey Reports
- Research Institute
- Latest Research Reports
- Opinion Leaders
Secondary Research
- Annual Reports
- White Paper
- Latest Press Release
- Industry Association
- Paid Database
- Investor Presentations

Step 4 - Data Triangulation
Involves using different sources of information in order to increase the validity of a study
These sources are likely to be stakeholders in a program - participants, other researchers, program staff, other community members, and so on.
Then we put all data in single framework & apply various statistical tools to find out the dynamic on the market.
During the analysis stage, feedback from the stakeholder groups would be compared to determine areas of agreement as well as areas of divergence