

Key Insights
The global tram-train market is experiencing significant expansion, propelled by heightened urbanization, escalating passenger demand for efficient public transit, and government mandates supporting sustainable mobility. This growth is attributed to the tram-train's distinct capacity to merge light rail capabilities with existing rail infrastructure, presenting an economical alternative to conventional metro systems and enhancing connectivity across urban and suburban regions. Innovations in vehicle technology, focusing on reduced noise and improved energy efficiency, are further stimulating market uptake. Leading entities such as Bombardier, Alstom, Siemens, and CRRC are prioritizing research and development, fostering a varied product range that addresses diverse global requirements. The competitive environment features strong rivalry between established firms and new entrants, fostering innovation and competitive pricing. Despite considerable initial infrastructure outlays, the long-term operational benefits and diminished environmental footprint make tram-train systems increasingly appealing to municipalities worldwide.
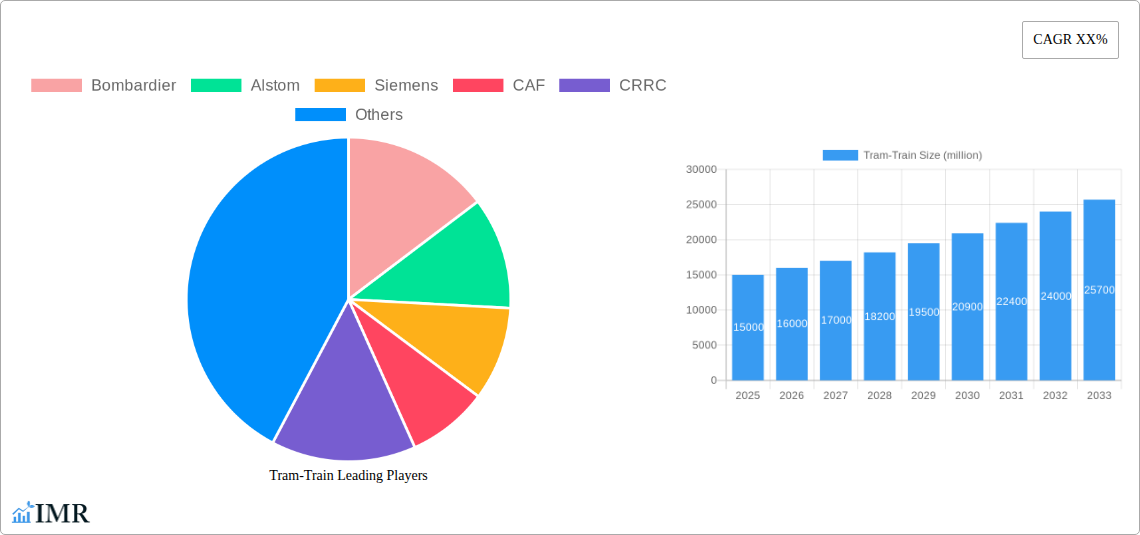
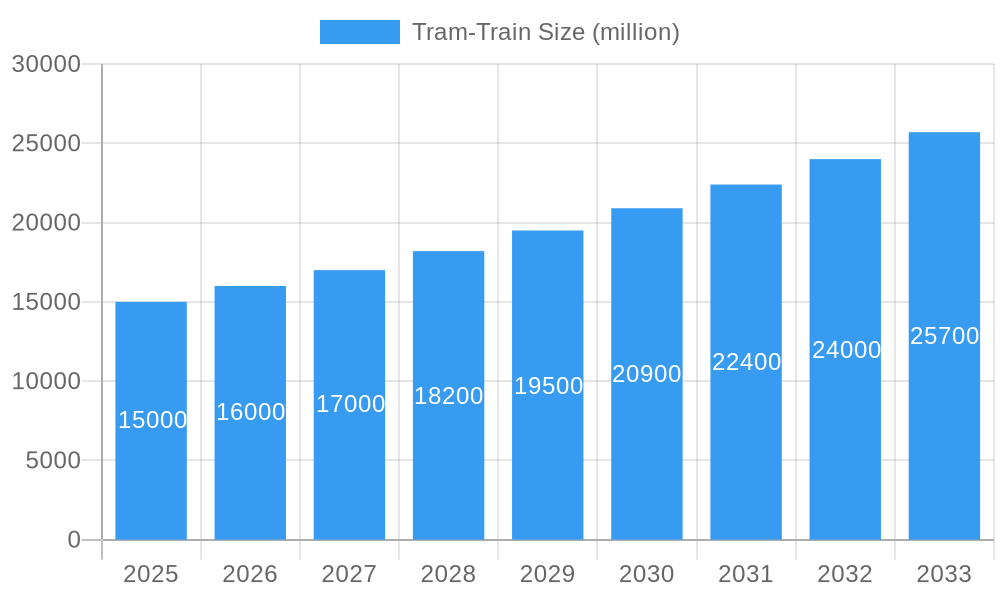
Tram-Train Market Size (In Billion)
The market is projected to sustain its growth trajectory, influenced by several key drivers. A heightened focus on sustainable transit policies, complemented by investments in public transit infrastructure upgrades, will fuel substantial demand. Moreover, the incorporation of intelligent technologies, including advanced signaling and passenger information systems, will boost the operational effectiveness and attractiveness of tram-train networks. Challenges persist, such as the necessity for stringent regulatory frameworks, efficient project execution to prevent delays, and mitigating potential environmental impacts during construction. Nevertheless, the outlook for the tram-train market remains optimistic, with an anticipated steady growth rate. Successful market penetration and sustained expansion will necessitate a focus on innovative solutions customized for specific regional demands and seamless integration with existing infrastructure. The global tram-train market is forecast to reach approximately $1.5 billion by 2024, with a Compound Annual Growth Rate (CAGR) of 4.4% from 2024 to 2030.
Tram-Train Company Market Share
Tram-Train Market Report: 2019-2033
This comprehensive report provides a detailed analysis of the global tram-train market, offering invaluable insights for industry professionals, investors, and strategic decision-makers. Covering the period from 2019 to 2033, with a focus on 2025, this report meticulously examines market dynamics, growth trends, regional dominance, product innovation, and key players shaping the future of this rapidly evolving sector. The report leverages advanced analytical methodologies to deliver precise forecasts and actionable intelligence.
Tram-Train Market Dynamics & Structure
The global tram-train market, valued at xx million units in 2024, exhibits a moderately concentrated structure, with key players like Bombardier, Alstom, and Siemens holding significant market share. Technological innovation, particularly in areas such as energy efficiency and automation, is a primary driver. Stringent safety regulations and interoperability standards influence market dynamics. Competition from traditional light rail and bus rapid transit systems presents a challenge. End-user demographics, largely driven by urban population growth and increasing demand for sustainable transportation, are a key factor influencing market expansion. The historical period (2019-2024) witnessed several M&A activities, totaling approximately xx million units in deal value. The forecast period (2025-2033) anticipates a shift towards strategic alliances and joint ventures.
- Market Concentration: Moderately concentrated, with top 3 players holding approximately 60% market share in 2024.
- Technological Innovation: Focus on energy-efficient drivetrains, advanced signaling systems, and autonomous capabilities.
- Regulatory Landscape: Stringent safety standards and interoperability requirements shaping market access.
- Competitive Substitutes: Light rail, bus rapid transit, and conventional rail systems.
- End-User Demographics: Urban population growth and increasing demand for sustainable transportation.
- M&A Activity: xx million units in deal value (2019-2024); a projected increase in strategic partnerships in the forecast period.
Tram-Train Growth Trends & Insights
The global tram-train market demonstrates robust growth, with a CAGR of xx% projected from 2025 to 2033. Market size is expected to reach xx million units by 2033, driven by factors such as increasing urbanization, government initiatives promoting sustainable transport, and technological advancements enhancing efficiency and passenger comfort. Adoption rates are particularly high in Europe and Asia-Pacific, fueled by substantial investments in public transportation infrastructure. Technological disruptions, such as the integration of smart technologies and autonomous systems, are accelerating market growth. Consumer behavior shifts towards environmentally friendly and convenient transportation options further bolster market expansion. Market penetration is expected to increase from xx% in 2025 to xx% by 2033.
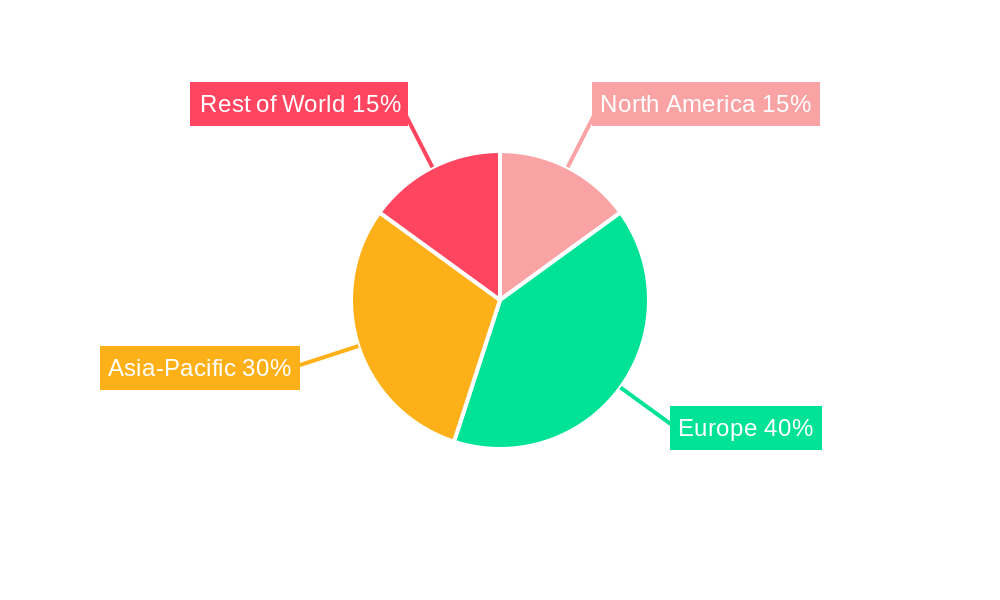
Dominant Regions, Countries, or Segments in Tram-Train
Europe and Asia-Pacific represent the dominant regions in the tram-train market, with xx million units and xx million units respectively in 2024. Germany, France, and China are key countries driving market growth. The urban transit segment holds the largest market share due to the high density of populations and the need for efficient public transport systems.
- Europe: Strong government support for sustainable transport initiatives and well-established public transport infrastructure.
- Asia-Pacific: Rapid urbanization and increasing investments in public transportation systems in major cities.
- Germany: Extensive tram-train network and strong technological advancements.
- France: Significant investments in modernizing existing and building new tram-train lines.
- China: Rapid expansion of urban rail networks and government support for sustainable transport solutions.
- Urban Transit Segment: High demand for efficient and eco-friendly solutions in densely populated areas.
Tram-Train Product Landscape
The tram-train market offers a range of vehicles with varying capacities, designs, and technological features. Innovations focus on lightweight materials, advanced braking systems, and improved passenger comfort. Key performance metrics include energy efficiency, passenger capacity, and operational reliability. Unique selling propositions often center around enhanced sustainability, reduced operational costs, and seamless integration with existing rail networks. Technological advancements in areas like onboard diagnostics and predictive maintenance are becoming increasingly prominent.
Key Drivers, Barriers & Challenges in Tram-Train
Key Drivers:
- Increasing urbanization and growing demand for efficient public transportation.
- Government initiatives promoting sustainable transport and reducing carbon emissions.
- Technological advancements enhancing the efficiency and reliability of tram-trains.
- Growing investments in public transportation infrastructure.
Challenges:
- High initial investment costs associated with infrastructure development.
- Interoperability challenges between different tram-train systems and existing rail networks.
- Competition from other public transportation modes.
- Supply chain disruptions and material cost increases, impacting production costs by approximately xx%.
Emerging Opportunities in Tram-Train
- Expansion into untapped markets in developing economies.
- Development of innovative tram-train designs for specific urban environments.
- Integration of advanced technologies such as autonomous driving and smart ticketing systems.
- Growing demand for hybrid and electric tram-trains.
Growth Accelerators in the Tram-Train Industry
Technological breakthroughs in battery technology, lightweight materials, and advanced control systems are key catalysts for long-term growth. Strategic partnerships between manufacturers, infrastructure developers, and transit operators are accelerating market expansion. Government policies supporting sustainable transport and providing financial incentives are further boosting market growth. Expansion into new markets, especially in developing countries experiencing rapid urbanization, presents significant opportunities.
Key Players Shaping the Tram-Train Market
- Bombardier
- Alstom
- Siemens
- CAF
- CRRC
- PKTS/Metrovagonmash
- Kinkisharyo
- Stadler Rail
- Škoda Transtech
- Durmazlar
- China CRRC Corporation Limited
Notable Milestones in Tram-Train Sector
- 2020: Alstom launches its new generation of tram-trains incorporating advanced safety features.
- 2022: Siemens secures a major contract for the supply of tram-trains to a major European city.
- 2023: Bombardier and a major infrastructure company form a strategic alliance to jointly develop new tram-train projects.
In-Depth Tram-Train Market Outlook
The future of the tram-train market appears bright, with strong growth potential driven by sustained urbanization, increasing demand for sustainable transportation, and ongoing technological advancements. Strategic opportunities exist for manufacturers to focus on developing innovative, cost-effective, and energy-efficient tram-train solutions tailored to the specific needs of different markets. Partnerships and collaborations across the industry value chain will be crucial to unlock the full potential of this dynamic market sector.
Tram-Train Segmentation
-
1. Application
- 1.1. Commercial
- 1.2. Industrial
-
2. Types
- 2.1. Articulated Tram
- 2.2. Double-decker Tram
- 2.3. Rubber-tired Tram
- 2.4. Restaurant Tram
Tram-Train Segmentation By Geography
-
1. North America
- 1.1. United States
- 1.2. Canada
- 1.3. Mexico
-
2. South America
- 2.1. Brazil
- 2.2. Argentina
- 2.3. Rest of South America
-
3. Europe
- 3.1. United Kingdom
- 3.2. Germany
- 3.3. France
- 3.4. Italy
- 3.5. Spain
- 3.6. Russia
- 3.7. Benelux
- 3.8. Nordics
- 3.9. Rest of Europe
-
4. Middle East & Africa
- 4.1. Turkey
- 4.2. Israel
- 4.3. GCC
- 4.4. North Africa
- 4.5. South Africa
- 4.6. Rest of Middle East & Africa
-
5. Asia Pacific
- 5.1. China
- 5.2. India
- 5.3. Japan
- 5.4. South Korea
- 5.5. ASEAN
- 5.6. Oceania
- 5.7. Rest of Asia Pacific
Tram-Train Regional Market Share
Geographic Coverage of Tram-Train
Tram-Train REPORT HIGHLIGHTS
| Aspects | Details |
|---|---|
| Study Period | 2020-2034 |
| Base Year | 2025 |
| Estimated Year | 2026 |
| Forecast Period | 2026-2034 |
| Historical Period | 2020-2025 |
| Growth Rate | CAGR of 4.4% from 2020-2034 |
| Segmentation |
|
Table of Contents
- 1. Introduction
- 1.1. Research Scope
- 1.2. Market Segmentation
- 1.3. Research Objective
- 1.4. Definitions and Assumptions
- 2. Executive Summary
- 2.1. Market Snapshot
- 3. Market Dynamics
- 3.1. Market Drivers
- 3.2. Market Restrains
- 3.3. Market Trends
- 3.4. Market Opportunities
- 4. Market Factor Analysis
- 4.1. Porters Five Forces
- 4.1.1. Bargaining Power of Suppliers
- 4.1.2. Bargaining Power of Buyers
- 4.1.3. Threat of New Entrants
- 4.1.4. Threat of Substitutes
- 4.1.5. Competitive Rivalry
- 4.2. PESTEL analysis
- 4.3. BCG Analysis
- 4.3.1. Stars (High Growth, High Market Share)
- 4.3.2. Cash Cows (Low Growth, High Market Share)
- 4.3.3. Question Mark (High Growth, Low Market Share)
- 4.3.4. Dogs (Low Growth, Low Market Share)
- 4.4. Ansoff Matrix Analysis
- 4.5. Supply Chain Analysis
- 4.6. Regulatory Landscape
- 4.7. Current Market Potential and Opportunity Assessment (TAM–SAM–SOM Framework)
- 4.8. IMR Analyst Note
- 4.1. Porters Five Forces
- 5. Market Analysis, Insights and Forecast 2021-2033
- 5.1. Market Analysis, Insights and Forecast - by Application
- 5.1.1. Commercial
- 5.1.2. Industrial
- 5.2. Market Analysis, Insights and Forecast - by Types
- 5.2.1. Articulated Tram
- 5.2.2. Double-decker Tram
- 5.2.3. Rubber-tired Tram
- 5.2.4. Restaurant Tram
- 5.3. Market Analysis, Insights and Forecast - by Region
- 5.3.1. North America
- 5.3.2. South America
- 5.3.3. Europe
- 5.3.4. Middle East & Africa
- 5.3.5. Asia Pacific
- 5.1. Market Analysis, Insights and Forecast - by Application
- 6. Global Tram-Train Analysis, Insights and Forecast, 2021-2033
- 6.1. Market Analysis, Insights and Forecast - by Application
- 6.1.1. Commercial
- 6.1.2. Industrial
- 6.2. Market Analysis, Insights and Forecast - by Types
- 6.2.1. Articulated Tram
- 6.2.2. Double-decker Tram
- 6.2.3. Rubber-tired Tram
- 6.2.4. Restaurant Tram
- 6.1. Market Analysis, Insights and Forecast - by Application
- 7. North America Tram-Train Analysis, Insights and Forecast, 2020-2032
- 7.1. Market Analysis, Insights and Forecast - by Application
- 7.1.1. Commercial
- 7.1.2. Industrial
- 7.2. Market Analysis, Insights and Forecast - by Types
- 7.2.1. Articulated Tram
- 7.2.2. Double-decker Tram
- 7.2.3. Rubber-tired Tram
- 7.2.4. Restaurant Tram
- 7.1. Market Analysis, Insights and Forecast - by Application
- 8. South America Tram-Train Analysis, Insights and Forecast, 2020-2032
- 8.1. Market Analysis, Insights and Forecast - by Application
- 8.1.1. Commercial
- 8.1.2. Industrial
- 8.2. Market Analysis, Insights and Forecast - by Types
- 8.2.1. Articulated Tram
- 8.2.2. Double-decker Tram
- 8.2.3. Rubber-tired Tram
- 8.2.4. Restaurant Tram
- 8.1. Market Analysis, Insights and Forecast - by Application
- 9. Europe Tram-Train Analysis, Insights and Forecast, 2020-2032
- 9.1. Market Analysis, Insights and Forecast - by Application
- 9.1.1. Commercial
- 9.1.2. Industrial
- 9.2. Market Analysis, Insights and Forecast - by Types
- 9.2.1. Articulated Tram
- 9.2.2. Double-decker Tram
- 9.2.3. Rubber-tired Tram
- 9.2.4. Restaurant Tram
- 9.1. Market Analysis, Insights and Forecast - by Application
- 10. Middle East & Africa Tram-Train Analysis, Insights and Forecast, 2020-2032
- 10.1. Market Analysis, Insights and Forecast - by Application
- 10.1.1. Commercial
- 10.1.2. Industrial
- 10.2. Market Analysis, Insights and Forecast - by Types
- 10.2.1. Articulated Tram
- 10.2.2. Double-decker Tram
- 10.2.3. Rubber-tired Tram
- 10.2.4. Restaurant Tram
- 10.1. Market Analysis, Insights and Forecast - by Application
- 11. Asia Pacific Tram-Train Analysis, Insights and Forecast, 2020-2032
- 11.1. Market Analysis, Insights and Forecast - by Application
- 11.1.1. Commercial
- 11.1.2. Industrial
- 11.2. Market Analysis, Insights and Forecast - by Types
- 11.2.1. Articulated Tram
- 11.2.2. Double-decker Tram
- 11.2.3. Rubber-tired Tram
- 11.2.4. Restaurant Tram
- 11.1. Market Analysis, Insights and Forecast - by Application
- 12. Competitive Analysis
- 12.1. Company Profiles
- 12.1.1 Bombardier
- 12.1.1.1. Company Overview
- 12.1.1.2. Products
- 12.1.1.3. Company Financials
- 12.1.1.4. SWOT Analysis
- 12.1.2 Alstom
- 12.1.2.1. Company Overview
- 12.1.2.2. Products
- 12.1.2.3. Company Financials
- 12.1.2.4. SWOT Analysis
- 12.1.3 Siemens
- 12.1.3.1. Company Overview
- 12.1.3.2. Products
- 12.1.3.3. Company Financials
- 12.1.3.4. SWOT Analysis
- 12.1.4 CAF
- 12.1.4.1. Company Overview
- 12.1.4.2. Products
- 12.1.4.3. Company Financials
- 12.1.4.4. SWOT Analysis
- 12.1.5 CRRC
- 12.1.5.1. Company Overview
- 12.1.5.2. Products
- 12.1.5.3. Company Financials
- 12.1.5.4. SWOT Analysis
- 12.1.6 PKTS/Metrovagonmash
- 12.1.6.1. Company Overview
- 12.1.6.2. Products
- 12.1.6.3. Company Financials
- 12.1.6.4. SWOT Analysis
- 12.1.7 Kinkisharyo
- 12.1.7.1. Company Overview
- 12.1.7.2. Products
- 12.1.7.3. Company Financials
- 12.1.7.4. SWOT Analysis
- 12.1.8 Stadler Rail
- 12.1.8.1. Company Overview
- 12.1.8.2. Products
- 12.1.8.3. Company Financials
- 12.1.8.4. SWOT Analysis
- 12.1.9 Škoda Transtech
- 12.1.9.1. Company Overview
- 12.1.9.2. Products
- 12.1.9.3. Company Financials
- 12.1.9.4. SWOT Analysis
- 12.1.10 Durmazlar
- 12.1.10.1. Company Overview
- 12.1.10.2. Products
- 12.1.10.3. Company Financials
- 12.1.10.4. SWOT Analysis
- 12.1.11 China CRRC Corporation Limited
- 12.1.11.1. Company Overview
- 12.1.11.2. Products
- 12.1.11.3. Company Financials
- 12.1.11.4. SWOT Analysis
- 12.1.1 Bombardier
- 12.2. Market Entropy
- 12.2.1 Company's Key Areas Served
- 12.2.2 Recent Developments
- 12.3. Company Market Share Analysis 2025
- 12.3.1 Top 5 Companies Market Share Analysis
- 12.3.2 Top 3 Companies Market Share Analysis
- 12.4. List of Potential Customers
- 13. Research Methodology
List of Figures
- Figure 1: Global Tram-Train Revenue Breakdown (billion, %) by Region 2025 & 2033
- Figure 2: North America Tram-Train Revenue (billion), by Application 2025 & 2033
- Figure 3: North America Tram-Train Revenue Share (%), by Application 2025 & 2033
- Figure 4: North America Tram-Train Revenue (billion), by Types 2025 & 2033
- Figure 5: North America Tram-Train Revenue Share (%), by Types 2025 & 2033
- Figure 6: North America Tram-Train Revenue (billion), by Country 2025 & 2033
- Figure 7: North America Tram-Train Revenue Share (%), by Country 2025 & 2033
- Figure 8: South America Tram-Train Revenue (billion), by Application 2025 & 2033
- Figure 9: South America Tram-Train Revenue Share (%), by Application 2025 & 2033
- Figure 10: South America Tram-Train Revenue (billion), by Types 2025 & 2033
- Figure 11: South America Tram-Train Revenue Share (%), by Types 2025 & 2033
- Figure 12: South America Tram-Train Revenue (billion), by Country 2025 & 2033
- Figure 13: South America Tram-Train Revenue Share (%), by Country 2025 & 2033
- Figure 14: Europe Tram-Train Revenue (billion), by Application 2025 & 2033
- Figure 15: Europe Tram-Train Revenue Share (%), by Application 2025 & 2033
- Figure 16: Europe Tram-Train Revenue (billion), by Types 2025 & 2033
- Figure 17: Europe Tram-Train Revenue Share (%), by Types 2025 & 2033
- Figure 18: Europe Tram-Train Revenue (billion), by Country 2025 & 2033
- Figure 19: Europe Tram-Train Revenue Share (%), by Country 2025 & 2033
- Figure 20: Middle East & Africa Tram-Train Revenue (billion), by Application 2025 & 2033
- Figure 21: Middle East & Africa Tram-Train Revenue Share (%), by Application 2025 & 2033
- Figure 22: Middle East & Africa Tram-Train Revenue (billion), by Types 2025 & 2033
- Figure 23: Middle East & Africa Tram-Train Revenue Share (%), by Types 2025 & 2033
- Figure 24: Middle East & Africa Tram-Train Revenue (billion), by Country 2025 & 2033
- Figure 25: Middle East & Africa Tram-Train Revenue Share (%), by Country 2025 & 2033
- Figure 26: Asia Pacific Tram-Train Revenue (billion), by Application 2025 & 2033
- Figure 27: Asia Pacific Tram-Train Revenue Share (%), by Application 2025 & 2033
- Figure 28: Asia Pacific Tram-Train Revenue (billion), by Types 2025 & 2033
- Figure 29: Asia Pacific Tram-Train Revenue Share (%), by Types 2025 & 2033
- Figure 30: Asia Pacific Tram-Train Revenue (billion), by Country 2025 & 2033
- Figure 31: Asia Pacific Tram-Train Revenue Share (%), by Country 2025 & 2033
List of Tables
- Table 1: Global Tram-Train Revenue billion Forecast, by Application 2020 & 2033
- Table 2: Global Tram-Train Revenue billion Forecast, by Types 2020 & 2033
- Table 3: Global Tram-Train Revenue billion Forecast, by Region 2020 & 2033
- Table 4: Global Tram-Train Revenue billion Forecast, by Application 2020 & 2033
- Table 5: Global Tram-Train Revenue billion Forecast, by Types 2020 & 2033
- Table 6: Global Tram-Train Revenue billion Forecast, by Country 2020 & 2033
- Table 7: United States Tram-Train Revenue (billion) Forecast, by Application 2020 & 2033
- Table 8: Canada Tram-Train Revenue (billion) Forecast, by Application 2020 & 2033
- Table 9: Mexico Tram-Train Revenue (billion) Forecast, by Application 2020 & 2033
- Table 10: Global Tram-Train Revenue billion Forecast, by Application 2020 & 2033
- Table 11: Global Tram-Train Revenue billion Forecast, by Types 2020 & 2033
- Table 12: Global Tram-Train Revenue billion Forecast, by Country 2020 & 2033
- Table 13: Brazil Tram-Train Revenue (billion) Forecast, by Application 2020 & 2033
- Table 14: Argentina Tram-Train Revenue (billion) Forecast, by Application 2020 & 2033
- Table 15: Rest of South America Tram-Train Revenue (billion) Forecast, by Application 2020 & 2033
- Table 16: Global Tram-Train Revenue billion Forecast, by Application 2020 & 2033
- Table 17: Global Tram-Train Revenue billion Forecast, by Types 2020 & 2033
- Table 18: Global Tram-Train Revenue billion Forecast, by Country 2020 & 2033
- Table 19: United Kingdom Tram-Train Revenue (billion) Forecast, by Application 2020 & 2033
- Table 20: Germany Tram-Train Revenue (billion) Forecast, by Application 2020 & 2033
- Table 21: France Tram-Train Revenue (billion) Forecast, by Application 2020 & 2033
- Table 22: Italy Tram-Train Revenue (billion) Forecast, by Application 2020 & 2033
- Table 23: Spain Tram-Train Revenue (billion) Forecast, by Application 2020 & 2033
- Table 24: Russia Tram-Train Revenue (billion) Forecast, by Application 2020 & 2033
- Table 25: Benelux Tram-Train Revenue (billion) Forecast, by Application 2020 & 2033
- Table 26: Nordics Tram-Train Revenue (billion) Forecast, by Application 2020 & 2033
- Table 27: Rest of Europe Tram-Train Revenue (billion) Forecast, by Application 2020 & 2033
- Table 28: Global Tram-Train Revenue billion Forecast, by Application 2020 & 2033
- Table 29: Global Tram-Train Revenue billion Forecast, by Types 2020 & 2033
- Table 30: Global Tram-Train Revenue billion Forecast, by Country 2020 & 2033
- Table 31: Turkey Tram-Train Revenue (billion) Forecast, by Application 2020 & 2033
- Table 32: Israel Tram-Train Revenue (billion) Forecast, by Application 2020 & 2033
- Table 33: GCC Tram-Train Revenue (billion) Forecast, by Application 2020 & 2033
- Table 34: North Africa Tram-Train Revenue (billion) Forecast, by Application 2020 & 2033
- Table 35: South Africa Tram-Train Revenue (billion) Forecast, by Application 2020 & 2033
- Table 36: Rest of Middle East & Africa Tram-Train Revenue (billion) Forecast, by Application 2020 & 2033
- Table 37: Global Tram-Train Revenue billion Forecast, by Application 2020 & 2033
- Table 38: Global Tram-Train Revenue billion Forecast, by Types 2020 & 2033
- Table 39: Global Tram-Train Revenue billion Forecast, by Country 2020 & 2033
- Table 40: China Tram-Train Revenue (billion) Forecast, by Application 2020 & 2033
- Table 41: India Tram-Train Revenue (billion) Forecast, by Application 2020 & 2033
- Table 42: Japan Tram-Train Revenue (billion) Forecast, by Application 2020 & 2033
- Table 43: South Korea Tram-Train Revenue (billion) Forecast, by Application 2020 & 2033
- Table 44: ASEAN Tram-Train Revenue (billion) Forecast, by Application 2020 & 2033
- Table 45: Oceania Tram-Train Revenue (billion) Forecast, by Application 2020 & 2033
- Table 46: Rest of Asia Pacific Tram-Train Revenue (billion) Forecast, by Application 2020 & 2033
Frequently Asked Questions
1. What is the projected Compound Annual Growth Rate (CAGR) of the Tram-Train?
The projected CAGR is approximately 4.4%.
2. Which companies are prominent players in the Tram-Train?
Key companies in the market include Bombardier, Alstom, Siemens, CAF, CRRC, PKTS/Metrovagonmash, Kinkisharyo, Stadler Rail, Škoda Transtech, Durmazlar, China CRRC Corporation Limited.
3. What are the main segments of the Tram-Train?
The market segments include Application, Types.
4. Can you provide details about the market size?
The market size is estimated to be USD 1.5 billion as of 2022.
5. What are some drivers contributing to market growth?
N/A
6. What are the notable trends driving market growth?
N/A
7. Are there any restraints impacting market growth?
N/A
8. Can you provide examples of recent developments in the market?
N/A
9. What pricing options are available for accessing the report?
Pricing options include single-user, multi-user, and enterprise licenses priced at USD 4900.00, USD 7350.00, and USD 9800.00 respectively.
10. Is the market size provided in terms of value or volume?
The market size is provided in terms of value, measured in billion.
11. Are there any specific market keywords associated with the report?
Yes, the market keyword associated with the report is "Tram-Train," which aids in identifying and referencing the specific market segment covered.
12. How do I determine which pricing option suits my needs best?
The pricing options vary based on user requirements and access needs. Individual users may opt for single-user licenses, while businesses requiring broader access may choose multi-user or enterprise licenses for cost-effective access to the report.
13. Are there any additional resources or data provided in the Tram-Train report?
While the report offers comprehensive insights, it's advisable to review the specific contents or supplementary materials provided to ascertain if additional resources or data are available.
14. How can I stay updated on further developments or reports in the Tram-Train?
To stay informed about further developments, trends, and reports in the Tram-Train, consider subscribing to industry newsletters, following relevant companies and organizations, or regularly checking reputable industry news sources and publications.
Methodology
Step 1 - Identification of Relevant Samples Size from Population Database


Step 2 - Approaches for Defining Global Market Size (Value, Volume* & Price*)

Note*: In applicable scenarios
Step 3 - Data Sources
Primary Research
- Web Analytics
- Survey Reports
- Research Institute
- Latest Research Reports
- Opinion Leaders
Secondary Research
- Annual Reports
- White Paper
- Latest Press Release
- Industry Association
- Paid Database
- Investor Presentations

Step 4 - Data Triangulation
Involves using different sources of information in order to increase the validity of a study
These sources are likely to be stakeholders in a program - participants, other researchers, program staff, other community members, and so on.
Then we put all data in single framework & apply various statistical tools to find out the dynamic on the market.
During the analysis stage, feedback from the stakeholder groups would be compared to determine areas of agreement as well as areas of divergence