

Key Insights
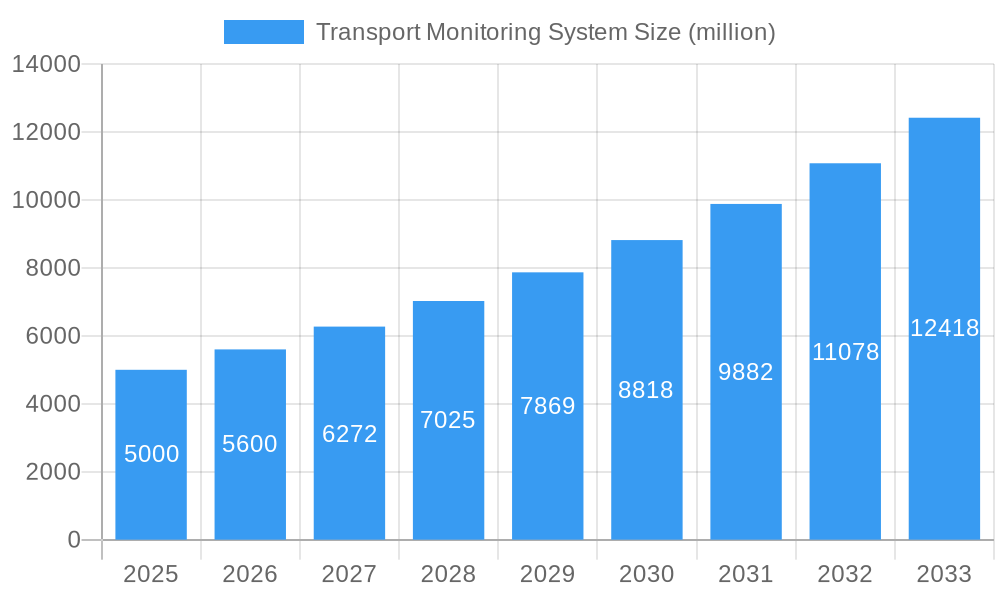
The global transport monitoring system market is experiencing robust growth, driven by increasing demand for enhanced safety, security, and efficiency in various transportation sectors. The market's expansion is fueled by several key factors, including the proliferation of connected vehicles, stringent government regulations mandating real-time tracking and data reporting, and the rising adoption of advanced technologies like GPS, IoT sensors, and AI-powered analytics. These technologies enable precise location tracking, fuel consumption monitoring, driver behavior analysis, and predictive maintenance, resulting in significant cost savings and operational improvements for businesses. Furthermore, the growing need to optimize logistics and supply chain management is contributing to the market's expansion, as real-time visibility into asset location and status allows for improved route planning, reduced delays, and enhanced overall efficiency. We estimate the market size in 2025 to be approximately $5 billion, with a compound annual growth rate (CAGR) of 12% projected through 2033. This growth will be fueled by continuous technological innovation and expanding applications across various transportation modes, including road, rail, maritime, and air.
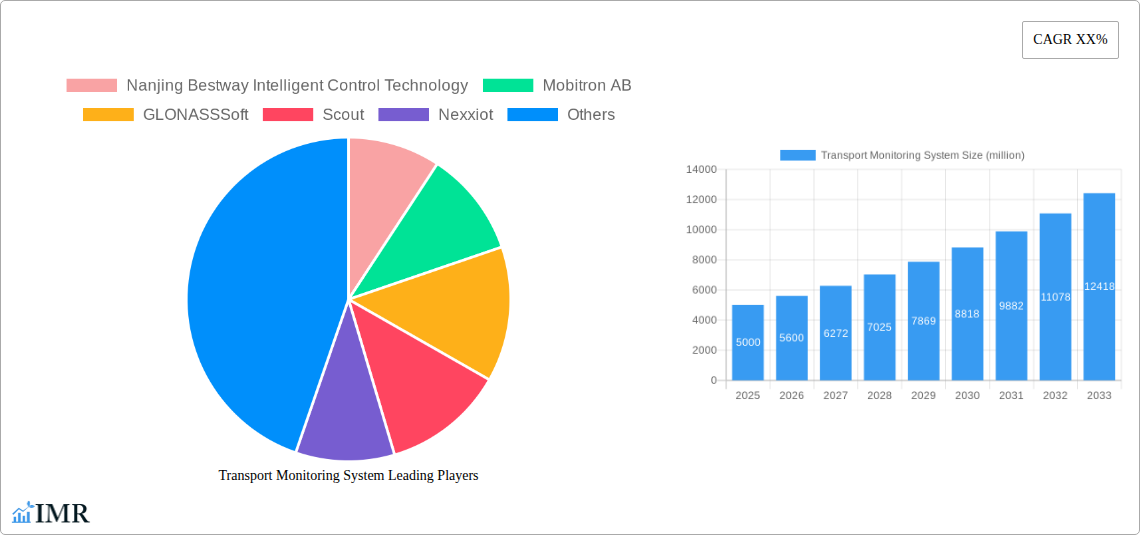
Transport Monitoring System Market Size (In Billion)
Despite the considerable growth opportunities, the market faces certain challenges. High initial investment costs associated with deploying and maintaining sophisticated monitoring systems can be a barrier to entry for smaller companies. Data security and privacy concerns also present significant hurdles, requiring robust cybersecurity measures to protect sensitive information. Furthermore, integration challenges with existing legacy systems and the need for skilled personnel to manage and interpret large volumes of data represent ongoing obstacles. Nevertheless, the long-term outlook remains positive, driven by the increasing benefits of enhanced visibility, optimized operations, and improved safety, making transport monitoring systems an increasingly indispensable asset across a wide range of transportation applications. Companies such as Nanjing Bestway, Mobitron AB, and Galileosky are key players shaping the market's trajectory through innovation and market penetration.
Transport Monitoring System Company Market Share
Transport Monitoring System Market Report: 2019-2033
This comprehensive report provides a detailed analysis of the Transport Monitoring System market, encompassing market dynamics, growth trends, regional dominance, product landscape, and key players. The study period covers 2019-2033, with a base year of 2025 and a forecast period of 2025-2033. The report leverages extensive data analysis to provide actionable insights for industry professionals, investors, and strategic decision-makers. The global market is valued at xx million in 2025 and projected to reach xx million by 2033, exhibiting a CAGR of xx%.
Transport Monitoring System Market Dynamics & Structure
The global transport monitoring system market is characterized by moderate concentration, with key players holding significant market share. However, the landscape is dynamic, driven by technological innovation and evolving regulatory frameworks. The market's growth is fueled by increasing demand for enhanced safety, efficiency, and security across various transport modes.
- Market Concentration: The top 5 players account for approximately xx% of the market share in 2025.
- Technological Innovation: Advancements in GPS technology, IoT, AI, and big data analytics are driving product development and market expansion. However, integration complexities and high initial investment represent significant innovation barriers.
- Regulatory Frameworks: Stringent regulations concerning data privacy and security are influencing market dynamics, especially in regions with robust data protection laws.
- Competitive Product Substitutes: Limited direct substitutes exist, though alternative solutions like manual tracking systems offer less sophisticated monitoring capabilities.
- End-User Demographics: Key end-users include logistics companies, transportation providers, government agencies, and fleet operators. Growth is significantly influenced by the adoption of these systems across different transport modes.
- M&A Trends: The number of M&A deals in the sector averaged xx per year during 2019-2024, indicating consolidation trends among key players.
Transport Monitoring System Growth Trends & Insights
The transport monitoring system market has experienced robust growth over the historical period (2019-2024), fueled by increasing freight volumes, the expansion of e-commerce, and rising concerns about supply chain security. The adoption rate is particularly high in developed regions with advanced logistics infrastructure. The market's growth is projected to continue its upward trajectory during the forecast period (2025-2033). Technological disruptions, particularly the integration of AI and machine learning, will further enhance the system’s capabilities, driving demand. Consumer behavior shifts towards greater transparency and real-time tracking also contribute to market expansion. The market is expected to reach xx million by 2033, representing substantial growth opportunities for key players.
Dominant Regions, Countries, or Segments in Transport Monitoring System
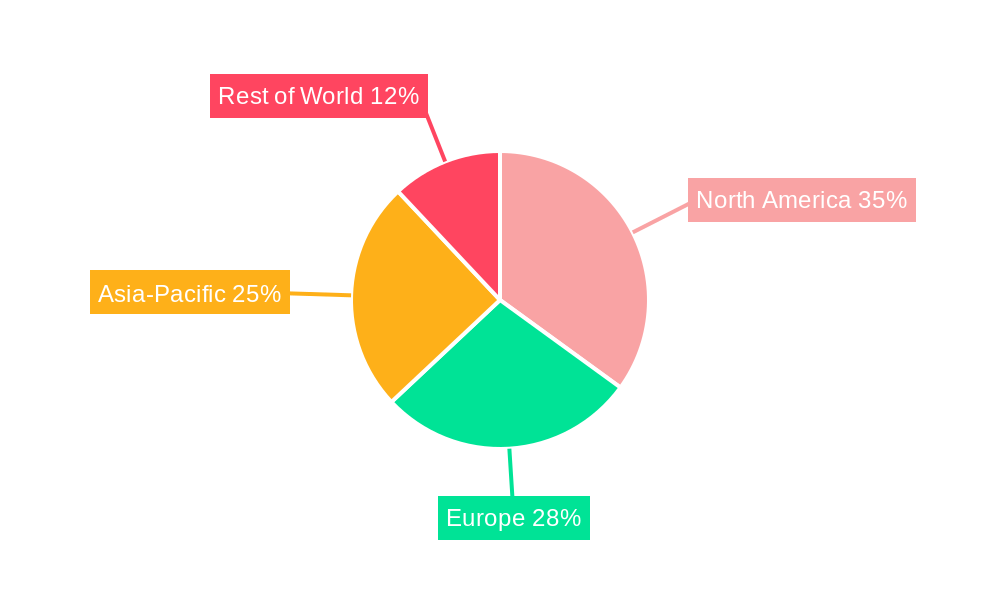
North America currently dominates the transport monitoring system market, driven by strong technological advancements, early adoption of advanced systems, and the well-developed logistics sector. However, rapidly growing economies in Asia-Pacific are expected to witness significant growth, contributing to a shift in regional market share during the forecast period.
- Key Drivers in North America: Robust regulatory frameworks, advanced technological infrastructure, and high investment in logistics optimization.
- Key Drivers in Asia-Pacific: Rapid economic growth, expanding e-commerce sector, and government initiatives promoting the adoption of advanced transportation technologies.
- Market Share: North America holds approximately xx% of the global market share in 2025, while Asia-Pacific is projected to reach xx% by 2033.
The Road Freight segment is the dominant market segment, accounting for approximately xx% of the market in 2025. This is attributed to the high volume of road freight and the rising demand for efficient and secure transportation.
Transport Monitoring System Product Landscape
The transport monitoring system market features a range of products with varying functionalities and technological capabilities, from basic GPS tracking devices to sophisticated systems incorporating AI-powered analytics. These systems offer real-time location tracking, route optimization, driver behavior monitoring, and cargo security features. Key innovations include advancements in telematics, integration with IoT devices, and the development of user-friendly interfaces.
Key Drivers, Barriers & Challenges in Transport Monitoring System
Key Drivers:
- Increasing demand for efficient and secure transportation.
- Stringent government regulations related to safety and security.
- Advancements in GPS, IoT, and AI technologies.
- Growth of e-commerce and the need for real-time tracking.
Challenges and Restraints:
- High initial investment costs for implementing transport monitoring systems.
- Data security and privacy concerns.
- Integration complexities with existing IT infrastructure.
- Dependence on reliable communication networks. A significant disruption to these networks could impact the functionality of the systems. This could represent a loss of xx million annually.
Emerging Opportunities in Transport Monitoring System
- Expansion into emerging markets with growing transportation sectors.
- Integration with autonomous vehicle technologies.
- Development of specialized systems for specific transport modes.
- Growth in predictive maintenance capabilities.
Growth Accelerators in the Transport Monitoring System Industry
Long-term growth will be driven by the convergence of advanced technologies, including AI, machine learning, and blockchain. Strategic partnerships between technology providers and transportation companies will accelerate innovation and adoption. Expansion into new market segments, such as last-mile delivery, will further drive growth.
Key Players Shaping the Transport Monitoring System Market
Notable Milestones in Transport Monitoring System Sector
- 2020: Introduction of 5G-enabled transport monitoring systems by several key players.
- 2022: Significant increase in the adoption of AI-powered analytics for route optimization and predictive maintenance.
- 2023: Several mergers and acquisitions among key players, leading to increased market consolidation.
In-Depth Transport Monitoring System Market Outlook
The transport monitoring system market is poised for significant growth over the forecast period, driven by technological advancements and increasing demand for efficient and secure transportation. Strategic partnerships, expansion into new markets, and the development of innovative applications will shape the future of the sector. The market holds immense potential for both established players and new entrants.
Transport Monitoring System Segmentation
-
1. Application
- 1.1. Railway
- 1.2. Highway
- 1.3. Others
-
2. Types
- 2.1. Temperature Monitoring
- 2.2. Driver Behavior Monitoring
- 2.3. Traffic Flow Monitoring
- 2.4. Others
Transport Monitoring System Segmentation By Geography
-
1. North America
- 1.1. United States
- 1.2. Canada
- 1.3. Mexico
-
2. South America
- 2.1. Brazil
- 2.2. Argentina
- 2.3. Rest of South America
-
3. Europe
- 3.1. United Kingdom
- 3.2. Germany
- 3.3. France
- 3.4. Italy
- 3.5. Spain
- 3.6. Russia
- 3.7. Benelux
- 3.8. Nordics
- 3.9. Rest of Europe
-
4. Middle East & Africa
- 4.1. Turkey
- 4.2. Israel
- 4.3. GCC
- 4.4. North Africa
- 4.5. South Africa
- 4.6. Rest of Middle East & Africa
-
5. Asia Pacific
- 5.1. China
- 5.2. India
- 5.3. Japan
- 5.4. South Korea
- 5.5. ASEAN
- 5.6. Oceania
- 5.7. Rest of Asia Pacific
Transport Monitoring System Regional Market Share
Geographic Coverage of Transport Monitoring System
Transport Monitoring System REPORT HIGHLIGHTS
| Aspects | Details |
|---|---|
| Study Period | 2020-2034 |
| Base Year | 2025 |
| Estimated Year | 2026 |
| Forecast Period | 2026-2034 |
| Historical Period | 2020-2025 |
| Growth Rate | CAGR of XX% from 2020-2034 |
| Segmentation |
|
Table of Contents
- 1. Introduction
- 1.1. Research Scope
- 1.2. Market Segmentation
- 1.3. Research Objective
- 1.4. Definitions and Assumptions
- 2. Executive Summary
- 2.1. Market Snapshot
- 3. Market Dynamics
- 3.1. Market Drivers
- 3.2. Market Restrains
- 3.3. Market Trends
- 3.4. Market Opportunities
- 4. Market Factor Analysis
- 4.1. Porters Five Forces
- 4.1.1. Bargaining Power of Suppliers
- 4.1.2. Bargaining Power of Buyers
- 4.1.3. Threat of New Entrants
- 4.1.4. Threat of Substitutes
- 4.1.5. Competitive Rivalry
- 4.2. PESTEL analysis
- 4.3. BCG Analysis
- 4.3.1. Stars (High Growth, High Market Share)
- 4.3.2. Cash Cows (Low Growth, High Market Share)
- 4.3.3. Question Mark (High Growth, Low Market Share)
- 4.3.4. Dogs (Low Growth, Low Market Share)
- 4.4. Ansoff Matrix Analysis
- 4.5. Supply Chain Analysis
- 4.6. Regulatory Landscape
- 4.7. Current Market Potential and Opportunity Assessment (TAM–SAM–SOM Framework)
- 4.8. IMR Analyst Note
- 4.1. Porters Five Forces
- 5. Market Analysis, Insights and Forecast 2021-2033
- 5.1. Market Analysis, Insights and Forecast - by Application
- 5.1.1. Railway
- 5.1.2. Highway
- 5.1.3. Others
- 5.2. Market Analysis, Insights and Forecast - by Types
- 5.2.1. Temperature Monitoring
- 5.2.2. Driver Behavior Monitoring
- 5.2.3. Traffic Flow Monitoring
- 5.2.4. Others
- 5.3. Market Analysis, Insights and Forecast - by Region
- 5.3.1. North America
- 5.3.2. South America
- 5.3.3. Europe
- 5.3.4. Middle East & Africa
- 5.3.5. Asia Pacific
- 5.1. Market Analysis, Insights and Forecast - by Application
- 6. Global Transport Monitoring System Analysis, Insights and Forecast, 2021-2033
- 6.1. Market Analysis, Insights and Forecast - by Application
- 6.1.1. Railway
- 6.1.2. Highway
- 6.1.3. Others
- 6.2. Market Analysis, Insights and Forecast - by Types
- 6.2.1. Temperature Monitoring
- 6.2.2. Driver Behavior Monitoring
- 6.2.3. Traffic Flow Monitoring
- 6.2.4. Others
- 6.1. Market Analysis, Insights and Forecast - by Application
- 7. North America Transport Monitoring System Analysis, Insights and Forecast, 2020-2032
- 7.1. Market Analysis, Insights and Forecast - by Application
- 7.1.1. Railway
- 7.1.2. Highway
- 7.1.3. Others
- 7.2. Market Analysis, Insights and Forecast - by Types
- 7.2.1. Temperature Monitoring
- 7.2.2. Driver Behavior Monitoring
- 7.2.3. Traffic Flow Monitoring
- 7.2.4. Others
- 7.1. Market Analysis, Insights and Forecast - by Application
- 8. South America Transport Monitoring System Analysis, Insights and Forecast, 2020-2032
- 8.1. Market Analysis, Insights and Forecast - by Application
- 8.1.1. Railway
- 8.1.2. Highway
- 8.1.3. Others
- 8.2. Market Analysis, Insights and Forecast - by Types
- 8.2.1. Temperature Monitoring
- 8.2.2. Driver Behavior Monitoring
- 8.2.3. Traffic Flow Monitoring
- 8.2.4. Others
- 8.1. Market Analysis, Insights and Forecast - by Application
- 9. Europe Transport Monitoring System Analysis, Insights and Forecast, 2020-2032
- 9.1. Market Analysis, Insights and Forecast - by Application
- 9.1.1. Railway
- 9.1.2. Highway
- 9.1.3. Others
- 9.2. Market Analysis, Insights and Forecast - by Types
- 9.2.1. Temperature Monitoring
- 9.2.2. Driver Behavior Monitoring
- 9.2.3. Traffic Flow Monitoring
- 9.2.4. Others
- 9.1. Market Analysis, Insights and Forecast - by Application
- 10. Middle East & Africa Transport Monitoring System Analysis, Insights and Forecast, 2020-2032
- 10.1. Market Analysis, Insights and Forecast - by Application
- 10.1.1. Railway
- 10.1.2. Highway
- 10.1.3. Others
- 10.2. Market Analysis, Insights and Forecast - by Types
- 10.2.1. Temperature Monitoring
- 10.2.2. Driver Behavior Monitoring
- 10.2.3. Traffic Flow Monitoring
- 10.2.4. Others
- 10.1. Market Analysis, Insights and Forecast - by Application
- 11. Asia Pacific Transport Monitoring System Analysis, Insights and Forecast, 2020-2032
- 11.1. Market Analysis, Insights and Forecast - by Application
- 11.1.1. Railway
- 11.1.2. Highway
- 11.1.3. Others
- 11.2. Market Analysis, Insights and Forecast - by Types
- 11.2.1. Temperature Monitoring
- 11.2.2. Driver Behavior Monitoring
- 11.2.3. Traffic Flow Monitoring
- 11.2.4. Others
- 11.1. Market Analysis, Insights and Forecast - by Application
- 12. Competitive Analysis
- 12.1. Company Profiles
- 12.1.1 Nanjing Bestway Intelligent Control Technology
- 12.1.1.1. Company Overview
- 12.1.1.2. Products
- 12.1.1.3. Company Financials
- 12.1.1.4. SWOT Analysis
- 12.1.2 Mobitron AB
- 12.1.2.1. Company Overview
- 12.1.2.2. Products
- 12.1.2.3. Company Financials
- 12.1.2.4. SWOT Analysis
- 12.1.3 GLONASSSoft
- 12.1.3.1. Company Overview
- 12.1.3.2. Products
- 12.1.3.3. Company Financials
- 12.1.3.4. SWOT Analysis
- 12.1.4 Scout
- 12.1.4.1. Company Overview
- 12.1.4.2. Products
- 12.1.4.3. Company Financials
- 12.1.4.4. SWOT Analysis
- 12.1.5 Nexxiot
- 12.1.5.1. Company Overview
- 12.1.5.2. Products
- 12.1.5.3. Company Financials
- 12.1.5.4. SWOT Analysis
- 12.1.6 Industrial Networking Solutions (INS)
- 12.1.6.1. Company Overview
- 12.1.6.2. Products
- 12.1.6.3. Company Financials
- 12.1.6.4. SWOT Analysis
- 12.1.7 Mesa Labs
- 12.1.7.1. Company Overview
- 12.1.7.2. Products
- 12.1.7.3. Company Financials
- 12.1.7.4. SWOT Analysis
- 12.1.8 iData
- 12.1.8.1. Company Overview
- 12.1.8.2. Products
- 12.1.8.3. Company Financials
- 12.1.8.4. SWOT Analysis
- 12.1.9 Zucchetti Axess
- 12.1.9.1. Company Overview
- 12.1.9.2. Products
- 12.1.9.3. Company Financials
- 12.1.9.4. SWOT Analysis
- 12.1.10 Galileosky
- 12.1.10.1. Company Overview
- 12.1.10.2. Products
- 12.1.10.3. Company Financials
- 12.1.10.4. SWOT Analysis
- 12.1.11 TÜV Rheinland
- 12.1.11.1. Company Overview
- 12.1.11.2. Products
- 12.1.11.3. Company Financials
- 12.1.11.4. SWOT Analysis
- 12.1.12 FMS Tech
- 12.1.12.1. Company Overview
- 12.1.12.2. Products
- 12.1.12.3. Company Financials
- 12.1.12.4. SWOT Analysis
- 12.1.13 Telent
- 12.1.13.1. Company Overview
- 12.1.13.2. Products
- 12.1.13.3. Company Financials
- 12.1.13.4. SWOT Analysis
- 12.1.14 Hertz Systems
- 12.1.14.1. Company Overview
- 12.1.14.2. Products
- 12.1.14.3. Company Financials
- 12.1.14.4. SWOT Analysis
- 12.1.15 Teleste
- 12.1.15.1. Company Overview
- 12.1.15.2. Products
- 12.1.15.3. Company Financials
- 12.1.15.4. SWOT Analysis
- 12.1.16 IDC
- 12.1.16.1. Company Overview
- 12.1.16.2. Products
- 12.1.16.3. Company Financials
- 12.1.16.4. SWOT Analysis
- 12.1.17 CWI Technical
- 12.1.17.1. Company Overview
- 12.1.17.2. Products
- 12.1.17.3. Company Financials
- 12.1.17.4. SWOT Analysis
- 12.1.18 GPS.AZ
- 12.1.18.1. Company Overview
- 12.1.18.2. Products
- 12.1.18.3. Company Financials
- 12.1.18.4. SWOT Analysis
- 12.1.1 Nanjing Bestway Intelligent Control Technology
- 12.2. Market Entropy
- 12.2.1 Company's Key Areas Served
- 12.2.2 Recent Developments
- 12.3. Company Market Share Analysis 2025
- 12.3.1 Top 5 Companies Market Share Analysis
- 12.3.2 Top 3 Companies Market Share Analysis
- 12.4. List of Potential Customers
- 13. Research Methodology
List of Figures
- Figure 1: Global Transport Monitoring System Revenue Breakdown (million, %) by Region 2025 & 2033
- Figure 2: North America Transport Monitoring System Revenue (million), by Application 2025 & 2033
- Figure 3: North America Transport Monitoring System Revenue Share (%), by Application 2025 & 2033
- Figure 4: North America Transport Monitoring System Revenue (million), by Types 2025 & 2033
- Figure 5: North America Transport Monitoring System Revenue Share (%), by Types 2025 & 2033
- Figure 6: North America Transport Monitoring System Revenue (million), by Country 2025 & 2033
- Figure 7: North America Transport Monitoring System Revenue Share (%), by Country 2025 & 2033
- Figure 8: South America Transport Monitoring System Revenue (million), by Application 2025 & 2033
- Figure 9: South America Transport Monitoring System Revenue Share (%), by Application 2025 & 2033
- Figure 10: South America Transport Monitoring System Revenue (million), by Types 2025 & 2033
- Figure 11: South America Transport Monitoring System Revenue Share (%), by Types 2025 & 2033
- Figure 12: South America Transport Monitoring System Revenue (million), by Country 2025 & 2033
- Figure 13: South America Transport Monitoring System Revenue Share (%), by Country 2025 & 2033
- Figure 14: Europe Transport Monitoring System Revenue (million), by Application 2025 & 2033
- Figure 15: Europe Transport Monitoring System Revenue Share (%), by Application 2025 & 2033
- Figure 16: Europe Transport Monitoring System Revenue (million), by Types 2025 & 2033
- Figure 17: Europe Transport Monitoring System Revenue Share (%), by Types 2025 & 2033
- Figure 18: Europe Transport Monitoring System Revenue (million), by Country 2025 & 2033
- Figure 19: Europe Transport Monitoring System Revenue Share (%), by Country 2025 & 2033
- Figure 20: Middle East & Africa Transport Monitoring System Revenue (million), by Application 2025 & 2033
- Figure 21: Middle East & Africa Transport Monitoring System Revenue Share (%), by Application 2025 & 2033
- Figure 22: Middle East & Africa Transport Monitoring System Revenue (million), by Types 2025 & 2033
- Figure 23: Middle East & Africa Transport Monitoring System Revenue Share (%), by Types 2025 & 2033
- Figure 24: Middle East & Africa Transport Monitoring System Revenue (million), by Country 2025 & 2033
- Figure 25: Middle East & Africa Transport Monitoring System Revenue Share (%), by Country 2025 & 2033
- Figure 26: Asia Pacific Transport Monitoring System Revenue (million), by Application 2025 & 2033
- Figure 27: Asia Pacific Transport Monitoring System Revenue Share (%), by Application 2025 & 2033
- Figure 28: Asia Pacific Transport Monitoring System Revenue (million), by Types 2025 & 2033
- Figure 29: Asia Pacific Transport Monitoring System Revenue Share (%), by Types 2025 & 2033
- Figure 30: Asia Pacific Transport Monitoring System Revenue (million), by Country 2025 & 2033
- Figure 31: Asia Pacific Transport Monitoring System Revenue Share (%), by Country 2025 & 2033
List of Tables
- Table 1: Global Transport Monitoring System Revenue million Forecast, by Application 2020 & 2033
- Table 2: Global Transport Monitoring System Revenue million Forecast, by Types 2020 & 2033
- Table 3: Global Transport Monitoring System Revenue million Forecast, by Region 2020 & 2033
- Table 4: Global Transport Monitoring System Revenue million Forecast, by Application 2020 & 2033
- Table 5: Global Transport Monitoring System Revenue million Forecast, by Types 2020 & 2033
- Table 6: Global Transport Monitoring System Revenue million Forecast, by Country 2020 & 2033
- Table 7: United States Transport Monitoring System Revenue (million) Forecast, by Application 2020 & 2033
- Table 8: Canada Transport Monitoring System Revenue (million) Forecast, by Application 2020 & 2033
- Table 9: Mexico Transport Monitoring System Revenue (million) Forecast, by Application 2020 & 2033
- Table 10: Global Transport Monitoring System Revenue million Forecast, by Application 2020 & 2033
- Table 11: Global Transport Monitoring System Revenue million Forecast, by Types 2020 & 2033
- Table 12: Global Transport Monitoring System Revenue million Forecast, by Country 2020 & 2033
- Table 13: Brazil Transport Monitoring System Revenue (million) Forecast, by Application 2020 & 2033
- Table 14: Argentina Transport Monitoring System Revenue (million) Forecast, by Application 2020 & 2033
- Table 15: Rest of South America Transport Monitoring System Revenue (million) Forecast, by Application 2020 & 2033
- Table 16: Global Transport Monitoring System Revenue million Forecast, by Application 2020 & 2033
- Table 17: Global Transport Monitoring System Revenue million Forecast, by Types 2020 & 2033
- Table 18: Global Transport Monitoring System Revenue million Forecast, by Country 2020 & 2033
- Table 19: United Kingdom Transport Monitoring System Revenue (million) Forecast, by Application 2020 & 2033
- Table 20: Germany Transport Monitoring System Revenue (million) Forecast, by Application 2020 & 2033
- Table 21: France Transport Monitoring System Revenue (million) Forecast, by Application 2020 & 2033
- Table 22: Italy Transport Monitoring System Revenue (million) Forecast, by Application 2020 & 2033
- Table 23: Spain Transport Monitoring System Revenue (million) Forecast, by Application 2020 & 2033
- Table 24: Russia Transport Monitoring System Revenue (million) Forecast, by Application 2020 & 2033
- Table 25: Benelux Transport Monitoring System Revenue (million) Forecast, by Application 2020 & 2033
- Table 26: Nordics Transport Monitoring System Revenue (million) Forecast, by Application 2020 & 2033
- Table 27: Rest of Europe Transport Monitoring System Revenue (million) Forecast, by Application 2020 & 2033
- Table 28: Global Transport Monitoring System Revenue million Forecast, by Application 2020 & 2033
- Table 29: Global Transport Monitoring System Revenue million Forecast, by Types 2020 & 2033
- Table 30: Global Transport Monitoring System Revenue million Forecast, by Country 2020 & 2033
- Table 31: Turkey Transport Monitoring System Revenue (million) Forecast, by Application 2020 & 2033
- Table 32: Israel Transport Monitoring System Revenue (million) Forecast, by Application 2020 & 2033
- Table 33: GCC Transport Monitoring System Revenue (million) Forecast, by Application 2020 & 2033
- Table 34: North Africa Transport Monitoring System Revenue (million) Forecast, by Application 2020 & 2033
- Table 35: South Africa Transport Monitoring System Revenue (million) Forecast, by Application 2020 & 2033
- Table 36: Rest of Middle East & Africa Transport Monitoring System Revenue (million) Forecast, by Application 2020 & 2033
- Table 37: Global Transport Monitoring System Revenue million Forecast, by Application 2020 & 2033
- Table 38: Global Transport Monitoring System Revenue million Forecast, by Types 2020 & 2033
- Table 39: Global Transport Monitoring System Revenue million Forecast, by Country 2020 & 2033
- Table 40: China Transport Monitoring System Revenue (million) Forecast, by Application 2020 & 2033
- Table 41: India Transport Monitoring System Revenue (million) Forecast, by Application 2020 & 2033
- Table 42: Japan Transport Monitoring System Revenue (million) Forecast, by Application 2020 & 2033
- Table 43: South Korea Transport Monitoring System Revenue (million) Forecast, by Application 2020 & 2033
- Table 44: ASEAN Transport Monitoring System Revenue (million) Forecast, by Application 2020 & 2033
- Table 45: Oceania Transport Monitoring System Revenue (million) Forecast, by Application 2020 & 2033
- Table 46: Rest of Asia Pacific Transport Monitoring System Revenue (million) Forecast, by Application 2020 & 2033
Frequently Asked Questions
1. What is the projected Compound Annual Growth Rate (CAGR) of the Transport Monitoring System?
The projected CAGR is approximately XX%.
2. Which companies are prominent players in the Transport Monitoring System?
Key companies in the market include Nanjing Bestway Intelligent Control Technology, Mobitron AB, GLONASSSoft, Scout, Nexxiot, Industrial Networking Solutions (INS), Mesa Labs, iData, Zucchetti Axess, Galileosky, TÜV Rheinland, FMS Tech, Telent, Hertz Systems, Teleste, IDC, CWI Technical, GPS.AZ.
3. What are the main segments of the Transport Monitoring System?
The market segments include Application, Types.
4. Can you provide details about the market size?
The market size is estimated to be USD XXX million as of 2022.
5. What are some drivers contributing to market growth?
N/A
6. What are the notable trends driving market growth?
N/A
7. Are there any restraints impacting market growth?
N/A
8. Can you provide examples of recent developments in the market?
N/A
9. What pricing options are available for accessing the report?
Pricing options include single-user, multi-user, and enterprise licenses priced at USD 2900.00, USD 4350.00, and USD 5800.00 respectively.
10. Is the market size provided in terms of value or volume?
The market size is provided in terms of value, measured in million.
11. Are there any specific market keywords associated with the report?
Yes, the market keyword associated with the report is "Transport Monitoring System," which aids in identifying and referencing the specific market segment covered.
12. How do I determine which pricing option suits my needs best?
The pricing options vary based on user requirements and access needs. Individual users may opt for single-user licenses, while businesses requiring broader access may choose multi-user or enterprise licenses for cost-effective access to the report.
13. Are there any additional resources or data provided in the Transport Monitoring System report?
While the report offers comprehensive insights, it's advisable to review the specific contents or supplementary materials provided to ascertain if additional resources or data are available.
14. How can I stay updated on further developments or reports in the Transport Monitoring System?
To stay informed about further developments, trends, and reports in the Transport Monitoring System, consider subscribing to industry newsletters, following relevant companies and organizations, or regularly checking reputable industry news sources and publications.
Methodology
Step 1 - Identification of Relevant Samples Size from Population Database


Step 2 - Approaches for Defining Global Market Size (Value, Volume* & Price*)

Note*: In applicable scenarios
Step 3 - Data Sources
Primary Research
- Web Analytics
- Survey Reports
- Research Institute
- Latest Research Reports
- Opinion Leaders
Secondary Research
- Annual Reports
- White Paper
- Latest Press Release
- Industry Association
- Paid Database
- Investor Presentations

Step 4 - Data Triangulation
Involves using different sources of information in order to increase the validity of a study
These sources are likely to be stakeholders in a program - participants, other researchers, program staff, other community members, and so on.
Then we put all data in single framework & apply various statistical tools to find out the dynamic on the market.
During the analysis stage, feedback from the stakeholder groups would be compared to determine areas of agreement as well as areas of divergence