

Key Insights
The ultralight aviation market, encompassing paramotors, gyrocopters, and lightweight aircraft, is exhibiting substantial expansion. This growth is propelled by escalating recreational pursuits, expanding tourism, and technological advancements in aircraft design. Beyond leisure, applications in aerial photography, surveillance, and emergency response are significant contributors to market development. The market is projected to reach $16.3 billion by 2025, with an anticipated Compound Annual Growth Rate (CAGR) of 7.6% through 2033. This trajectory is underpinned by continuous innovation, resulting in safer, more reliable, and increasingly accessible aircraft. Paramotors currently dominate market share due to their affordability and ease of operation. However, gyrocopters are experiencing rapid growth, driven by enhanced safety features and superior performance. Key market restraints include rigorous safety regulations and certification hurdles, potentially limiting entry, especially in developing regions. Economic fluctuations could also impact discretionary spending on recreational aviation.
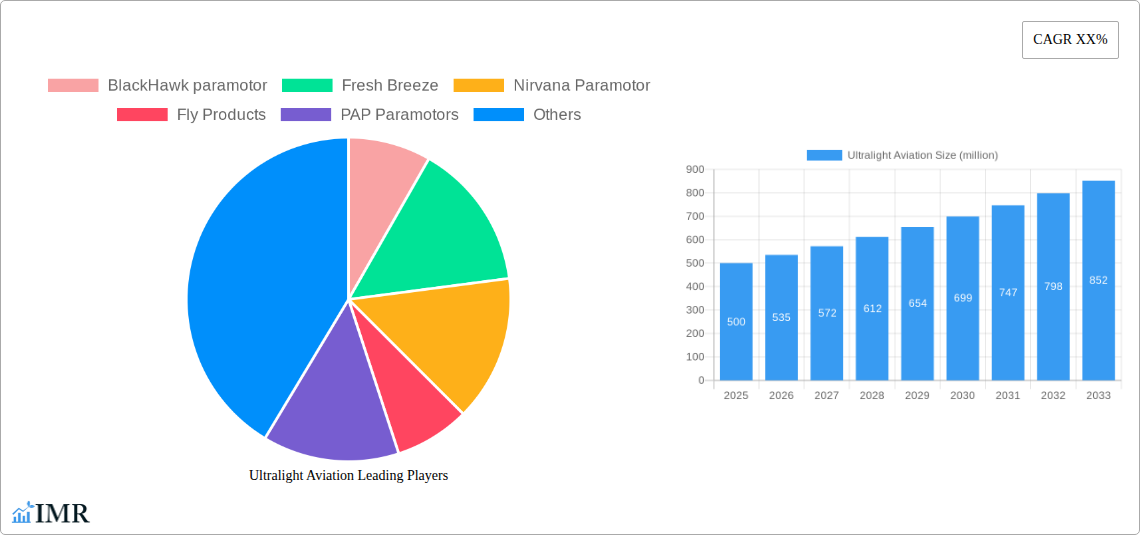
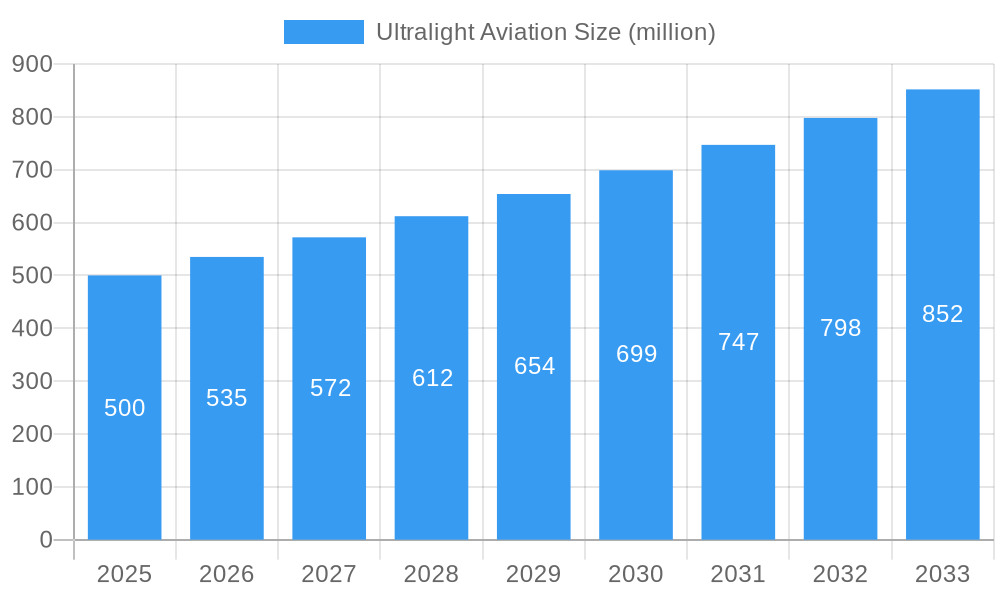
Ultralight Aviation Market Size (In Billion)
The long-term forecast for the ultralight aviation sector remains optimistic. Advancements in materials science and propulsion systems are set to boost aircraft performance, durability, and safety. The emergence of sustainable propulsion, such as electric motors, is expected to attract environmentally aware consumers. The industry is witnessing increased engagement from established players like BlackHawk Paramotor, Parajet Paramotors, and AutoGyro, alongside new entrants focusing on innovative designs. While North America and Europe currently lead market activity, the Asia-Pacific region presents significant future growth potential, fueled by rising disposable incomes and a growing interest in adventure sports. The development of comprehensive training programs and improved infrastructure will be crucial for sustained industry expansion.
Ultralight Aviation Company Market Share
Ultralight Aviation Market Report: 2019-2033
This comprehensive report provides a detailed analysis of the ultralight aviation market, encompassing market dynamics, growth trends, regional insights, product landscape, and future outlook. The study period covers 2019-2033, with 2025 as the base and estimated year. The forecast period spans 2025-2033, and the historical period encompasses 2019-2024. This report is crucial for industry professionals, investors, and anyone seeking to understand this dynamic sector. The market is segmented into Paramotors, Gyrocopters, and other Ultralight Aircraft. The parent market is General Aviation, and the child market is recreational flying.
Keywords: Ultralight Aviation Market, Paramotor Market, Gyrocopter Market, Ultralight Aircraft Market, General Aviation, Recreational Flying, Market Size, Market Share, Growth Rate, CAGR, Market Analysis, Industry Trends, Competitive Landscape, Key Players, BlackHawk Paramotor, Fresh Breeze, Nirvana Paramotor, Fly Products, PAP Paramotors, Parajet Paramotors, AutoGyro, Magni Gyro, ELA Aviation, Sun Hawk Aviation, Xiangchen Tongfei, JSTOL, Macfly Paramotor, Trixy Aviation Products, Aviomania Aircraft, Rotorvox, Niki Rotor Aviation, U-Turn GmbH, Sonex Aircraft, Skywalk GmbH, Market Forecast, Market Research
Ultralight Aviation Market Dynamics & Structure
The ultralight aviation market is characterized by a moderately fragmented landscape, with several key players competing across different segments (paramotors, gyrocopters, and other aircraft). The market size in 2025 is estimated at $xx million, with a projected CAGR of xx% during 2025-2033. Technological advancements, particularly in materials science and engine technology, are key drivers of innovation. However, stringent regulatory frameworks and safety concerns present significant barriers. Substitutes such as drones for aerial photography or recreational activities pose a competitive threat.
- Market Concentration: Moderately fragmented, with no single dominant player holding more than xx% market share in 2025.
- Technological Innovation: Focus on lightweight materials, improved engine efficiency, and enhanced safety features.
- Regulatory Frameworks: Stringent safety regulations vary across regions, impacting market growth.
- Competitive Product Substitutes: Drones and other recreational aerial platforms.
- End-User Demographics: Primarily enthusiasts, recreational pilots, and some commercial applications (e.g., aerial photography).
- M&A Trends: A moderate level of M&A activity, with xx deals recorded between 2019 and 2024, primarily focused on consolidation and expansion into new markets.
Ultralight Aviation Growth Trends & Insights
The ultralight aviation market experienced significant growth during the historical period (2019-2024), driven by increasing disposable incomes, rising interest in recreational activities, and technological advancements leading to improved safety and affordability. The market size grew from $xx million in 2019 to $xx million in 2024, representing a CAGR of xx%. This growth is projected to continue during the forecast period (2025-2033), albeit at a slightly moderated pace, driven by factors such as expanding tourism, increasing adoption of ultralight aircraft for training purposes, and the ongoing development of electric ultralight aircraft which have seen growing adoption and market penetration. Consumer behavior shifts towards experience-based tourism and adventure activities further support market expansion. However, economic downturns and changes in regulatory environments could impact future growth rates.
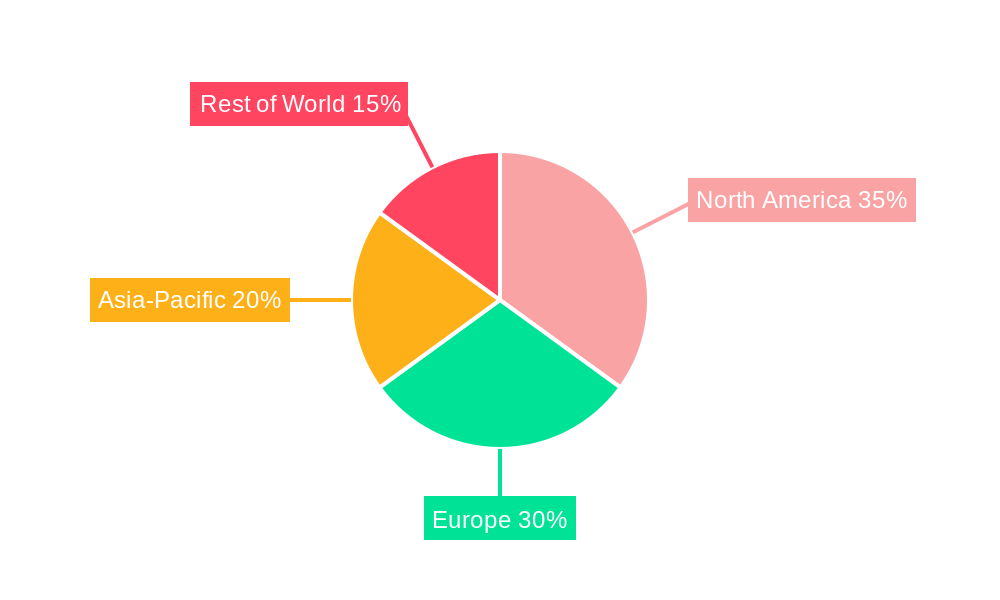
Dominant Regions, Countries, or Segments in Ultralight Aviation
North America and Europe currently dominate the ultralight aviation market, accounting for xx% and xx% of the global market share in 2025 respectively. This dominance is attributable to a combination of factors including established aviation infrastructure, strong regulatory frameworks, a high concentration of ultralight aircraft enthusiasts and a higher disposable income among consumers.
- Key Drivers in North America: Strong recreational aviation culture, well-developed infrastructure, and favorable regulatory environment.
- Key Drivers in Europe: High demand for recreational flying activities, significant tourism sector, and government support for the general aviation industry.
- Growth Potential in Asia-Pacific: Rapid economic growth and a rising middle class are expected to drive market growth in the Asia-Pacific region in the coming years.
Ultralight Aviation Product Landscape
The ultralight aviation sector offers a range of products, including paramotors, gyrocopters, and other lightweight aircraft. Recent innovations focus on enhanced safety features, improved fuel efficiency, and increased payload capacity. Many manufacturers emphasize unique selling propositions like superior maneuverability, ease of use, and advanced technological integration. The market also sees a growing trend toward electric propulsion systems, promising significant improvements in environmental friendliness and operating costs.
Key Drivers, Barriers & Challenges in Ultralight Aviation
Key Drivers:
- Increasing disposable incomes and leisure time among consumers.
- Growing interest in recreational aviation and adventure tourism.
- Technological advancements, including improved safety features and engine efficiency.
- Government initiatives to promote general aviation and recreational flying.
Challenges and Restraints:
- Stringent safety regulations and certification processes.
- High initial investment costs for aircraft and training.
- Economic downturns impacting consumer spending on recreational activities.
- Competition from substitute products such as drones.
- Supply chain disruptions impacting the availability of parts and materials, resulting in production delays and potentially causing price increases of approximately xx%.
Emerging Opportunities in Ultralight Aviation
- Expansion into untapped markets in developing countries.
- Increasing adoption of ultralight aircraft for aerial photography, surveillance, and other commercial applications.
- Growing interest in electric and hybrid propulsion systems, offering environmental and cost benefits.
- Development of innovative applications such as aerial tourism and adventure sports.
Growth Accelerators in the Ultralight Aviation Industry
Technological breakthroughs in lightweight materials, electric propulsion, and autonomous flight control systems are key growth catalysts. Strategic partnerships between manufacturers, training organizations, and tourism companies are also accelerating market expansion. Furthermore, government initiatives promoting general aviation and recreational flying create a positive environment for continued growth.
Key Players Shaping the Ultralight Aviation Market
- BlackHawk Paramotor
- Fresh Breeze
- Nirvana Paramotor
- Fly Products
- PAP Paramotors
- Parajet Paramotors
- AutoGyro
- Magni Gyro
- ELA Aviation
- Sun Hawk Aviation
- Xiangchen Tongfei
- JSTOL
- Macfly Paramotor
- Trixy Aviation Products
- Aviomania Aircraft
- Rotorvox
- Niki Rotor Aviation
- U-Turn GmbH
- Sonex Aircraft
- Skywalk GmbH
Notable Milestones in Ultralight Aviation Sector
- 2020: Introduction of the first commercially viable electric paramotor by [Company Name].
- 2022: Merger between [Company A] and [Company B], creating a larger player in the gyrocopter segment.
- 2023: Launch of a new lightweight, high-performance paramotor model by [Company Name].
- 2024: Relaxation of regulations in [Country] leading to increased market penetration.
In-Depth Ultralight Aviation Market Outlook
The ultralight aviation market is poised for continued growth driven by technological advancements, expanding recreational opportunities, and increased market penetration in emerging economies. Strategic partnerships and innovations in electric and hybrid propulsion systems will shape future market dynamics, creating significant opportunities for established and new players alike. The projected market size of $xx million in 2033 demonstrates the substantial growth potential of this sector.
Ultralight Aviation Segmentation
-
1. Application
- 1.1. Civil
- 1.2. Military
-
2. Types
- 2.1. Paragliding
- 2.2. Paramotors
- 2.3. Gyroplanes
- 2.4. Other
Ultralight Aviation Segmentation By Geography
-
1. North America
- 1.1. United States
- 1.2. Canada
- 1.3. Mexico
-
2. South America
- 2.1. Brazil
- 2.2. Argentina
- 2.3. Rest of South America
-
3. Europe
- 3.1. United Kingdom
- 3.2. Germany
- 3.3. France
- 3.4. Italy
- 3.5. Spain
- 3.6. Russia
- 3.7. Benelux
- 3.8. Nordics
- 3.9. Rest of Europe
-
4. Middle East & Africa
- 4.1. Turkey
- 4.2. Israel
- 4.3. GCC
- 4.4. North Africa
- 4.5. South Africa
- 4.6. Rest of Middle East & Africa
-
5. Asia Pacific
- 5.1. China
- 5.2. India
- 5.3. Japan
- 5.4. South Korea
- 5.5. ASEAN
- 5.6. Oceania
- 5.7. Rest of Asia Pacific
Ultralight Aviation Regional Market Share
Geographic Coverage of Ultralight Aviation
Ultralight Aviation REPORT HIGHLIGHTS
| Aspects | Details |
|---|---|
| Study Period | 2020-2034 |
| Base Year | 2025 |
| Estimated Year | 2026 |
| Forecast Period | 2026-2034 |
| Historical Period | 2020-2025 |
| Growth Rate | CAGR of 7.6% from 2020-2034 |
| Segmentation |
|
Table of Contents
- 1. Introduction
- 1.1. Research Scope
- 1.2. Market Segmentation
- 1.3. Research Objective
- 1.4. Definitions and Assumptions
- 2. Executive Summary
- 2.1. Market Snapshot
- 3. Market Dynamics
- 3.1. Market Drivers
- 3.2. Market Restrains
- 3.3. Market Trends
- 3.4. Market Opportunities
- 4. Market Factor Analysis
- 4.1. Porters Five Forces
- 4.1.1. Bargaining Power of Suppliers
- 4.1.2. Bargaining Power of Buyers
- 4.1.3. Threat of New Entrants
- 4.1.4. Threat of Substitutes
- 4.1.5. Competitive Rivalry
- 4.2. PESTEL analysis
- 4.3. BCG Analysis
- 4.3.1. Stars (High Growth, High Market Share)
- 4.3.2. Cash Cows (Low Growth, High Market Share)
- 4.3.3. Question Mark (High Growth, Low Market Share)
- 4.3.4. Dogs (Low Growth, Low Market Share)
- 4.4. Ansoff Matrix Analysis
- 4.5. Supply Chain Analysis
- 4.6. Regulatory Landscape
- 4.7. Current Market Potential and Opportunity Assessment (TAM–SAM–SOM Framework)
- 4.8. IMR Analyst Note
- 4.1. Porters Five Forces
- 5. Market Analysis, Insights and Forecast 2021-2033
- 5.1. Market Analysis, Insights and Forecast - by Application
- 5.1.1. Civil
- 5.1.2. Military
- 5.2. Market Analysis, Insights and Forecast - by Types
- 5.2.1. Paragliding
- 5.2.2. Paramotors
- 5.2.3. Gyroplanes
- 5.2.4. Other
- 5.3. Market Analysis, Insights and Forecast - by Region
- 5.3.1. North America
- 5.3.2. South America
- 5.3.3. Europe
- 5.3.4. Middle East & Africa
- 5.3.5. Asia Pacific
- 5.1. Market Analysis, Insights and Forecast - by Application
- 6. Global Ultralight Aviation Analysis, Insights and Forecast, 2021-2033
- 6.1. Market Analysis, Insights and Forecast - by Application
- 6.1.1. Civil
- 6.1.2. Military
- 6.2. Market Analysis, Insights and Forecast - by Types
- 6.2.1. Paragliding
- 6.2.2. Paramotors
- 6.2.3. Gyroplanes
- 6.2.4. Other
- 6.1. Market Analysis, Insights and Forecast - by Application
- 7. North America Ultralight Aviation Analysis, Insights and Forecast, 2020-2032
- 7.1. Market Analysis, Insights and Forecast - by Application
- 7.1.1. Civil
- 7.1.2. Military
- 7.2. Market Analysis, Insights and Forecast - by Types
- 7.2.1. Paragliding
- 7.2.2. Paramotors
- 7.2.3. Gyroplanes
- 7.2.4. Other
- 7.1. Market Analysis, Insights and Forecast - by Application
- 8. South America Ultralight Aviation Analysis, Insights and Forecast, 2020-2032
- 8.1. Market Analysis, Insights and Forecast - by Application
- 8.1.1. Civil
- 8.1.2. Military
- 8.2. Market Analysis, Insights and Forecast - by Types
- 8.2.1. Paragliding
- 8.2.2. Paramotors
- 8.2.3. Gyroplanes
- 8.2.4. Other
- 8.1. Market Analysis, Insights and Forecast - by Application
- 9. Europe Ultralight Aviation Analysis, Insights and Forecast, 2020-2032
- 9.1. Market Analysis, Insights and Forecast - by Application
- 9.1.1. Civil
- 9.1.2. Military
- 9.2. Market Analysis, Insights and Forecast - by Types
- 9.2.1. Paragliding
- 9.2.2. Paramotors
- 9.2.3. Gyroplanes
- 9.2.4. Other
- 9.1. Market Analysis, Insights and Forecast - by Application
- 10. Middle East & Africa Ultralight Aviation Analysis, Insights and Forecast, 2020-2032
- 10.1. Market Analysis, Insights and Forecast - by Application
- 10.1.1. Civil
- 10.1.2. Military
- 10.2. Market Analysis, Insights and Forecast - by Types
- 10.2.1. Paragliding
- 10.2.2. Paramotors
- 10.2.3. Gyroplanes
- 10.2.4. Other
- 10.1. Market Analysis, Insights and Forecast - by Application
- 11. Asia Pacific Ultralight Aviation Analysis, Insights and Forecast, 2020-2032
- 11.1. Market Analysis, Insights and Forecast - by Application
- 11.1.1. Civil
- 11.1.2. Military
- 11.2. Market Analysis, Insights and Forecast - by Types
- 11.2.1. Paragliding
- 11.2.2. Paramotors
- 11.2.3. Gyroplanes
- 11.2.4. Other
- 11.1. Market Analysis, Insights and Forecast - by Application
- 12. Competitive Analysis
- 12.1. Company Profiles
- 12.1.1 BlackHawk paramotor
- 12.1.1.1. Company Overview
- 12.1.1.2. Products
- 12.1.1.3. Company Financials
- 12.1.1.4. SWOT Analysis
- 12.1.2 Fresh Breeze
- 12.1.2.1. Company Overview
- 12.1.2.2. Products
- 12.1.2.3. Company Financials
- 12.1.2.4. SWOT Analysis
- 12.1.3 Nirvana Paramotor
- 12.1.3.1. Company Overview
- 12.1.3.2. Products
- 12.1.3.3. Company Financials
- 12.1.3.4. SWOT Analysis
- 12.1.4 Fly Products
- 12.1.4.1. Company Overview
- 12.1.4.2. Products
- 12.1.4.3. Company Financials
- 12.1.4.4. SWOT Analysis
- 12.1.5 PAP Paramotors
- 12.1.5.1. Company Overview
- 12.1.5.2. Products
- 12.1.5.3. Company Financials
- 12.1.5.4. SWOT Analysis
- 12.1.6 Parajet Paramotors
- 12.1.6.1. Company Overview
- 12.1.6.2. Products
- 12.1.6.3. Company Financials
- 12.1.6.4. SWOT Analysis
- 12.1.7 AutoGyro
- 12.1.7.1. Company Overview
- 12.1.7.2. Products
- 12.1.7.3. Company Financials
- 12.1.7.4. SWOT Analysis
- 12.1.8 Magni Gyro
- 12.1.8.1. Company Overview
- 12.1.8.2. Products
- 12.1.8.3. Company Financials
- 12.1.8.4. SWOT Analysis
- 12.1.9 ELA Aviation
- 12.1.9.1. Company Overview
- 12.1.9.2. Products
- 12.1.9.3. Company Financials
- 12.1.9.4. SWOT Analysis
- 12.1.10 Sun Hawk Aviation
- 12.1.10.1. Company Overview
- 12.1.10.2. Products
- 12.1.10.3. Company Financials
- 12.1.10.4. SWOT Analysis
- 12.1.11 Xiangchen Tongfei
- 12.1.11.1. Company Overview
- 12.1.11.2. Products
- 12.1.11.3. Company Financials
- 12.1.11.4. SWOT Analysis
- 12.1.12 JSTOL
- 12.1.12.1. Company Overview
- 12.1.12.2. Products
- 12.1.12.3. Company Financials
- 12.1.12.4. SWOT Analysis
- 12.1.13 Macfly Paramotor
- 12.1.13.1. Company Overview
- 12.1.13.2. Products
- 12.1.13.3. Company Financials
- 12.1.13.4. SWOT Analysis
- 12.1.14 Trixy Aviation Products
- 12.1.14.1. Company Overview
- 12.1.14.2. Products
- 12.1.14.3. Company Financials
- 12.1.14.4. SWOT Analysis
- 12.1.15 Aviomania Aircraft
- 12.1.15.1. Company Overview
- 12.1.15.2. Products
- 12.1.15.3. Company Financials
- 12.1.15.4. SWOT Analysis
- 12.1.16 Rotorvox
- 12.1.16.1. Company Overview
- 12.1.16.2. Products
- 12.1.16.3. Company Financials
- 12.1.16.4. SWOT Analysis
- 12.1.17 Niki Rotor Aviation
- 12.1.17.1. Company Overview
- 12.1.17.2. Products
- 12.1.17.3. Company Financials
- 12.1.17.4. SWOT Analysis
- 12.1.18 U-Turn GmbH
- 12.1.18.1. Company Overview
- 12.1.18.2. Products
- 12.1.18.3. Company Financials
- 12.1.18.4. SWOT Analysis
- 12.1.19 Sonex Aircraft
- 12.1.19.1. Company Overview
- 12.1.19.2. Products
- 12.1.19.3. Company Financials
- 12.1.19.4. SWOT Analysis
- 12.1.20 Skywalk GmbH
- 12.1.20.1. Company Overview
- 12.1.20.2. Products
- 12.1.20.3. Company Financials
- 12.1.20.4. SWOT Analysis
- 12.1.1 BlackHawk paramotor
- 12.2. Market Entropy
- 12.2.1 Company's Key Areas Served
- 12.2.2 Recent Developments
- 12.3. Company Market Share Analysis 2025
- 12.3.1 Top 5 Companies Market Share Analysis
- 12.3.2 Top 3 Companies Market Share Analysis
- 12.4. List of Potential Customers
- 13. Research Methodology
List of Figures
- Figure 1: Global Ultralight Aviation Revenue Breakdown (billion, %) by Region 2025 & 2033
- Figure 2: Global Ultralight Aviation Volume Breakdown (K, %) by Region 2025 & 2033
- Figure 3: North America Ultralight Aviation Revenue (billion), by Application 2025 & 2033
- Figure 4: North America Ultralight Aviation Volume (K), by Application 2025 & 2033
- Figure 5: North America Ultralight Aviation Revenue Share (%), by Application 2025 & 2033
- Figure 6: North America Ultralight Aviation Volume Share (%), by Application 2025 & 2033
- Figure 7: North America Ultralight Aviation Revenue (billion), by Types 2025 & 2033
- Figure 8: North America Ultralight Aviation Volume (K), by Types 2025 & 2033
- Figure 9: North America Ultralight Aviation Revenue Share (%), by Types 2025 & 2033
- Figure 10: North America Ultralight Aviation Volume Share (%), by Types 2025 & 2033
- Figure 11: North America Ultralight Aviation Revenue (billion), by Country 2025 & 2033
- Figure 12: North America Ultralight Aviation Volume (K), by Country 2025 & 2033
- Figure 13: North America Ultralight Aviation Revenue Share (%), by Country 2025 & 2033
- Figure 14: North America Ultralight Aviation Volume Share (%), by Country 2025 & 2033
- Figure 15: South America Ultralight Aviation Revenue (billion), by Application 2025 & 2033
- Figure 16: South America Ultralight Aviation Volume (K), by Application 2025 & 2033
- Figure 17: South America Ultralight Aviation Revenue Share (%), by Application 2025 & 2033
- Figure 18: South America Ultralight Aviation Volume Share (%), by Application 2025 & 2033
- Figure 19: South America Ultralight Aviation Revenue (billion), by Types 2025 & 2033
- Figure 20: South America Ultralight Aviation Volume (K), by Types 2025 & 2033
- Figure 21: South America Ultralight Aviation Revenue Share (%), by Types 2025 & 2033
- Figure 22: South America Ultralight Aviation Volume Share (%), by Types 2025 & 2033
- Figure 23: South America Ultralight Aviation Revenue (billion), by Country 2025 & 2033
- Figure 24: South America Ultralight Aviation Volume (K), by Country 2025 & 2033
- Figure 25: South America Ultralight Aviation Revenue Share (%), by Country 2025 & 2033
- Figure 26: South America Ultralight Aviation Volume Share (%), by Country 2025 & 2033
- Figure 27: Europe Ultralight Aviation Revenue (billion), by Application 2025 & 2033
- Figure 28: Europe Ultralight Aviation Volume (K), by Application 2025 & 2033
- Figure 29: Europe Ultralight Aviation Revenue Share (%), by Application 2025 & 2033
- Figure 30: Europe Ultralight Aviation Volume Share (%), by Application 2025 & 2033
- Figure 31: Europe Ultralight Aviation Revenue (billion), by Types 2025 & 2033
- Figure 32: Europe Ultralight Aviation Volume (K), by Types 2025 & 2033
- Figure 33: Europe Ultralight Aviation Revenue Share (%), by Types 2025 & 2033
- Figure 34: Europe Ultralight Aviation Volume Share (%), by Types 2025 & 2033
- Figure 35: Europe Ultralight Aviation Revenue (billion), by Country 2025 & 2033
- Figure 36: Europe Ultralight Aviation Volume (K), by Country 2025 & 2033
- Figure 37: Europe Ultralight Aviation Revenue Share (%), by Country 2025 & 2033
- Figure 38: Europe Ultralight Aviation Volume Share (%), by Country 2025 & 2033
- Figure 39: Middle East & Africa Ultralight Aviation Revenue (billion), by Application 2025 & 2033
- Figure 40: Middle East & Africa Ultralight Aviation Volume (K), by Application 2025 & 2033
- Figure 41: Middle East & Africa Ultralight Aviation Revenue Share (%), by Application 2025 & 2033
- Figure 42: Middle East & Africa Ultralight Aviation Volume Share (%), by Application 2025 & 2033
- Figure 43: Middle East & Africa Ultralight Aviation Revenue (billion), by Types 2025 & 2033
- Figure 44: Middle East & Africa Ultralight Aviation Volume (K), by Types 2025 & 2033
- Figure 45: Middle East & Africa Ultralight Aviation Revenue Share (%), by Types 2025 & 2033
- Figure 46: Middle East & Africa Ultralight Aviation Volume Share (%), by Types 2025 & 2033
- Figure 47: Middle East & Africa Ultralight Aviation Revenue (billion), by Country 2025 & 2033
- Figure 48: Middle East & Africa Ultralight Aviation Volume (K), by Country 2025 & 2033
- Figure 49: Middle East & Africa Ultralight Aviation Revenue Share (%), by Country 2025 & 2033
- Figure 50: Middle East & Africa Ultralight Aviation Volume Share (%), by Country 2025 & 2033
- Figure 51: Asia Pacific Ultralight Aviation Revenue (billion), by Application 2025 & 2033
- Figure 52: Asia Pacific Ultralight Aviation Volume (K), by Application 2025 & 2033
- Figure 53: Asia Pacific Ultralight Aviation Revenue Share (%), by Application 2025 & 2033
- Figure 54: Asia Pacific Ultralight Aviation Volume Share (%), by Application 2025 & 2033
- Figure 55: Asia Pacific Ultralight Aviation Revenue (billion), by Types 2025 & 2033
- Figure 56: Asia Pacific Ultralight Aviation Volume (K), by Types 2025 & 2033
- Figure 57: Asia Pacific Ultralight Aviation Revenue Share (%), by Types 2025 & 2033
- Figure 58: Asia Pacific Ultralight Aviation Volume Share (%), by Types 2025 & 2033
- Figure 59: Asia Pacific Ultralight Aviation Revenue (billion), by Country 2025 & 2033
- Figure 60: Asia Pacific Ultralight Aviation Volume (K), by Country 2025 & 2033
- Figure 61: Asia Pacific Ultralight Aviation Revenue Share (%), by Country 2025 & 2033
- Figure 62: Asia Pacific Ultralight Aviation Volume Share (%), by Country 2025 & 2033
List of Tables
- Table 1: Global Ultralight Aviation Revenue billion Forecast, by Application 2020 & 2033
- Table 2: Global Ultralight Aviation Volume K Forecast, by Application 2020 & 2033
- Table 3: Global Ultralight Aviation Revenue billion Forecast, by Types 2020 & 2033
- Table 4: Global Ultralight Aviation Volume K Forecast, by Types 2020 & 2033
- Table 5: Global Ultralight Aviation Revenue billion Forecast, by Region 2020 & 2033
- Table 6: Global Ultralight Aviation Volume K Forecast, by Region 2020 & 2033
- Table 7: Global Ultralight Aviation Revenue billion Forecast, by Application 2020 & 2033
- Table 8: Global Ultralight Aviation Volume K Forecast, by Application 2020 & 2033
- Table 9: Global Ultralight Aviation Revenue billion Forecast, by Types 2020 & 2033
- Table 10: Global Ultralight Aviation Volume K Forecast, by Types 2020 & 2033
- Table 11: Global Ultralight Aviation Revenue billion Forecast, by Country 2020 & 2033
- Table 12: Global Ultralight Aviation Volume K Forecast, by Country 2020 & 2033
- Table 13: United States Ultralight Aviation Revenue (billion) Forecast, by Application 2020 & 2033
- Table 14: United States Ultralight Aviation Volume (K) Forecast, by Application 2020 & 2033
- Table 15: Canada Ultralight Aviation Revenue (billion) Forecast, by Application 2020 & 2033
- Table 16: Canada Ultralight Aviation Volume (K) Forecast, by Application 2020 & 2033
- Table 17: Mexico Ultralight Aviation Revenue (billion) Forecast, by Application 2020 & 2033
- Table 18: Mexico Ultralight Aviation Volume (K) Forecast, by Application 2020 & 2033
- Table 19: Global Ultralight Aviation Revenue billion Forecast, by Application 2020 & 2033
- Table 20: Global Ultralight Aviation Volume K Forecast, by Application 2020 & 2033
- Table 21: Global Ultralight Aviation Revenue billion Forecast, by Types 2020 & 2033
- Table 22: Global Ultralight Aviation Volume K Forecast, by Types 2020 & 2033
- Table 23: Global Ultralight Aviation Revenue billion Forecast, by Country 2020 & 2033
- Table 24: Global Ultralight Aviation Volume K Forecast, by Country 2020 & 2033
- Table 25: Brazil Ultralight Aviation Revenue (billion) Forecast, by Application 2020 & 2033
- Table 26: Brazil Ultralight Aviation Volume (K) Forecast, by Application 2020 & 2033
- Table 27: Argentina Ultralight Aviation Revenue (billion) Forecast, by Application 2020 & 2033
- Table 28: Argentina Ultralight Aviation Volume (K) Forecast, by Application 2020 & 2033
- Table 29: Rest of South America Ultralight Aviation Revenue (billion) Forecast, by Application 2020 & 2033
- Table 30: Rest of South America Ultralight Aviation Volume (K) Forecast, by Application 2020 & 2033
- Table 31: Global Ultralight Aviation Revenue billion Forecast, by Application 2020 & 2033
- Table 32: Global Ultralight Aviation Volume K Forecast, by Application 2020 & 2033
- Table 33: Global Ultralight Aviation Revenue billion Forecast, by Types 2020 & 2033
- Table 34: Global Ultralight Aviation Volume K Forecast, by Types 2020 & 2033
- Table 35: Global Ultralight Aviation Revenue billion Forecast, by Country 2020 & 2033
- Table 36: Global Ultralight Aviation Volume K Forecast, by Country 2020 & 2033
- Table 37: United Kingdom Ultralight Aviation Revenue (billion) Forecast, by Application 2020 & 2033
- Table 38: United Kingdom Ultralight Aviation Volume (K) Forecast, by Application 2020 & 2033
- Table 39: Germany Ultralight Aviation Revenue (billion) Forecast, by Application 2020 & 2033
- Table 40: Germany Ultralight Aviation Volume (K) Forecast, by Application 2020 & 2033
- Table 41: France Ultralight Aviation Revenue (billion) Forecast, by Application 2020 & 2033
- Table 42: France Ultralight Aviation Volume (K) Forecast, by Application 2020 & 2033
- Table 43: Italy Ultralight Aviation Revenue (billion) Forecast, by Application 2020 & 2033
- Table 44: Italy Ultralight Aviation Volume (K) Forecast, by Application 2020 & 2033
- Table 45: Spain Ultralight Aviation Revenue (billion) Forecast, by Application 2020 & 2033
- Table 46: Spain Ultralight Aviation Volume (K) Forecast, by Application 2020 & 2033
- Table 47: Russia Ultralight Aviation Revenue (billion) Forecast, by Application 2020 & 2033
- Table 48: Russia Ultralight Aviation Volume (K) Forecast, by Application 2020 & 2033
- Table 49: Benelux Ultralight Aviation Revenue (billion) Forecast, by Application 2020 & 2033
- Table 50: Benelux Ultralight Aviation Volume (K) Forecast, by Application 2020 & 2033
- Table 51: Nordics Ultralight Aviation Revenue (billion) Forecast, by Application 2020 & 2033
- Table 52: Nordics Ultralight Aviation Volume (K) Forecast, by Application 2020 & 2033
- Table 53: Rest of Europe Ultralight Aviation Revenue (billion) Forecast, by Application 2020 & 2033
- Table 54: Rest of Europe Ultralight Aviation Volume (K) Forecast, by Application 2020 & 2033
- Table 55: Global Ultralight Aviation Revenue billion Forecast, by Application 2020 & 2033
- Table 56: Global Ultralight Aviation Volume K Forecast, by Application 2020 & 2033
- Table 57: Global Ultralight Aviation Revenue billion Forecast, by Types 2020 & 2033
- Table 58: Global Ultralight Aviation Volume K Forecast, by Types 2020 & 2033
- Table 59: Global Ultralight Aviation Revenue billion Forecast, by Country 2020 & 2033
- Table 60: Global Ultralight Aviation Volume K Forecast, by Country 2020 & 2033
- Table 61: Turkey Ultralight Aviation Revenue (billion) Forecast, by Application 2020 & 2033
- Table 62: Turkey Ultralight Aviation Volume (K) Forecast, by Application 2020 & 2033
- Table 63: Israel Ultralight Aviation Revenue (billion) Forecast, by Application 2020 & 2033
- Table 64: Israel Ultralight Aviation Volume (K) Forecast, by Application 2020 & 2033
- Table 65: GCC Ultralight Aviation Revenue (billion) Forecast, by Application 2020 & 2033
- Table 66: GCC Ultralight Aviation Volume (K) Forecast, by Application 2020 & 2033
- Table 67: North Africa Ultralight Aviation Revenue (billion) Forecast, by Application 2020 & 2033
- Table 68: North Africa Ultralight Aviation Volume (K) Forecast, by Application 2020 & 2033
- Table 69: South Africa Ultralight Aviation Revenue (billion) Forecast, by Application 2020 & 2033
- Table 70: South Africa Ultralight Aviation Volume (K) Forecast, by Application 2020 & 2033
- Table 71: Rest of Middle East & Africa Ultralight Aviation Revenue (billion) Forecast, by Application 2020 & 2033
- Table 72: Rest of Middle East & Africa Ultralight Aviation Volume (K) Forecast, by Application 2020 & 2033
- Table 73: Global Ultralight Aviation Revenue billion Forecast, by Application 2020 & 2033
- Table 74: Global Ultralight Aviation Volume K Forecast, by Application 2020 & 2033
- Table 75: Global Ultralight Aviation Revenue billion Forecast, by Types 2020 & 2033
- Table 76: Global Ultralight Aviation Volume K Forecast, by Types 2020 & 2033
- Table 77: Global Ultralight Aviation Revenue billion Forecast, by Country 2020 & 2033
- Table 78: Global Ultralight Aviation Volume K Forecast, by Country 2020 & 2033
- Table 79: China Ultralight Aviation Revenue (billion) Forecast, by Application 2020 & 2033
- Table 80: China Ultralight Aviation Volume (K) Forecast, by Application 2020 & 2033
- Table 81: India Ultralight Aviation Revenue (billion) Forecast, by Application 2020 & 2033
- Table 82: India Ultralight Aviation Volume (K) Forecast, by Application 2020 & 2033
- Table 83: Japan Ultralight Aviation Revenue (billion) Forecast, by Application 2020 & 2033
- Table 84: Japan Ultralight Aviation Volume (K) Forecast, by Application 2020 & 2033
- Table 85: South Korea Ultralight Aviation Revenue (billion) Forecast, by Application 2020 & 2033
- Table 86: South Korea Ultralight Aviation Volume (K) Forecast, by Application 2020 & 2033
- Table 87: ASEAN Ultralight Aviation Revenue (billion) Forecast, by Application 2020 & 2033
- Table 88: ASEAN Ultralight Aviation Volume (K) Forecast, by Application 2020 & 2033
- Table 89: Oceania Ultralight Aviation Revenue (billion) Forecast, by Application 2020 & 2033
- Table 90: Oceania Ultralight Aviation Volume (K) Forecast, by Application 2020 & 2033
- Table 91: Rest of Asia Pacific Ultralight Aviation Revenue (billion) Forecast, by Application 2020 & 2033
- Table 92: Rest of Asia Pacific Ultralight Aviation Volume (K) Forecast, by Application 2020 & 2033
Frequently Asked Questions
1. What is the projected Compound Annual Growth Rate (CAGR) of the Ultralight Aviation?
The projected CAGR is approximately 7.6%.
2. Which companies are prominent players in the Ultralight Aviation?
Key companies in the market include BlackHawk paramotor, Fresh Breeze, Nirvana Paramotor, Fly Products, PAP Paramotors, Parajet Paramotors, AutoGyro, Magni Gyro, ELA Aviation, Sun Hawk Aviation, Xiangchen Tongfei, JSTOL, Macfly Paramotor, Trixy Aviation Products, Aviomania Aircraft, Rotorvox, Niki Rotor Aviation, U-Turn GmbH, Sonex Aircraft, Skywalk GmbH.
3. What are the main segments of the Ultralight Aviation?
The market segments include Application, Types.
4. Can you provide details about the market size?
The market size is estimated to be USD 16.3 billion as of 2022.
5. What are some drivers contributing to market growth?
N/A
6. What are the notable trends driving market growth?
N/A
7. Are there any restraints impacting market growth?
N/A
8. Can you provide examples of recent developments in the market?
N/A
9. What pricing options are available for accessing the report?
Pricing options include single-user, multi-user, and enterprise licenses priced at USD 3350.00, USD 5025.00, and USD 6700.00 respectively.
10. Is the market size provided in terms of value or volume?
The market size is provided in terms of value, measured in billion and volume, measured in K.
11. Are there any specific market keywords associated with the report?
Yes, the market keyword associated with the report is "Ultralight Aviation," which aids in identifying and referencing the specific market segment covered.
12. How do I determine which pricing option suits my needs best?
The pricing options vary based on user requirements and access needs. Individual users may opt for single-user licenses, while businesses requiring broader access may choose multi-user or enterprise licenses for cost-effective access to the report.
13. Are there any additional resources or data provided in the Ultralight Aviation report?
While the report offers comprehensive insights, it's advisable to review the specific contents or supplementary materials provided to ascertain if additional resources or data are available.
14. How can I stay updated on further developments or reports in the Ultralight Aviation?
To stay informed about further developments, trends, and reports in the Ultralight Aviation, consider subscribing to industry newsletters, following relevant companies and organizations, or regularly checking reputable industry news sources and publications.
Methodology
Step 1 - Identification of Relevant Samples Size from Population Database


Step 2 - Approaches for Defining Global Market Size (Value, Volume* & Price*)

Note*: In applicable scenarios
Step 3 - Data Sources
Primary Research
- Web Analytics
- Survey Reports
- Research Institute
- Latest Research Reports
- Opinion Leaders
Secondary Research
- Annual Reports
- White Paper
- Latest Press Release
- Industry Association
- Paid Database
- Investor Presentations

Step 4 - Data Triangulation
Involves using different sources of information in order to increase the validity of a study
These sources are likely to be stakeholders in a program - participants, other researchers, program staff, other community members, and so on.
Then we put all data in single framework & apply various statistical tools to find out the dynamic on the market.
During the analysis stage, feedback from the stakeholder groups would be compared to determine areas of agreement as well as areas of divergence