

Key Insights
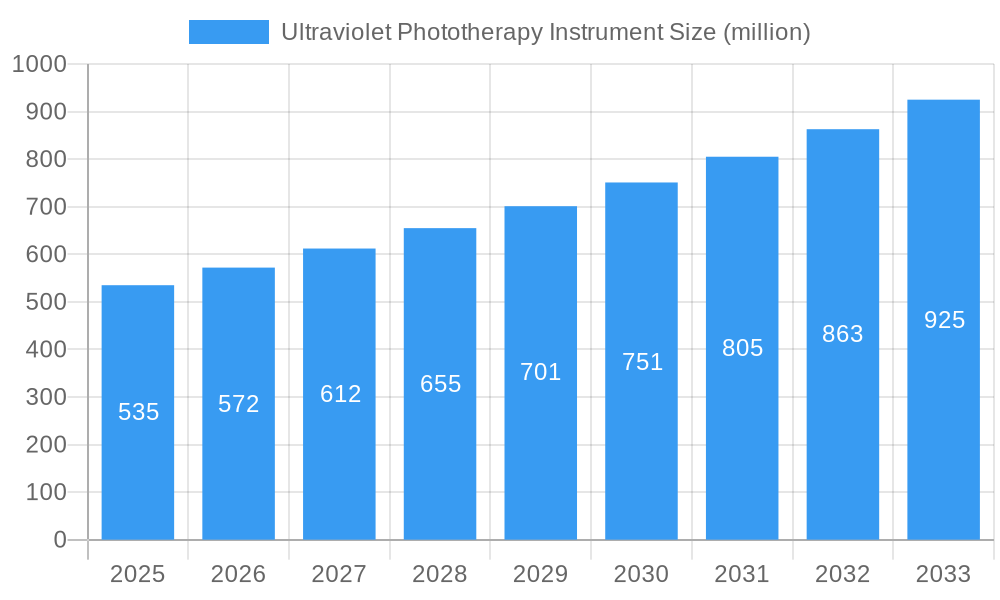
The ultraviolet (UV) phototherapy instrument market is poised for significant expansion, fueled by the rising incidence of dermatological conditions such as psoriasis, vitiligo, and eczema, alongside a growing preference for non-invasive treatment modalities. Advancements in technology, resulting in more efficient, portable, and patient-friendly devices with shorter treatment durations, are key growth drivers. Based on a projected Compound Annual Growth Rate (CAGR) of 6% and an estimated market size of $558 million in the base year 2025, the UV phototherapy instrument market is expected to reach substantial figures in the forecast period.
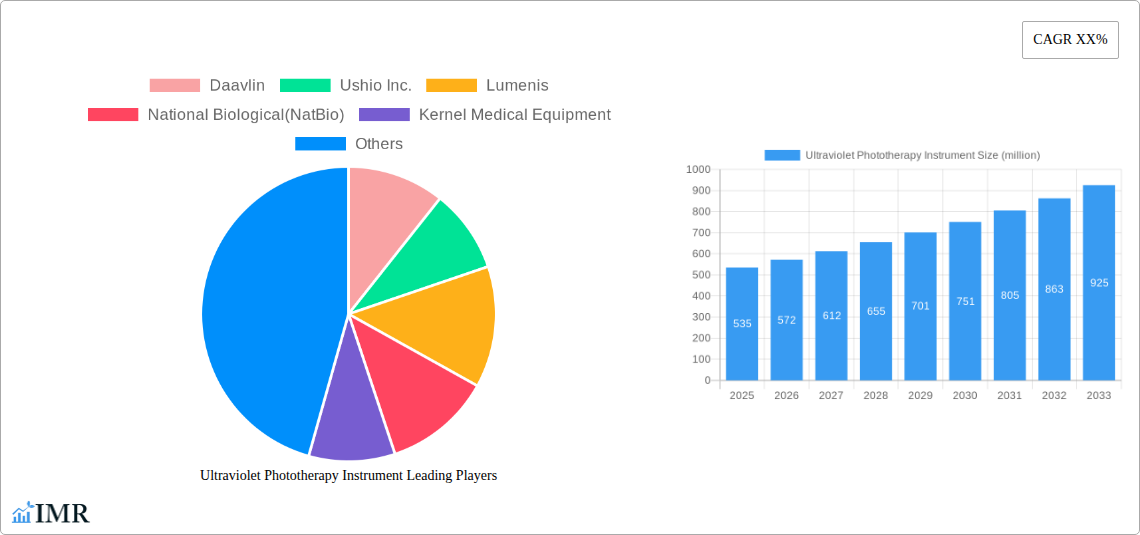
Ultraviolet Phototherapy Instrument Market Size (In Million)
Key industry participants, including Daavlin, Ushio Inc., and Lumenis, are actively investing in research and development and expanding their product offerings to leverage this market momentum. Despite potential challenges such as high initial investment, possible side effects of UV therapy, and the requirement for trained personnel, the market is anticipated to grow. The segment for handheld and portable devices is expected to experience particularly strong growth due to their convenience and cost-effectiveness.
Ultraviolet Phototherapy Instrument Company Market Share
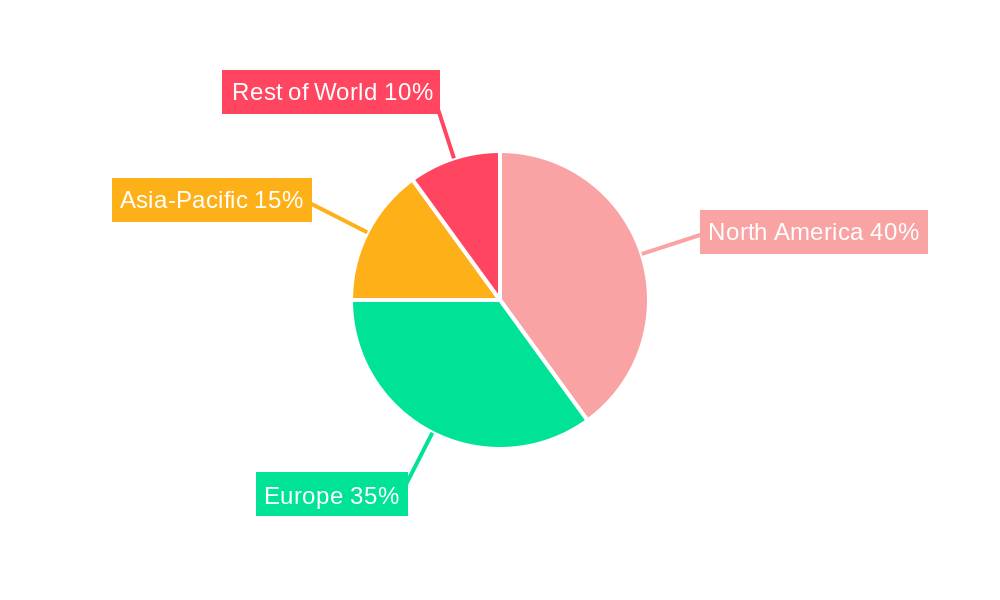
The forecast period, covering 2025 through 2033, indicates sustained market growth, driven by increased awareness of UV phototherapy's therapeutic benefits and a growing elderly population prone to skin ailments. Market dynamics will vary regionally, influenced by healthcare infrastructure, regulatory frameworks, and reimbursement policies. North America and Europe are expected to retain dominant market positions, with the Asia-Pacific region presenting considerable growth opportunities. Strategic collaborations, mergers, acquisitions, and the introduction of novel UV phototherapy solutions will define the competitive landscape. The ongoing emphasis on enhancing device safety, efficacy, and user-friendliness will further accelerate market penetration.
Ultraviolet Phototherapy Instrument Market Report: 2019-2033
This comprehensive report provides a detailed analysis of the Ultraviolet Phototherapy Instrument market, encompassing market dynamics, growth trends, regional segmentation, product landscape, key players, and future outlook. The study period covers 2019-2033, with 2025 as the base and estimated year. The forecast period spans 2025-2033, and the historical period covers 2019-2024. This report is crucial for industry professionals, investors, and researchers seeking a deep understanding of this dynamic market. The market is segmented by application (e.g., dermatology, psoriasis treatment) and device type (narrowband UVB, broad-band UVB, etc.).
Parent Market: Medical Devices Market (Projected size in 2025: $XX Billion) Child Market: Dermatology Equipment Market (Projected size in 2025: $XX Billion)
Ultraviolet Phototherapy Instrument Market Dynamics & Structure
The ultraviolet phototherapy instrument market is characterized by moderate concentration, with key players holding significant market share. Technological innovation, primarily in terms of enhanced efficacy, safety features, and ease of use, drives market growth. Regulatory frameworks, varying across regions, influence market access and product approvals. Competitive substitutes, such as topical medications, influence market penetration. End-user demographics, especially the prevalence of skin disorders, heavily influence demand. M&A activity has been moderate, with a few strategic acquisitions aimed at expanding product portfolios and geographical reach.
- Market Concentration: Moderately concentrated, with the top 5 players holding approximately XX% market share in 2025.
- Technological Innovation: Focus on narrowband UVB and excimer laser technologies, leading to improved treatment efficacy and reduced side effects.
- Regulatory Frameworks: Varying approval processes across regions influence market entry and growth. Compliance costs impact profitability.
- Competitive Substitutes: Topical treatments and other therapies compete with UV phototherapy, affecting market penetration.
- End-User Demographics: Growing prevalence of skin disorders like psoriasis and vitiligo drives market expansion. Aging population contributes to increased demand.
- M&A Trends: Approximately XX M&A deals related to UV phototherapy instruments were recorded between 2019 and 2024.
Ultraviolet Phototherapy Instrument Growth Trends & Insights
The global ultraviolet phototherapy instrument market experienced steady growth during the historical period (2019-2024), primarily driven by increasing awareness of skin disorders and technological advancements. The market size is projected to reach $XX billion in 2025, exhibiting a CAGR of XX% during the forecast period (2025-2033). This growth is fueled by rising adoption rates in both developed and developing economies, coupled with the introduction of innovative devices with enhanced features. Technological disruptions, such as the integration of AI and telehealth, are poised to further enhance market expansion. Consumer behavior shifts towards personalized medicine and at-home treatment options also influence market dynamics. The market penetration rate is expected to reach XX% by 2033.
Dominant Regions, Countries, or Segments in Ultraviolet Phototherapy Instrument
North America currently dominates the ultraviolet phototherapy instrument market, holding the largest market share in 2025, followed by Europe. This dominance stems from factors including high healthcare expenditure, advanced healthcare infrastructure, and high prevalence of skin conditions. However, rapidly growing economies in Asia-Pacific, particularly China and India, show considerable potential for future growth driven by increasing disposable incomes, improved healthcare access, and rising awareness of skin disorders.
- North America: High adoption rates due to advanced healthcare infrastructure and high prevalence of skin diseases. Strong regulatory frameworks and high healthcare expenditure contribute to market growth.
- Europe: Significant market share driven by increasing prevalence of skin disorders and growing awareness of phototherapy benefits. Stringent regulatory requirements influence market development.
- Asia-Pacific: Rapidly growing market fueled by rising disposable incomes, improved healthcare access, and increasing awareness of skin conditions. Government initiatives promoting healthcare infrastructure development further boost market growth.
Ultraviolet Phototherapy Instrument Product Landscape
The ultraviolet phototherapy instrument market offers a diverse range of products, including narrowband UVB, broadband UVB, and excimer laser systems. These devices vary in terms of wavelength, power output, treatment area, and features such as automated dosage control and patient safety mechanisms. Recent innovations focus on improving treatment efficacy, minimizing side effects, and enhancing user-friendliness, including compact and portable devices for home-based treatments. Key selling propositions include efficacy, safety, ease of use, and cost-effectiveness.
Key Drivers, Barriers & Challenges in Ultraviolet Phototherapy Instrument
Key Drivers:
- Rising prevalence of skin disorders like psoriasis and vitiligo.
- Technological advancements leading to improved efficacy and safety.
- Increasing healthcare expenditure and insurance coverage.
Challenges & Restraints:
- High initial investment costs for advanced systems.
- Potential side effects and risks associated with UV exposure.
- Stringent regulatory requirements and approval processes. (e.g., estimated XX million USD in regulatory compliance costs annually).
Emerging Opportunities in Ultraviolet Phototherapy Instrument
Emerging opportunities include the expansion of home-based treatment options, fueled by increasing consumer demand for convenience. Integration of teledermatology with UV phototherapy devices offers potential for remote patient monitoring and improved access to treatment. Furthermore, research and development into novel UV sources and treatment protocols create opportunities for innovative products and applications.
Growth Accelerators in the Ultraviolet Phototherapy Instrument Industry
Long-term growth will be driven by strategic partnerships between device manufacturers and healthcare providers, enhancing market access and adoption. Furthermore, technological breakthroughs, such as the development of more targeted and efficient UV therapies, will continue to propel market expansion. Expansion into untapped markets in developing economies will also contribute to long-term growth.
Key Players Shaping the Ultraviolet Phototherapy Instrument Market
- Daavlin
- Ushio Inc.
- Lumenis
- National Biological (NatBio)
- Kernel Medical Equipment
- Alma Lasers
- Dr. Hönle Medizintechnik
- Yonker Medical
- Zerigo Health
Notable Milestones in Ultraviolet Phototherapy Instrument Sector
- 2020: FDA approval of a new narrowband UVB phototherapy device with enhanced safety features.
- 2022: Launch of a portable excimer laser system for home use.
- 2023: Strategic partnership between a major device manufacturer and a large dermatology clinic network.
In-Depth Ultraviolet Phototherapy Instrument Market Outlook
The future of the ultraviolet phototherapy instrument market is promising, driven by sustained technological innovation, increasing healthcare expenditure, and expanding awareness of skin disorders. Strategic opportunities lie in developing cost-effective, user-friendly devices, focusing on personalized treatment approaches, and expanding market penetration in developing economies. The market is projected to witness robust growth over the forecast period, driven by these factors and further fueled by increasing patient preference for non-invasive treatment options.
Ultraviolet Phototherapy Instrument Segmentation
-
1. Application
- 1.1. Hospital
- 1.2. Home
-
2. Types
- 2.1. Hand Held
- 2.2. Desktop
Ultraviolet Phototherapy Instrument Segmentation By Geography
-
1. North America
- 1.1. United States
- 1.2. Canada
- 1.3. Mexico
-
2. South America
- 2.1. Brazil
- 2.2. Argentina
- 2.3. Rest of South America
-
3. Europe
- 3.1. United Kingdom
- 3.2. Germany
- 3.3. France
- 3.4. Italy
- 3.5. Spain
- 3.6. Russia
- 3.7. Benelux
- 3.8. Nordics
- 3.9. Rest of Europe
-
4. Middle East & Africa
- 4.1. Turkey
- 4.2. Israel
- 4.3. GCC
- 4.4. North Africa
- 4.5. South Africa
- 4.6. Rest of Middle East & Africa
-
5. Asia Pacific
- 5.1. China
- 5.2. India
- 5.3. Japan
- 5.4. South Korea
- 5.5. ASEAN
- 5.6. Oceania
- 5.7. Rest of Asia Pacific
Ultraviolet Phototherapy Instrument Regional Market Share
Geographic Coverage of Ultraviolet Phototherapy Instrument
Ultraviolet Phototherapy Instrument REPORT HIGHLIGHTS
| Aspects | Details |
|---|---|
| Study Period | 2020-2034 |
| Base Year | 2025 |
| Estimated Year | 2026 |
| Forecast Period | 2026-2034 |
| Historical Period | 2020-2025 |
| Growth Rate | CAGR of 6% from 2020-2034 |
| Segmentation |
|
Table of Contents
- 1. Introduction
- 1.1. Research Scope
- 1.2. Market Segmentation
- 1.3. Research Objective
- 1.4. Definitions and Assumptions
- 2. Executive Summary
- 2.1. Market Snapshot
- 3. Market Dynamics
- 3.1. Market Drivers
- 3.2. Market Restrains
- 3.3. Market Trends
- 3.4. Market Opportunities
- 4. Market Factor Analysis
- 4.1. Porters Five Forces
- 4.1.1. Bargaining Power of Suppliers
- 4.1.2. Bargaining Power of Buyers
- 4.1.3. Threat of New Entrants
- 4.1.4. Threat of Substitutes
- 4.1.5. Competitive Rivalry
- 4.2. PESTEL analysis
- 4.3. BCG Analysis
- 4.3.1. Stars (High Growth, High Market Share)
- 4.3.2. Cash Cows (Low Growth, High Market Share)
- 4.3.3. Question Mark (High Growth, Low Market Share)
- 4.3.4. Dogs (Low Growth, Low Market Share)
- 4.4. Ansoff Matrix Analysis
- 4.5. Supply Chain Analysis
- 4.6. Regulatory Landscape
- 4.7. Current Market Potential and Opportunity Assessment (TAM–SAM–SOM Framework)
- 4.8. IMR Analyst Note
- 4.1. Porters Five Forces
- 5. Market Analysis, Insights and Forecast 2021-2033
- 5.1. Market Analysis, Insights and Forecast - by Application
- 5.1.1. Hospital
- 5.1.2. Home
- 5.2. Market Analysis, Insights and Forecast - by Types
- 5.2.1. Hand Held
- 5.2.2. Desktop
- 5.3. Market Analysis, Insights and Forecast - by Region
- 5.3.1. North America
- 5.3.2. South America
- 5.3.3. Europe
- 5.3.4. Middle East & Africa
- 5.3.5. Asia Pacific
- 5.1. Market Analysis, Insights and Forecast - by Application
- 6. Global Ultraviolet Phototherapy Instrument Analysis, Insights and Forecast, 2021-2033
- 6.1. Market Analysis, Insights and Forecast - by Application
- 6.1.1. Hospital
- 6.1.2. Home
- 6.2. Market Analysis, Insights and Forecast - by Types
- 6.2.1. Hand Held
- 6.2.2. Desktop
- 6.1. Market Analysis, Insights and Forecast - by Application
- 7. North America Ultraviolet Phototherapy Instrument Analysis, Insights and Forecast, 2020-2032
- 7.1. Market Analysis, Insights and Forecast - by Application
- 7.1.1. Hospital
- 7.1.2. Home
- 7.2. Market Analysis, Insights and Forecast - by Types
- 7.2.1. Hand Held
- 7.2.2. Desktop
- 7.1. Market Analysis, Insights and Forecast - by Application
- 8. South America Ultraviolet Phototherapy Instrument Analysis, Insights and Forecast, 2020-2032
- 8.1. Market Analysis, Insights and Forecast - by Application
- 8.1.1. Hospital
- 8.1.2. Home
- 8.2. Market Analysis, Insights and Forecast - by Types
- 8.2.1. Hand Held
- 8.2.2. Desktop
- 8.1. Market Analysis, Insights and Forecast - by Application
- 9. Europe Ultraviolet Phototherapy Instrument Analysis, Insights and Forecast, 2020-2032
- 9.1. Market Analysis, Insights and Forecast - by Application
- 9.1.1. Hospital
- 9.1.2. Home
- 9.2. Market Analysis, Insights and Forecast - by Types
- 9.2.1. Hand Held
- 9.2.2. Desktop
- 9.1. Market Analysis, Insights and Forecast - by Application
- 10. Middle East & Africa Ultraviolet Phototherapy Instrument Analysis, Insights and Forecast, 2020-2032
- 10.1. Market Analysis, Insights and Forecast - by Application
- 10.1.1. Hospital
- 10.1.2. Home
- 10.2. Market Analysis, Insights and Forecast - by Types
- 10.2.1. Hand Held
- 10.2.2. Desktop
- 10.1. Market Analysis, Insights and Forecast - by Application
- 11. Asia Pacific Ultraviolet Phototherapy Instrument Analysis, Insights and Forecast, 2020-2032
- 11.1. Market Analysis, Insights and Forecast - by Application
- 11.1.1. Hospital
- 11.1.2. Home
- 11.2. Market Analysis, Insights and Forecast - by Types
- 11.2.1. Hand Held
- 11.2.2. Desktop
- 11.1. Market Analysis, Insights and Forecast - by Application
- 12. Competitive Analysis
- 12.1. Company Profiles
- 12.1.1 Daavlin
- 12.1.1.1. Company Overview
- 12.1.1.2. Products
- 12.1.1.3. Company Financials
- 12.1.1.4. SWOT Analysis
- 12.1.2 Ushio Inc.
- 12.1.2.1. Company Overview
- 12.1.2.2. Products
- 12.1.2.3. Company Financials
- 12.1.2.4. SWOT Analysis
- 12.1.3 Lumenis
- 12.1.3.1. Company Overview
- 12.1.3.2. Products
- 12.1.3.3. Company Financials
- 12.1.3.4. SWOT Analysis
- 12.1.4 National Biological(NatBio)
- 12.1.4.1. Company Overview
- 12.1.4.2. Products
- 12.1.4.3. Company Financials
- 12.1.4.4. SWOT Analysis
- 12.1.5 Kernel Medical Equipment
- 12.1.5.1. Company Overview
- 12.1.5.2. Products
- 12.1.5.3. Company Financials
- 12.1.5.4. SWOT Analysis
- 12.1.6 Alma Lasers
- 12.1.6.1. Company Overview
- 12.1.6.2. Products
- 12.1.6.3. Company Financials
- 12.1.6.4. SWOT Analysis
- 12.1.7 Dr. Hönle Medizintechnik
- 12.1.7.1. Company Overview
- 12.1.7.2. Products
- 12.1.7.3. Company Financials
- 12.1.7.4. SWOT Analysis
- 12.1.8 Yonker Medical
- 12.1.8.1. Company Overview
- 12.1.8.2. Products
- 12.1.8.3. Company Financials
- 12.1.8.4. SWOT Analysis
- 12.1.9 Zerigo Health
- 12.1.9.1. Company Overview
- 12.1.9.2. Products
- 12.1.9.3. Company Financials
- 12.1.9.4. SWOT Analysis
- 12.1.1 Daavlin
- 12.2. Market Entropy
- 12.2.1 Company's Key Areas Served
- 12.2.2 Recent Developments
- 12.3. Company Market Share Analysis 2025
- 12.3.1 Top 5 Companies Market Share Analysis
- 12.3.2 Top 3 Companies Market Share Analysis
- 12.4. List of Potential Customers
- 13. Research Methodology
List of Figures
- Figure 1: Global Ultraviolet Phototherapy Instrument Revenue Breakdown (million, %) by Region 2025 & 2033
- Figure 2: Global Ultraviolet Phototherapy Instrument Volume Breakdown (K, %) by Region 2025 & 2033
- Figure 3: North America Ultraviolet Phototherapy Instrument Revenue (million), by Application 2025 & 2033
- Figure 4: North America Ultraviolet Phototherapy Instrument Volume (K), by Application 2025 & 2033
- Figure 5: North America Ultraviolet Phototherapy Instrument Revenue Share (%), by Application 2025 & 2033
- Figure 6: North America Ultraviolet Phototherapy Instrument Volume Share (%), by Application 2025 & 2033
- Figure 7: North America Ultraviolet Phototherapy Instrument Revenue (million), by Types 2025 & 2033
- Figure 8: North America Ultraviolet Phototherapy Instrument Volume (K), by Types 2025 & 2033
- Figure 9: North America Ultraviolet Phototherapy Instrument Revenue Share (%), by Types 2025 & 2033
- Figure 10: North America Ultraviolet Phototherapy Instrument Volume Share (%), by Types 2025 & 2033
- Figure 11: North America Ultraviolet Phototherapy Instrument Revenue (million), by Country 2025 & 2033
- Figure 12: North America Ultraviolet Phototherapy Instrument Volume (K), by Country 2025 & 2033
- Figure 13: North America Ultraviolet Phototherapy Instrument Revenue Share (%), by Country 2025 & 2033
- Figure 14: North America Ultraviolet Phototherapy Instrument Volume Share (%), by Country 2025 & 2033
- Figure 15: South America Ultraviolet Phototherapy Instrument Revenue (million), by Application 2025 & 2033
- Figure 16: South America Ultraviolet Phototherapy Instrument Volume (K), by Application 2025 & 2033
- Figure 17: South America Ultraviolet Phototherapy Instrument Revenue Share (%), by Application 2025 & 2033
- Figure 18: South America Ultraviolet Phototherapy Instrument Volume Share (%), by Application 2025 & 2033
- Figure 19: South America Ultraviolet Phototherapy Instrument Revenue (million), by Types 2025 & 2033
- Figure 20: South America Ultraviolet Phototherapy Instrument Volume (K), by Types 2025 & 2033
- Figure 21: South America Ultraviolet Phototherapy Instrument Revenue Share (%), by Types 2025 & 2033
- Figure 22: South America Ultraviolet Phototherapy Instrument Volume Share (%), by Types 2025 & 2033
- Figure 23: South America Ultraviolet Phototherapy Instrument Revenue (million), by Country 2025 & 2033
- Figure 24: South America Ultraviolet Phototherapy Instrument Volume (K), by Country 2025 & 2033
- Figure 25: South America Ultraviolet Phototherapy Instrument Revenue Share (%), by Country 2025 & 2033
- Figure 26: South America Ultraviolet Phototherapy Instrument Volume Share (%), by Country 2025 & 2033
- Figure 27: Europe Ultraviolet Phototherapy Instrument Revenue (million), by Application 2025 & 2033
- Figure 28: Europe Ultraviolet Phototherapy Instrument Volume (K), by Application 2025 & 2033
- Figure 29: Europe Ultraviolet Phototherapy Instrument Revenue Share (%), by Application 2025 & 2033
- Figure 30: Europe Ultraviolet Phototherapy Instrument Volume Share (%), by Application 2025 & 2033
- Figure 31: Europe Ultraviolet Phototherapy Instrument Revenue (million), by Types 2025 & 2033
- Figure 32: Europe Ultraviolet Phototherapy Instrument Volume (K), by Types 2025 & 2033
- Figure 33: Europe Ultraviolet Phototherapy Instrument Revenue Share (%), by Types 2025 & 2033
- Figure 34: Europe Ultraviolet Phototherapy Instrument Volume Share (%), by Types 2025 & 2033
- Figure 35: Europe Ultraviolet Phototherapy Instrument Revenue (million), by Country 2025 & 2033
- Figure 36: Europe Ultraviolet Phototherapy Instrument Volume (K), by Country 2025 & 2033
- Figure 37: Europe Ultraviolet Phototherapy Instrument Revenue Share (%), by Country 2025 & 2033
- Figure 38: Europe Ultraviolet Phototherapy Instrument Volume Share (%), by Country 2025 & 2033
- Figure 39: Middle East & Africa Ultraviolet Phototherapy Instrument Revenue (million), by Application 2025 & 2033
- Figure 40: Middle East & Africa Ultraviolet Phototherapy Instrument Volume (K), by Application 2025 & 2033
- Figure 41: Middle East & Africa Ultraviolet Phototherapy Instrument Revenue Share (%), by Application 2025 & 2033
- Figure 42: Middle East & Africa Ultraviolet Phototherapy Instrument Volume Share (%), by Application 2025 & 2033
- Figure 43: Middle East & Africa Ultraviolet Phototherapy Instrument Revenue (million), by Types 2025 & 2033
- Figure 44: Middle East & Africa Ultraviolet Phototherapy Instrument Volume (K), by Types 2025 & 2033
- Figure 45: Middle East & Africa Ultraviolet Phototherapy Instrument Revenue Share (%), by Types 2025 & 2033
- Figure 46: Middle East & Africa Ultraviolet Phototherapy Instrument Volume Share (%), by Types 2025 & 2033
- Figure 47: Middle East & Africa Ultraviolet Phototherapy Instrument Revenue (million), by Country 2025 & 2033
- Figure 48: Middle East & Africa Ultraviolet Phototherapy Instrument Volume (K), by Country 2025 & 2033
- Figure 49: Middle East & Africa Ultraviolet Phototherapy Instrument Revenue Share (%), by Country 2025 & 2033
- Figure 50: Middle East & Africa Ultraviolet Phototherapy Instrument Volume Share (%), by Country 2025 & 2033
- Figure 51: Asia Pacific Ultraviolet Phototherapy Instrument Revenue (million), by Application 2025 & 2033
- Figure 52: Asia Pacific Ultraviolet Phototherapy Instrument Volume (K), by Application 2025 & 2033
- Figure 53: Asia Pacific Ultraviolet Phototherapy Instrument Revenue Share (%), by Application 2025 & 2033
- Figure 54: Asia Pacific Ultraviolet Phototherapy Instrument Volume Share (%), by Application 2025 & 2033
- Figure 55: Asia Pacific Ultraviolet Phototherapy Instrument Revenue (million), by Types 2025 & 2033
- Figure 56: Asia Pacific Ultraviolet Phototherapy Instrument Volume (K), by Types 2025 & 2033
- Figure 57: Asia Pacific Ultraviolet Phototherapy Instrument Revenue Share (%), by Types 2025 & 2033
- Figure 58: Asia Pacific Ultraviolet Phototherapy Instrument Volume Share (%), by Types 2025 & 2033
- Figure 59: Asia Pacific Ultraviolet Phototherapy Instrument Revenue (million), by Country 2025 & 2033
- Figure 60: Asia Pacific Ultraviolet Phototherapy Instrument Volume (K), by Country 2025 & 2033
- Figure 61: Asia Pacific Ultraviolet Phototherapy Instrument Revenue Share (%), by Country 2025 & 2033
- Figure 62: Asia Pacific Ultraviolet Phototherapy Instrument Volume Share (%), by Country 2025 & 2033
List of Tables
- Table 1: Global Ultraviolet Phototherapy Instrument Revenue million Forecast, by Application 2020 & 2033
- Table 2: Global Ultraviolet Phototherapy Instrument Volume K Forecast, by Application 2020 & 2033
- Table 3: Global Ultraviolet Phototherapy Instrument Revenue million Forecast, by Types 2020 & 2033
- Table 4: Global Ultraviolet Phototherapy Instrument Volume K Forecast, by Types 2020 & 2033
- Table 5: Global Ultraviolet Phototherapy Instrument Revenue million Forecast, by Region 2020 & 2033
- Table 6: Global Ultraviolet Phototherapy Instrument Volume K Forecast, by Region 2020 & 2033
- Table 7: Global Ultraviolet Phototherapy Instrument Revenue million Forecast, by Application 2020 & 2033
- Table 8: Global Ultraviolet Phototherapy Instrument Volume K Forecast, by Application 2020 & 2033
- Table 9: Global Ultraviolet Phototherapy Instrument Revenue million Forecast, by Types 2020 & 2033
- Table 10: Global Ultraviolet Phototherapy Instrument Volume K Forecast, by Types 2020 & 2033
- Table 11: Global Ultraviolet Phototherapy Instrument Revenue million Forecast, by Country 2020 & 2033
- Table 12: Global Ultraviolet Phototherapy Instrument Volume K Forecast, by Country 2020 & 2033
- Table 13: United States Ultraviolet Phototherapy Instrument Revenue (million) Forecast, by Application 2020 & 2033
- Table 14: United States Ultraviolet Phototherapy Instrument Volume (K) Forecast, by Application 2020 & 2033
- Table 15: Canada Ultraviolet Phototherapy Instrument Revenue (million) Forecast, by Application 2020 & 2033
- Table 16: Canada Ultraviolet Phototherapy Instrument Volume (K) Forecast, by Application 2020 & 2033
- Table 17: Mexico Ultraviolet Phototherapy Instrument Revenue (million) Forecast, by Application 2020 & 2033
- Table 18: Mexico Ultraviolet Phototherapy Instrument Volume (K) Forecast, by Application 2020 & 2033
- Table 19: Global Ultraviolet Phototherapy Instrument Revenue million Forecast, by Application 2020 & 2033
- Table 20: Global Ultraviolet Phototherapy Instrument Volume K Forecast, by Application 2020 & 2033
- Table 21: Global Ultraviolet Phototherapy Instrument Revenue million Forecast, by Types 2020 & 2033
- Table 22: Global Ultraviolet Phototherapy Instrument Volume K Forecast, by Types 2020 & 2033
- Table 23: Global Ultraviolet Phototherapy Instrument Revenue million Forecast, by Country 2020 & 2033
- Table 24: Global Ultraviolet Phototherapy Instrument Volume K Forecast, by Country 2020 & 2033
- Table 25: Brazil Ultraviolet Phototherapy Instrument Revenue (million) Forecast, by Application 2020 & 2033
- Table 26: Brazil Ultraviolet Phototherapy Instrument Volume (K) Forecast, by Application 2020 & 2033
- Table 27: Argentina Ultraviolet Phototherapy Instrument Revenue (million) Forecast, by Application 2020 & 2033
- Table 28: Argentina Ultraviolet Phototherapy Instrument Volume (K) Forecast, by Application 2020 & 2033
- Table 29: Rest of South America Ultraviolet Phototherapy Instrument Revenue (million) Forecast, by Application 2020 & 2033
- Table 30: Rest of South America Ultraviolet Phototherapy Instrument Volume (K) Forecast, by Application 2020 & 2033
- Table 31: Global Ultraviolet Phototherapy Instrument Revenue million Forecast, by Application 2020 & 2033
- Table 32: Global Ultraviolet Phototherapy Instrument Volume K Forecast, by Application 2020 & 2033
- Table 33: Global Ultraviolet Phototherapy Instrument Revenue million Forecast, by Types 2020 & 2033
- Table 34: Global Ultraviolet Phototherapy Instrument Volume K Forecast, by Types 2020 & 2033
- Table 35: Global Ultraviolet Phototherapy Instrument Revenue million Forecast, by Country 2020 & 2033
- Table 36: Global Ultraviolet Phototherapy Instrument Volume K Forecast, by Country 2020 & 2033
- Table 37: United Kingdom Ultraviolet Phototherapy Instrument Revenue (million) Forecast, by Application 2020 & 2033
- Table 38: United Kingdom Ultraviolet Phototherapy Instrument Volume (K) Forecast, by Application 2020 & 2033
- Table 39: Germany Ultraviolet Phototherapy Instrument Revenue (million) Forecast, by Application 2020 & 2033
- Table 40: Germany Ultraviolet Phototherapy Instrument Volume (K) Forecast, by Application 2020 & 2033
- Table 41: France Ultraviolet Phototherapy Instrument Revenue (million) Forecast, by Application 2020 & 2033
- Table 42: France Ultraviolet Phototherapy Instrument Volume (K) Forecast, by Application 2020 & 2033
- Table 43: Italy Ultraviolet Phototherapy Instrument Revenue (million) Forecast, by Application 2020 & 2033
- Table 44: Italy Ultraviolet Phototherapy Instrument Volume (K) Forecast, by Application 2020 & 2033
- Table 45: Spain Ultraviolet Phototherapy Instrument Revenue (million) Forecast, by Application 2020 & 2033
- Table 46: Spain Ultraviolet Phototherapy Instrument Volume (K) Forecast, by Application 2020 & 2033
- Table 47: Russia Ultraviolet Phototherapy Instrument Revenue (million) Forecast, by Application 2020 & 2033
- Table 48: Russia Ultraviolet Phototherapy Instrument Volume (K) Forecast, by Application 2020 & 2033
- Table 49: Benelux Ultraviolet Phototherapy Instrument Revenue (million) Forecast, by Application 2020 & 2033
- Table 50: Benelux Ultraviolet Phototherapy Instrument Volume (K) Forecast, by Application 2020 & 2033
- Table 51: Nordics Ultraviolet Phototherapy Instrument Revenue (million) Forecast, by Application 2020 & 2033
- Table 52: Nordics Ultraviolet Phototherapy Instrument Volume (K) Forecast, by Application 2020 & 2033
- Table 53: Rest of Europe Ultraviolet Phototherapy Instrument Revenue (million) Forecast, by Application 2020 & 2033
- Table 54: Rest of Europe Ultraviolet Phototherapy Instrument Volume (K) Forecast, by Application 2020 & 2033
- Table 55: Global Ultraviolet Phototherapy Instrument Revenue million Forecast, by Application 2020 & 2033
- Table 56: Global Ultraviolet Phototherapy Instrument Volume K Forecast, by Application 2020 & 2033
- Table 57: Global Ultraviolet Phototherapy Instrument Revenue million Forecast, by Types 2020 & 2033
- Table 58: Global Ultraviolet Phototherapy Instrument Volume K Forecast, by Types 2020 & 2033
- Table 59: Global Ultraviolet Phototherapy Instrument Revenue million Forecast, by Country 2020 & 2033
- Table 60: Global Ultraviolet Phototherapy Instrument Volume K Forecast, by Country 2020 & 2033
- Table 61: Turkey Ultraviolet Phototherapy Instrument Revenue (million) Forecast, by Application 2020 & 2033
- Table 62: Turkey Ultraviolet Phototherapy Instrument Volume (K) Forecast, by Application 2020 & 2033
- Table 63: Israel Ultraviolet Phototherapy Instrument Revenue (million) Forecast, by Application 2020 & 2033
- Table 64: Israel Ultraviolet Phototherapy Instrument Volume (K) Forecast, by Application 2020 & 2033
- Table 65: GCC Ultraviolet Phototherapy Instrument Revenue (million) Forecast, by Application 2020 & 2033
- Table 66: GCC Ultraviolet Phototherapy Instrument Volume (K) Forecast, by Application 2020 & 2033
- Table 67: North Africa Ultraviolet Phototherapy Instrument Revenue (million) Forecast, by Application 2020 & 2033
- Table 68: North Africa Ultraviolet Phototherapy Instrument Volume (K) Forecast, by Application 2020 & 2033
- Table 69: South Africa Ultraviolet Phototherapy Instrument Revenue (million) Forecast, by Application 2020 & 2033
- Table 70: South Africa Ultraviolet Phototherapy Instrument Volume (K) Forecast, by Application 2020 & 2033
- Table 71: Rest of Middle East & Africa Ultraviolet Phototherapy Instrument Revenue (million) Forecast, by Application 2020 & 2033
- Table 72: Rest of Middle East & Africa Ultraviolet Phototherapy Instrument Volume (K) Forecast, by Application 2020 & 2033
- Table 73: Global Ultraviolet Phototherapy Instrument Revenue million Forecast, by Application 2020 & 2033
- Table 74: Global Ultraviolet Phototherapy Instrument Volume K Forecast, by Application 2020 & 2033
- Table 75: Global Ultraviolet Phototherapy Instrument Revenue million Forecast, by Types 2020 & 2033
- Table 76: Global Ultraviolet Phototherapy Instrument Volume K Forecast, by Types 2020 & 2033
- Table 77: Global Ultraviolet Phototherapy Instrument Revenue million Forecast, by Country 2020 & 2033
- Table 78: Global Ultraviolet Phototherapy Instrument Volume K Forecast, by Country 2020 & 2033
- Table 79: China Ultraviolet Phototherapy Instrument Revenue (million) Forecast, by Application 2020 & 2033
- Table 80: China Ultraviolet Phototherapy Instrument Volume (K) Forecast, by Application 2020 & 2033
- Table 81: India Ultraviolet Phototherapy Instrument Revenue (million) Forecast, by Application 2020 & 2033
- Table 82: India Ultraviolet Phototherapy Instrument Volume (K) Forecast, by Application 2020 & 2033
- Table 83: Japan Ultraviolet Phototherapy Instrument Revenue (million) Forecast, by Application 2020 & 2033
- Table 84: Japan Ultraviolet Phototherapy Instrument Volume (K) Forecast, by Application 2020 & 2033
- Table 85: South Korea Ultraviolet Phototherapy Instrument Revenue (million) Forecast, by Application 2020 & 2033
- Table 86: South Korea Ultraviolet Phototherapy Instrument Volume (K) Forecast, by Application 2020 & 2033
- Table 87: ASEAN Ultraviolet Phototherapy Instrument Revenue (million) Forecast, by Application 2020 & 2033
- Table 88: ASEAN Ultraviolet Phototherapy Instrument Volume (K) Forecast, by Application 2020 & 2033
- Table 89: Oceania Ultraviolet Phototherapy Instrument Revenue (million) Forecast, by Application 2020 & 2033
- Table 90: Oceania Ultraviolet Phototherapy Instrument Volume (K) Forecast, by Application 2020 & 2033
- Table 91: Rest of Asia Pacific Ultraviolet Phototherapy Instrument Revenue (million) Forecast, by Application 2020 & 2033
- Table 92: Rest of Asia Pacific Ultraviolet Phototherapy Instrument Volume (K) Forecast, by Application 2020 & 2033
Frequently Asked Questions
1. What is the projected Compound Annual Growth Rate (CAGR) of the Ultraviolet Phototherapy Instrument?
The projected CAGR is approximately 6%.
2. Which companies are prominent players in the Ultraviolet Phototherapy Instrument?
Key companies in the market include Daavlin, Ushio Inc., Lumenis, National Biological(NatBio), Kernel Medical Equipment, Alma Lasers, Dr. Hönle Medizintechnik, Yonker Medical, Zerigo Health.
3. What are the main segments of the Ultraviolet Phototherapy Instrument?
The market segments include Application, Types.
4. Can you provide details about the market size?
The market size is estimated to be USD 558 million as of 2022.
5. What are some drivers contributing to market growth?
N/A
6. What are the notable trends driving market growth?
N/A
7. Are there any restraints impacting market growth?
N/A
8. Can you provide examples of recent developments in the market?
N/A
9. What pricing options are available for accessing the report?
Pricing options include single-user, multi-user, and enterprise licenses priced at USD 4350.00, USD 6525.00, and USD 8700.00 respectively.
10. Is the market size provided in terms of value or volume?
The market size is provided in terms of value, measured in million and volume, measured in K.
11. Are there any specific market keywords associated with the report?
Yes, the market keyword associated with the report is "Ultraviolet Phototherapy Instrument," which aids in identifying and referencing the specific market segment covered.
12. How do I determine which pricing option suits my needs best?
The pricing options vary based on user requirements and access needs. Individual users may opt for single-user licenses, while businesses requiring broader access may choose multi-user or enterprise licenses for cost-effective access to the report.
13. Are there any additional resources or data provided in the Ultraviolet Phototherapy Instrument report?
While the report offers comprehensive insights, it's advisable to review the specific contents or supplementary materials provided to ascertain if additional resources or data are available.
14. How can I stay updated on further developments or reports in the Ultraviolet Phototherapy Instrument?
To stay informed about further developments, trends, and reports in the Ultraviolet Phototherapy Instrument, consider subscribing to industry newsletters, following relevant companies and organizations, or regularly checking reputable industry news sources and publications.
Methodology
Step 1 - Identification of Relevant Samples Size from Population Database


Step 2 - Approaches for Defining Global Market Size (Value, Volume* & Price*)

Note*: In applicable scenarios
Step 3 - Data Sources
Primary Research
- Web Analytics
- Survey Reports
- Research Institute
- Latest Research Reports
- Opinion Leaders
Secondary Research
- Annual Reports
- White Paper
- Latest Press Release
- Industry Association
- Paid Database
- Investor Presentations

Step 4 - Data Triangulation
Involves using different sources of information in order to increase the validity of a study
These sources are likely to be stakeholders in a program - participants, other researchers, program staff, other community members, and so on.
Then we put all data in single framework & apply various statistical tools to find out the dynamic on the market.
During the analysis stage, feedback from the stakeholder groups would be compared to determine areas of agreement as well as areas of divergence