

Key Insights
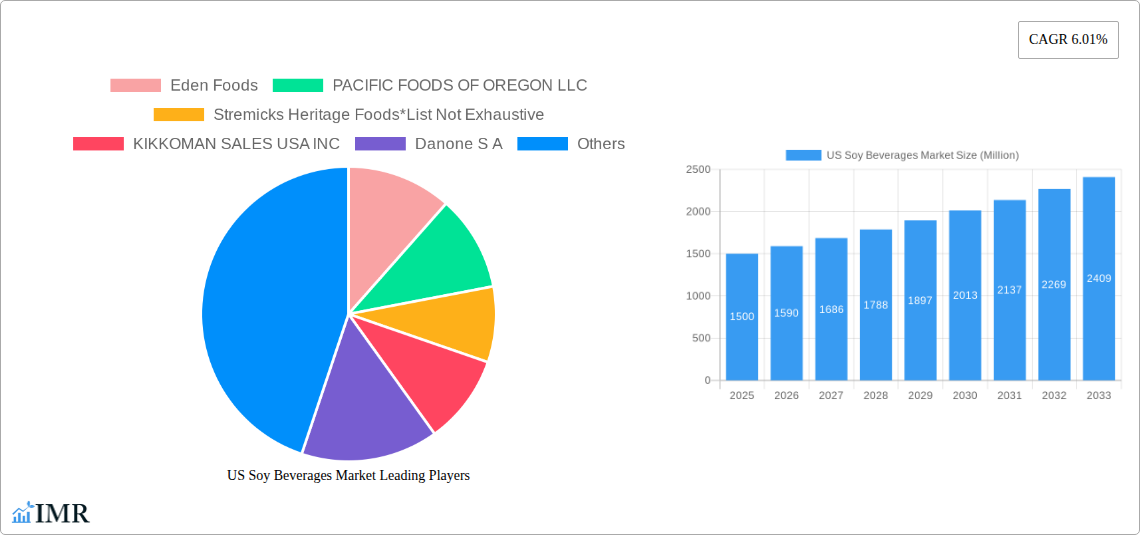
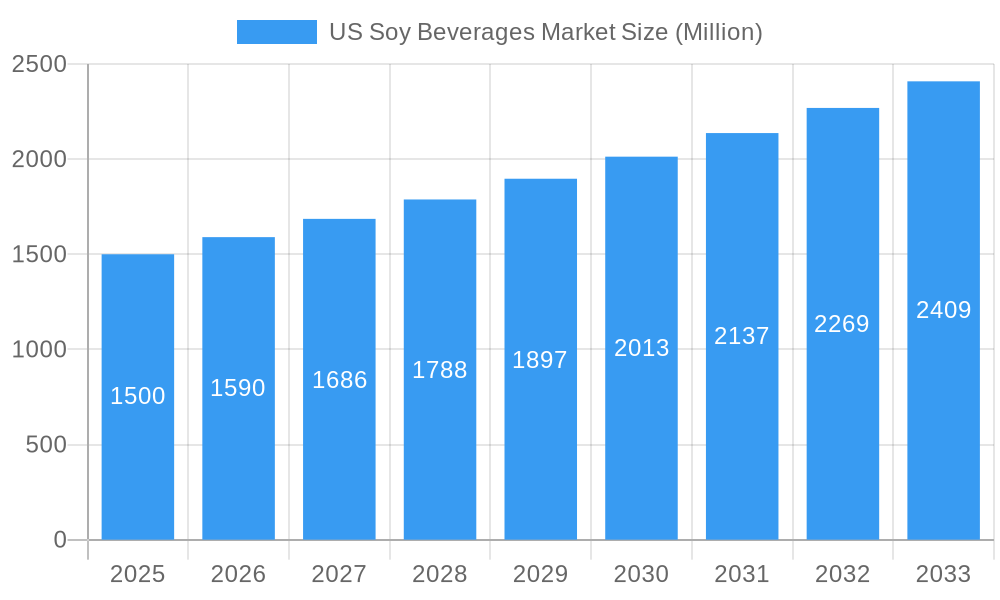
The U.S. soy beverage market, valued at approximately $1.08 billion in 2025, is poised for significant expansion, projected to grow at a Compound Annual Growth Rate (CAGR) of 5.5% between 2025 and 2033. This growth trajectory is propelled by increasing consumer awareness of soy's health benefits, including its protein content and cardiovascular advantages, driving demand for soy milk and yogurt alternatives. The rising adoption of plant-based diets and a growing preference for vegan and vegetarian options further fuel market expansion. The availability of diverse flavors enhances consumer appeal, while distribution channels like supermarkets/hypermarkets and rapidly growing online stores ensure broad accessibility. Intense competition among established brands such as Eden Foods, Pacific Foods, and Danone, alongside emerging players, fosters continuous innovation.
US Soy Beverages Market Market Size (In Billion)
Potential market restraints include soy commodity price volatility and heightened competition from alternative plant-based beverages like almond and oat milk. Consumer perceptions of soy beverage taste and texture relative to dairy also present a consideration. Despite these factors, the market outlook is robust, supported by the sustained growth in the plant-based food sector and the increasing acceptance of soy beverages as a healthy and sustainable choice. Market segmentation by product type (soy milk, soy yogurt), flavor, and distribution channel presents substantial opportunities for both established and new market participants. Regional consumption patterns, influenced by dietary habits and cultural preferences, will continue to shape the market's landscape across the U.S. Northeast, Southeast, Midwest, Southwest, and West regions.
US Soy Beverages Market Company Market Share
US Soy Beverages Market: A Comprehensive Market Report (2019-2033)
This comprehensive report provides an in-depth analysis of the US Soy Beverages market, covering market dynamics, growth trends, regional segmentation, product landscape, key players, and future outlook. The study period spans from 2019 to 2033, with 2025 as the base and estimated year. This report is a crucial resource for industry professionals, investors, and stakeholders seeking to understand and capitalize on the opportunities within this dynamic market. The report's parent market is the US Non-Dairy Beverage Market, and the child markets are various soy-based beverage types.
Market Size (in Million Units): The US Soy Beverages market was valued at xx Million units in 2024 and is projected to reach xx Million units by 2033, exhibiting a CAGR of xx% during the forecast period (2025-2033).
US Soy Beverages Market Market Dynamics & Structure
The US soy beverage market is characterized by moderate concentration, with several key players holding significant market share, alongside numerous smaller regional and niche brands. Technological innovation, particularly in sustainable packaging and enhanced flavor profiles, is a key driver. Regulatory frameworks concerning labeling and health claims influence product development and marketing strategies. Competitive substitutes include other plant-based beverages (almond, oat, etc.), impacting market share. Consumer demographics, specifically health-conscious and environmentally aware individuals, are significant drivers of market growth. M&A activity in the sector has been relatively moderate, with larger companies strategically acquiring smaller brands to expand their product portfolios.
- Market Concentration: Moderately concentrated, with top 5 players holding approximately xx% market share in 2024.
- Technological Innovation: Focus on sustainable packaging, improved flavor profiles, and fortified nutrient content.
- Regulatory Framework: Stringent labeling regulations and health claim verification processes.
- Competitive Substitutes: Almond milk, oat milk, and other plant-based beverages.
- End-User Demographics: Health-conscious consumers, vegans, vegetarians, and those with lactose intolerance.
- M&A Trends: Moderate activity with strategic acquisitions by larger players. xx M&A deals were recorded between 2019-2024.
US Soy Beverages Market Growth Trends & Insights
The US soy beverage market has witnessed consistent growth over the historical period (2019-2024), driven by increasing consumer awareness of health and wellness, coupled with a growing preference for plant-based alternatives to dairy milk. This trend is further amplified by the rising adoption of vegan and vegetarian lifestyles. Technological advancements in soy processing and formulation have led to improved taste and texture, enhancing consumer acceptance. Shifting consumer preferences towards convenience and ready-to-drink formats have significantly boosted market growth. The market has also seen increased innovation in flavors and functional benefits, contributing to its expansion. The market penetration of soy beverages increased from xx% in 2019 to xx% in 2024.
- Market Size Evolution: Steady growth from xx Million units in 2019 to xx Million units in 2024.
- Adoption Rates: Increased adoption among health-conscious and environmentally aware consumers.
- Technological Disruptions: Innovations in flavor profiles, functional ingredients, and sustainable packaging.
- Consumer Behavior Shifts: Growing preference for plant-based alternatives and convenient formats.
Dominant Regions, Countries, or Segments in US Soy Beverages Market
The Western and North Eastern regions of the US dominate the soy beverage market, driven by higher consumer awareness and purchasing power. Within product types, soy milk holds the largest market share, owing to its established presence and wide acceptance. Flavored soy beverages are experiencing faster growth compared to plain varieties, owing to their appeal to a broader consumer base. Supermarket/hypermarkets are the leading distribution channel, benefiting from significant shelf space and established distribution networks.
- Leading Region: Western & North Eastern US
- Dominant Product Type: Soy Milk (xx% market share in 2024)
- Fastest-Growing Flavor Segment: Flavored Soy Beverages (xx% CAGR during 2025-2033)
- Leading Distribution Channel: Supermarket/hypermarkets (xx% market share in 2024).
- Key Drivers: High consumer awareness, health consciousness, and established distribution networks.
US Soy Beverages Market Product Landscape
The US soy beverage market presents a diverse range of products, encompassing various soy milk formulations, soy-based yogurt drinks, and other innovative soy-derived beverages. Product innovation focuses on enhancing taste, texture, and nutritional profiles. Technological advancements include improved processing methods to minimize the 'beany' aftertaste and the incorporation of functional ingredients for added health benefits. Unique selling propositions center around organic certifications, sustainable sourcing, and specific health claims like added protein or vitamins.
Key Drivers, Barriers & Challenges in US Soy Beverages Market
Key Drivers: Growing consumer demand for plant-based alternatives, increasing health consciousness, and the rising popularity of vegan and vegetarian diets are driving market growth. Technological advancements enhancing taste and texture further propel market expansion. Favorable government policies promoting plant-based diets also support this trend.
Key Challenges & Restraints: Fluctuations in raw material prices (soybeans) and supply chain disruptions can negatively impact profitability. Intense competition from other plant-based beverages and established dairy products poses a significant challenge. Stringent regulatory frameworks related to labeling and health claims increase compliance costs. Consumer perception regarding the taste and texture of soy beverages also presents an ongoing hurdle.
Emerging Opportunities in US Soy Beverages Market
Untapped opportunities lie in expanding into niche markets, such as functional soy beverages with specific health benefits (e.g., high protein, low sugar). Developing innovative flavors and product formats catering to evolving consumer preferences is another promising area. Expanding distribution channels through online platforms and direct-to-consumer models can broaden market reach. Focus on sustainable and ethically sourced soybeans will also resonate with environmentally conscious consumers.
Growth Accelerators in the US Soy Beverages Market Industry
Long-term growth in the US soy beverage market will be fueled by technological innovations leading to improved taste and texture, reducing the 'beany' aftertaste many consumers find unappealing. Strategic partnerships between soy beverage producers and food service companies will expand market reach into cafes, restaurants, and institutional settings. Expanding product lines to include more diverse flavor profiles and functional benefits will attract a wider range of consumers and drive further market growth.
Key Players Shaping the US Soy Beverages Market Market
- Eden Foods
- PACIFIC FOODS OF OREGON LLC
- Stremicks Heritage Foods
- KIKKOMAN SALES USA INC
- Danone S.A.
- Hain Celestial
Notable Milestones in US Soy Beverages Market Sector
- 2020: Increased focus on organic and sustainable sourcing by major players.
- 2021: Launch of several new soy-based yogurt drinks with enhanced flavor profiles.
- 2022: Introduction of innovative packaging solutions focused on sustainability.
- 2023: Several smaller brands acquired by larger corporations to expand product portfolios.
- 2024: Government initiatives promoting plant-based diets positively impacting market growth.
In-Depth US Soy Beverages Market Market Outlook
The US soy beverage market holds significant potential for future growth, driven by continued consumer demand for plant-based alternatives and the ongoing innovation within the sector. Strategic opportunities exist in expanding into new markets, strengthening brand building, and further product diversification. The focus on sustainability and ethical sourcing is anticipated to play an increasingly vital role in shaping the future of the market, offering opportunities for brands embracing these values.
US Soy Beverages Market Segmentation
-
1. Product Type
- 1.1. Soy Milk
- 1.2. Soy-Based Drinkable Yogurt
-
2. Flavor
- 2.1. Plain Soy Beverages
- 2.2. Flavored Soy Beverages
-
3. Distribution Channel
- 3.1. Supermarket/hypermarkets
- 3.2. Convenience Stores
- 3.3. Pharmacies/Drug Stores
- 3.4. Online Stores
- 3.5. Others
US Soy Beverages Market Segmentation By Geography
-
1. North America
- 1.1. United States
- 1.2. Canada
- 1.3. Mexico
-
2. South America
- 2.1. Brazil
- 2.2. Argentina
- 2.3. Rest of South America
-
3. Europe
- 3.1. United Kingdom
- 3.2. Germany
- 3.3. France
- 3.4. Italy
- 3.5. Spain
- 3.6. Russia
- 3.7. Benelux
- 3.8. Nordics
- 3.9. Rest of Europe
-
4. Middle East & Africa
- 4.1. Turkey
- 4.2. Israel
- 4.3. GCC
- 4.4. North Africa
- 4.5. South Africa
- 4.6. Rest of Middle East & Africa
-
5. Asia Pacific
- 5.1. China
- 5.2. India
- 5.3. Japan
- 5.4. South Korea
- 5.5. ASEAN
- 5.6. Oceania
- 5.7. Rest of Asia Pacific
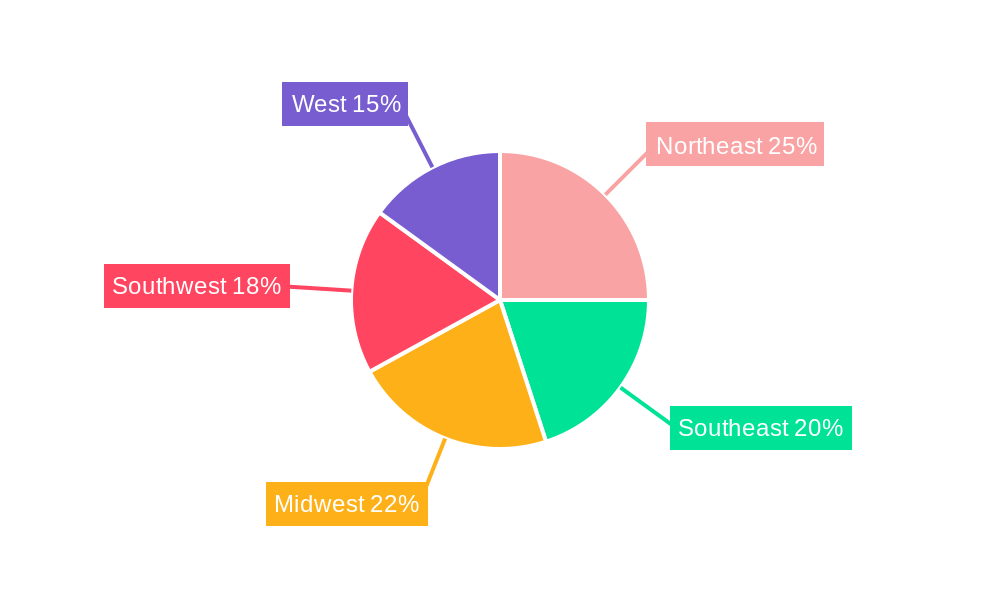
US Soy Beverages Market Regional Market Share
Geographic Coverage of US Soy Beverages Market
US Soy Beverages Market REPORT HIGHLIGHTS
| Aspects | Details |
|---|---|
| Study Period | 2020-2034 |
| Base Year | 2025 |
| Estimated Year | 2026 |
| Forecast Period | 2026-2034 |
| Historical Period | 2020-2025 |
| Growth Rate | CAGR of 5.5% from 2020-2034 |
| Segmentation |
|
Table of Contents
- 1. Introduction
- 1.1. Research Scope
- 1.2. Market Segmentation
- 1.3. Research Objective
- 1.4. Definitions and Assumptions
- 2. Executive Summary
- 2.1. Market Snapshot
- 3. Market Dynamics
- 3.1. Market Drivers
- 3.2. Market Restrains
- 3.3. Market Trends
- 3.4. Market Opportunities
- 4. Market Factor Analysis
- 4.1. Porters Five Forces
- 4.1.1. Bargaining Power of Suppliers
- 4.1.2. Bargaining Power of Buyers
- 4.1.3. Threat of New Entrants
- 4.1.4. Threat of Substitutes
- 4.1.5. Competitive Rivalry
- 4.2. PESTEL analysis
- 4.3. BCG Analysis
- 4.3.1. Stars (High Growth, High Market Share)
- 4.3.2. Cash Cows (Low Growth, High Market Share)
- 4.3.3. Question Mark (High Growth, Low Market Share)
- 4.3.4. Dogs (Low Growth, Low Market Share)
- 4.4. Ansoff Matrix Analysis
- 4.5. Supply Chain Analysis
- 4.6. Regulatory Landscape
- 4.7. Current Market Potential and Opportunity Assessment (TAM–SAM–SOM Framework)
- 4.8. IMR Analyst Note
- 4.1. Porters Five Forces
- 5. Market Analysis, Insights and Forecast 2021-2033
- 5.1. Market Analysis, Insights and Forecast - by Product Type
- 5.1.1. Soy Milk
- 5.1.2. Soy-Based Drinkable Yogurt
- 5.2. Market Analysis, Insights and Forecast - by Flavor
- 5.2.1. Plain Soy Beverages
- 5.2.2. Flavored Soy Beverages
- 5.3. Market Analysis, Insights and Forecast - by Distribution Channel
- 5.3.1. Supermarket/hypermarkets
- 5.3.2. Convenience Stores
- 5.3.3. Pharmacies/Drug Stores
- 5.3.4. Online Stores
- 5.3.5. Others
- 5.4. Market Analysis, Insights and Forecast - by Region
- 5.4.1. North America
- 5.4.2. South America
- 5.4.3. Europe
- 5.4.4. Middle East & Africa
- 5.4.5. Asia Pacific
- 5.1. Market Analysis, Insights and Forecast - by Product Type
- 6. Global US Soy Beverages Market Analysis, Insights and Forecast, 2021-2033
- 6.1. Market Analysis, Insights and Forecast - by Product Type
- 6.1.1. Soy Milk
- 6.1.2. Soy-Based Drinkable Yogurt
- 6.2. Market Analysis, Insights and Forecast - by Flavor
- 6.2.1. Plain Soy Beverages
- 6.2.2. Flavored Soy Beverages
- 6.3. Market Analysis, Insights and Forecast - by Distribution Channel
- 6.3.1. Supermarket/hypermarkets
- 6.3.2. Convenience Stores
- 6.3.3. Pharmacies/Drug Stores
- 6.3.4. Online Stores
- 6.3.5. Others
- 6.1. Market Analysis, Insights and Forecast - by Product Type
- 7. North America US Soy Beverages Market Analysis, Insights and Forecast, 2020-2032
- 7.1. Market Analysis, Insights and Forecast - by Product Type
- 7.1.1. Soy Milk
- 7.1.2. Soy-Based Drinkable Yogurt
- 7.2. Market Analysis, Insights and Forecast - by Flavor
- 7.2.1. Plain Soy Beverages
- 7.2.2. Flavored Soy Beverages
- 7.3. Market Analysis, Insights and Forecast - by Distribution Channel
- 7.3.1. Supermarket/hypermarkets
- 7.3.2. Convenience Stores
- 7.3.3. Pharmacies/Drug Stores
- 7.3.4. Online Stores
- 7.3.5. Others
- 7.1. Market Analysis, Insights and Forecast - by Product Type
- 8. South America US Soy Beverages Market Analysis, Insights and Forecast, 2020-2032
- 8.1. Market Analysis, Insights and Forecast - by Product Type
- 8.1.1. Soy Milk
- 8.1.2. Soy-Based Drinkable Yogurt
- 8.2. Market Analysis, Insights and Forecast - by Flavor
- 8.2.1. Plain Soy Beverages
- 8.2.2. Flavored Soy Beverages
- 8.3. Market Analysis, Insights and Forecast - by Distribution Channel
- 8.3.1. Supermarket/hypermarkets
- 8.3.2. Convenience Stores
- 8.3.3. Pharmacies/Drug Stores
- 8.3.4. Online Stores
- 8.3.5. Others
- 8.1. Market Analysis, Insights and Forecast - by Product Type
- 9. Europe US Soy Beverages Market Analysis, Insights and Forecast, 2020-2032
- 9.1. Market Analysis, Insights and Forecast - by Product Type
- 9.1.1. Soy Milk
- 9.1.2. Soy-Based Drinkable Yogurt
- 9.2. Market Analysis, Insights and Forecast - by Flavor
- 9.2.1. Plain Soy Beverages
- 9.2.2. Flavored Soy Beverages
- 9.3. Market Analysis, Insights and Forecast - by Distribution Channel
- 9.3.1. Supermarket/hypermarkets
- 9.3.2. Convenience Stores
- 9.3.3. Pharmacies/Drug Stores
- 9.3.4. Online Stores
- 9.3.5. Others
- 9.1. Market Analysis, Insights and Forecast - by Product Type
- 10. Middle East & Africa US Soy Beverages Market Analysis, Insights and Forecast, 2020-2032
- 10.1. Market Analysis, Insights and Forecast - by Product Type
- 10.1.1. Soy Milk
- 10.1.2. Soy-Based Drinkable Yogurt
- 10.2. Market Analysis, Insights and Forecast - by Flavor
- 10.2.1. Plain Soy Beverages
- 10.2.2. Flavored Soy Beverages
- 10.3. Market Analysis, Insights and Forecast - by Distribution Channel
- 10.3.1. Supermarket/hypermarkets
- 10.3.2. Convenience Stores
- 10.3.3. Pharmacies/Drug Stores
- 10.3.4. Online Stores
- 10.3.5. Others
- 10.1. Market Analysis, Insights and Forecast - by Product Type
- 11. Asia Pacific US Soy Beverages Market Analysis, Insights and Forecast, 2020-2032
- 11.1. Market Analysis, Insights and Forecast - by Product Type
- 11.1.1. Soy Milk
- 11.1.2. Soy-Based Drinkable Yogurt
- 11.2. Market Analysis, Insights and Forecast - by Flavor
- 11.2.1. Plain Soy Beverages
- 11.2.2. Flavored Soy Beverages
- 11.3. Market Analysis, Insights and Forecast - by Distribution Channel
- 11.3.1. Supermarket/hypermarkets
- 11.3.2. Convenience Stores
- 11.3.3. Pharmacies/Drug Stores
- 11.3.4. Online Stores
- 11.3.5. Others
- 11.1. Market Analysis, Insights and Forecast - by Product Type
- 12. Competitive Analysis
- 12.1. Company Profiles
- 12.1.1 Eden Foods
- 12.1.1.1. Company Overview
- 12.1.1.2. Products
- 12.1.1.3. Company Financials
- 12.1.1.4. SWOT Analysis
- 12.1.2 PACIFIC FOODS OF OREGON LLC
- 12.1.2.1. Company Overview
- 12.1.2.2. Products
- 12.1.2.3. Company Financials
- 12.1.2.4. SWOT Analysis
- 12.1.3 Stremicks Heritage Foods*List Not Exhaustive
- 12.1.3.1. Company Overview
- 12.1.3.2. Products
- 12.1.3.3. Company Financials
- 12.1.3.4. SWOT Analysis
- 12.1.4 KIKKOMAN SALES USA INC
- 12.1.4.1. Company Overview
- 12.1.4.2. Products
- 12.1.4.3. Company Financials
- 12.1.4.4. SWOT Analysis
- 12.1.5 Danone S A
- 12.1.5.1. Company Overview
- 12.1.5.2. Products
- 12.1.5.3. Company Financials
- 12.1.5.4. SWOT Analysis
- 12.1.6 Hain Celestial
- 12.1.6.1. Company Overview
- 12.1.6.2. Products
- 12.1.6.3. Company Financials
- 12.1.6.4. SWOT Analysis
- 12.1.1 Eden Foods
- 12.2. Market Entropy
- 12.2.1 Company's Key Areas Served
- 12.2.2 Recent Developments
- 12.3. Company Market Share Analysis 2025
- 12.3.1 Top 5 Companies Market Share Analysis
- 12.3.2 Top 3 Companies Market Share Analysis
- 12.4. List of Potential Customers
- 13. Research Methodology
List of Figures
- Figure 1: Global US Soy Beverages Market Revenue Breakdown (billion, %) by Region 2025 & 2033
- Figure 2: North America US Soy Beverages Market Revenue (billion), by Product Type 2025 & 2033
- Figure 3: North America US Soy Beverages Market Revenue Share (%), by Product Type 2025 & 2033
- Figure 4: North America US Soy Beverages Market Revenue (billion), by Flavor 2025 & 2033
- Figure 5: North America US Soy Beverages Market Revenue Share (%), by Flavor 2025 & 2033
- Figure 6: North America US Soy Beverages Market Revenue (billion), by Distribution Channel 2025 & 2033
- Figure 7: North America US Soy Beverages Market Revenue Share (%), by Distribution Channel 2025 & 2033
- Figure 8: North America US Soy Beverages Market Revenue (billion), by Country 2025 & 2033
- Figure 9: North America US Soy Beverages Market Revenue Share (%), by Country 2025 & 2033
- Figure 10: South America US Soy Beverages Market Revenue (billion), by Product Type 2025 & 2033
- Figure 11: South America US Soy Beverages Market Revenue Share (%), by Product Type 2025 & 2033
- Figure 12: South America US Soy Beverages Market Revenue (billion), by Flavor 2025 & 2033
- Figure 13: South America US Soy Beverages Market Revenue Share (%), by Flavor 2025 & 2033
- Figure 14: South America US Soy Beverages Market Revenue (billion), by Distribution Channel 2025 & 2033
- Figure 15: South America US Soy Beverages Market Revenue Share (%), by Distribution Channel 2025 & 2033
- Figure 16: South America US Soy Beverages Market Revenue (billion), by Country 2025 & 2033
- Figure 17: South America US Soy Beverages Market Revenue Share (%), by Country 2025 & 2033
- Figure 18: Europe US Soy Beverages Market Revenue (billion), by Product Type 2025 & 2033
- Figure 19: Europe US Soy Beverages Market Revenue Share (%), by Product Type 2025 & 2033
- Figure 20: Europe US Soy Beverages Market Revenue (billion), by Flavor 2025 & 2033
- Figure 21: Europe US Soy Beverages Market Revenue Share (%), by Flavor 2025 & 2033
- Figure 22: Europe US Soy Beverages Market Revenue (billion), by Distribution Channel 2025 & 2033
- Figure 23: Europe US Soy Beverages Market Revenue Share (%), by Distribution Channel 2025 & 2033
- Figure 24: Europe US Soy Beverages Market Revenue (billion), by Country 2025 & 2033
- Figure 25: Europe US Soy Beverages Market Revenue Share (%), by Country 2025 & 2033
- Figure 26: Middle East & Africa US Soy Beverages Market Revenue (billion), by Product Type 2025 & 2033
- Figure 27: Middle East & Africa US Soy Beverages Market Revenue Share (%), by Product Type 2025 & 2033
- Figure 28: Middle East & Africa US Soy Beverages Market Revenue (billion), by Flavor 2025 & 2033
- Figure 29: Middle East & Africa US Soy Beverages Market Revenue Share (%), by Flavor 2025 & 2033
- Figure 30: Middle East & Africa US Soy Beverages Market Revenue (billion), by Distribution Channel 2025 & 2033
- Figure 31: Middle East & Africa US Soy Beverages Market Revenue Share (%), by Distribution Channel 2025 & 2033
- Figure 32: Middle East & Africa US Soy Beverages Market Revenue (billion), by Country 2025 & 2033
- Figure 33: Middle East & Africa US Soy Beverages Market Revenue Share (%), by Country 2025 & 2033
- Figure 34: Asia Pacific US Soy Beverages Market Revenue (billion), by Product Type 2025 & 2033
- Figure 35: Asia Pacific US Soy Beverages Market Revenue Share (%), by Product Type 2025 & 2033
- Figure 36: Asia Pacific US Soy Beverages Market Revenue (billion), by Flavor 2025 & 2033
- Figure 37: Asia Pacific US Soy Beverages Market Revenue Share (%), by Flavor 2025 & 2033
- Figure 38: Asia Pacific US Soy Beverages Market Revenue (billion), by Distribution Channel 2025 & 2033
- Figure 39: Asia Pacific US Soy Beverages Market Revenue Share (%), by Distribution Channel 2025 & 2033
- Figure 40: Asia Pacific US Soy Beverages Market Revenue (billion), by Country 2025 & 2033
- Figure 41: Asia Pacific US Soy Beverages Market Revenue Share (%), by Country 2025 & 2033
List of Tables
- Table 1: Global US Soy Beverages Market Revenue billion Forecast, by Product Type 2020 & 2033
- Table 2: Global US Soy Beverages Market Revenue billion Forecast, by Flavor 2020 & 2033
- Table 3: Global US Soy Beverages Market Revenue billion Forecast, by Distribution Channel 2020 & 2033
- Table 4: Global US Soy Beverages Market Revenue billion Forecast, by Region 2020 & 2033
- Table 5: Global US Soy Beverages Market Revenue billion Forecast, by Product Type 2020 & 2033
- Table 6: Global US Soy Beverages Market Revenue billion Forecast, by Flavor 2020 & 2033
- Table 7: Global US Soy Beverages Market Revenue billion Forecast, by Distribution Channel 2020 & 2033
- Table 8: Global US Soy Beverages Market Revenue billion Forecast, by Country 2020 & 2033
- Table 9: United States US Soy Beverages Market Revenue (billion) Forecast, by Application 2020 & 2033
- Table 10: Canada US Soy Beverages Market Revenue (billion) Forecast, by Application 2020 & 2033
- Table 11: Mexico US Soy Beverages Market Revenue (billion) Forecast, by Application 2020 & 2033
- Table 12: Global US Soy Beverages Market Revenue billion Forecast, by Product Type 2020 & 2033
- Table 13: Global US Soy Beverages Market Revenue billion Forecast, by Flavor 2020 & 2033
- Table 14: Global US Soy Beverages Market Revenue billion Forecast, by Distribution Channel 2020 & 2033
- Table 15: Global US Soy Beverages Market Revenue billion Forecast, by Country 2020 & 2033
- Table 16: Brazil US Soy Beverages Market Revenue (billion) Forecast, by Application 2020 & 2033
- Table 17: Argentina US Soy Beverages Market Revenue (billion) Forecast, by Application 2020 & 2033
- Table 18: Rest of South America US Soy Beverages Market Revenue (billion) Forecast, by Application 2020 & 2033
- Table 19: Global US Soy Beverages Market Revenue billion Forecast, by Product Type 2020 & 2033
- Table 20: Global US Soy Beverages Market Revenue billion Forecast, by Flavor 2020 & 2033
- Table 21: Global US Soy Beverages Market Revenue billion Forecast, by Distribution Channel 2020 & 2033
- Table 22: Global US Soy Beverages Market Revenue billion Forecast, by Country 2020 & 2033
- Table 23: United Kingdom US Soy Beverages Market Revenue (billion) Forecast, by Application 2020 & 2033
- Table 24: Germany US Soy Beverages Market Revenue (billion) Forecast, by Application 2020 & 2033
- Table 25: France US Soy Beverages Market Revenue (billion) Forecast, by Application 2020 & 2033
- Table 26: Italy US Soy Beverages Market Revenue (billion) Forecast, by Application 2020 & 2033
- Table 27: Spain US Soy Beverages Market Revenue (billion) Forecast, by Application 2020 & 2033
- Table 28: Russia US Soy Beverages Market Revenue (billion) Forecast, by Application 2020 & 2033
- Table 29: Benelux US Soy Beverages Market Revenue (billion) Forecast, by Application 2020 & 2033
- Table 30: Nordics US Soy Beverages Market Revenue (billion) Forecast, by Application 2020 & 2033
- Table 31: Rest of Europe US Soy Beverages Market Revenue (billion) Forecast, by Application 2020 & 2033
- Table 32: Global US Soy Beverages Market Revenue billion Forecast, by Product Type 2020 & 2033
- Table 33: Global US Soy Beverages Market Revenue billion Forecast, by Flavor 2020 & 2033
- Table 34: Global US Soy Beverages Market Revenue billion Forecast, by Distribution Channel 2020 & 2033
- Table 35: Global US Soy Beverages Market Revenue billion Forecast, by Country 2020 & 2033
- Table 36: Turkey US Soy Beverages Market Revenue (billion) Forecast, by Application 2020 & 2033
- Table 37: Israel US Soy Beverages Market Revenue (billion) Forecast, by Application 2020 & 2033
- Table 38: GCC US Soy Beverages Market Revenue (billion) Forecast, by Application 2020 & 2033
- Table 39: North Africa US Soy Beverages Market Revenue (billion) Forecast, by Application 2020 & 2033
- Table 40: South Africa US Soy Beverages Market Revenue (billion) Forecast, by Application 2020 & 2033
- Table 41: Rest of Middle East & Africa US Soy Beverages Market Revenue (billion) Forecast, by Application 2020 & 2033
- Table 42: Global US Soy Beverages Market Revenue billion Forecast, by Product Type 2020 & 2033
- Table 43: Global US Soy Beverages Market Revenue billion Forecast, by Flavor 2020 & 2033
- Table 44: Global US Soy Beverages Market Revenue billion Forecast, by Distribution Channel 2020 & 2033
- Table 45: Global US Soy Beverages Market Revenue billion Forecast, by Country 2020 & 2033
- Table 46: China US Soy Beverages Market Revenue (billion) Forecast, by Application 2020 & 2033
- Table 47: India US Soy Beverages Market Revenue (billion) Forecast, by Application 2020 & 2033
- Table 48: Japan US Soy Beverages Market Revenue (billion) Forecast, by Application 2020 & 2033
- Table 49: South Korea US Soy Beverages Market Revenue (billion) Forecast, by Application 2020 & 2033
- Table 50: ASEAN US Soy Beverages Market Revenue (billion) Forecast, by Application 2020 & 2033
- Table 51: Oceania US Soy Beverages Market Revenue (billion) Forecast, by Application 2020 & 2033
- Table 52: Rest of Asia Pacific US Soy Beverages Market Revenue (billion) Forecast, by Application 2020 & 2033
Frequently Asked Questions
1. What is the projected Compound Annual Growth Rate (CAGR) of the US Soy Beverages Market?
The projected CAGR is approximately 5.5%.
2. Which companies are prominent players in the US Soy Beverages Market?
Key companies in the market include Eden Foods, PACIFIC FOODS OF OREGON LLC, Stremicks Heritage Foods*List Not Exhaustive, KIKKOMAN SALES USA INC, Danone S A, Hain Celestial.
3. What are the main segments of the US Soy Beverages Market?
The market segments include Product Type, Flavor, Distribution Channel.
4. Can you provide details about the market size?
The market size is estimated to be USD 1.08 billion as of 2022.
5. What are some drivers contributing to market growth?
Increasing Health Concerns are Supporting the Market's Growth; Growing Consumer Preference for Convenience Seafood.
6. What are the notable trends driving market growth?
Increasing Demand for Lactose-Free Foods.
7. Are there any restraints impacting market growth?
Rising Concern About Quality and Safety Standards of Canned Tuna.
8. Can you provide examples of recent developments in the market?
N/A
9. What pricing options are available for accessing the report?
Pricing options include single-user, multi-user, and enterprise licenses priced at USD 3800, USD 4500, and USD 5800 respectively.
10. Is the market size provided in terms of value or volume?
The market size is provided in terms of value, measured in billion.
11. Are there any specific market keywords associated with the report?
Yes, the market keyword associated with the report is "US Soy Beverages Market," which aids in identifying and referencing the specific market segment covered.
12. How do I determine which pricing option suits my needs best?
The pricing options vary based on user requirements and access needs. Individual users may opt for single-user licenses, while businesses requiring broader access may choose multi-user or enterprise licenses for cost-effective access to the report.
13. Are there any additional resources or data provided in the US Soy Beverages Market report?
While the report offers comprehensive insights, it's advisable to review the specific contents or supplementary materials provided to ascertain if additional resources or data are available.
14. How can I stay updated on further developments or reports in the US Soy Beverages Market?
To stay informed about further developments, trends, and reports in the US Soy Beverages Market, consider subscribing to industry newsletters, following relevant companies and organizations, or regularly checking reputable industry news sources and publications.
Methodology
Step 1 - Identification of Relevant Samples Size from Population Database


Step 2 - Approaches for Defining Global Market Size (Value, Volume* & Price*)

Note*: In applicable scenarios
Step 3 - Data Sources
Primary Research
- Web Analytics
- Survey Reports
- Research Institute
- Latest Research Reports
- Opinion Leaders
Secondary Research
- Annual Reports
- White Paper
- Latest Press Release
- Industry Association
- Paid Database
- Investor Presentations

Step 4 - Data Triangulation
Involves using different sources of information in order to increase the validity of a study
These sources are likely to be stakeholders in a program - participants, other researchers, program staff, other community members, and so on.
Then we put all data in single framework & apply various statistical tools to find out the dynamic on the market.
During the analysis stage, feedback from the stakeholder groups would be compared to determine areas of agreement as well as areas of divergence