

Key Insights
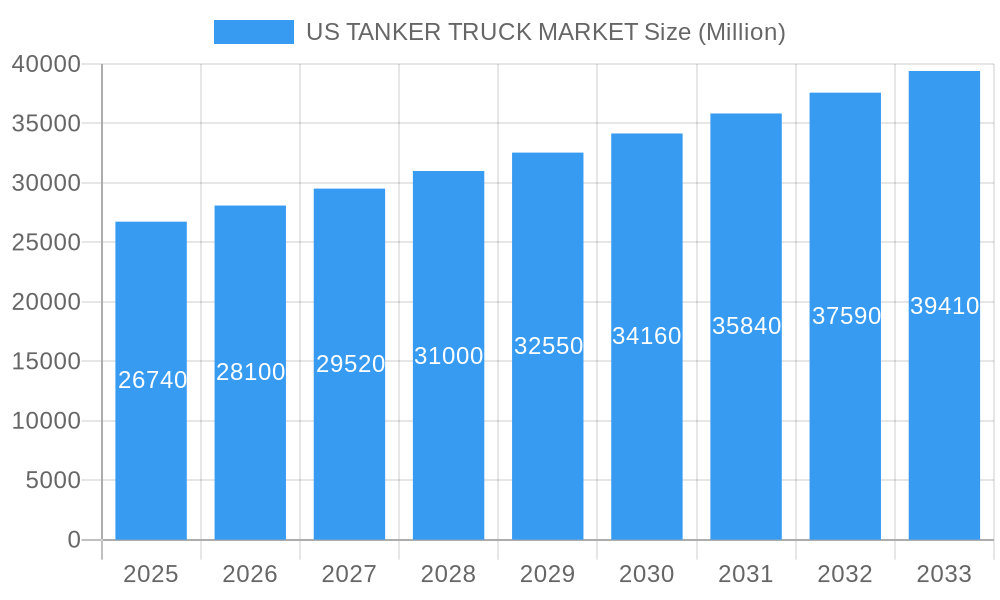
The US tanker truck market, valued at $26.74 billion in 2025, is projected to experience robust growth, driven by increasing demand across diverse sectors. The 5.03% CAGR (Compound Annual Growth Rate) from 2025 to 2033 indicates a significant expansion, fueled primarily by the burgeoning oil and gas industry, the expanding food and beverage sector requiring efficient transportation of liquids, and the growing need for chemical and water treatment services. Furthermore, the construction and waste management sectors contribute significantly to market growth, relying on tanker trucks for material transport and waste disposal. The market is segmented by tanker capacity (less than 1,000 gallons, 1,000-4,000 gallons, and over 4,000 gallons), reflecting varied transportation needs. Key players like Freightliner Trucks, Iveco, Scania AB, and Daimler AG are driving innovation and technological advancements in tanker truck design and efficiency, influencing market dynamics. Regional variations exist, with the Northeast, Southeast, Midwest, Southwest, and West regions exhibiting differing growth rates based on their specific industry compositions and infrastructural developments. While potential restraints like regulatory changes and fluctuating fuel prices could impact growth, the overall market outlook remains positive.
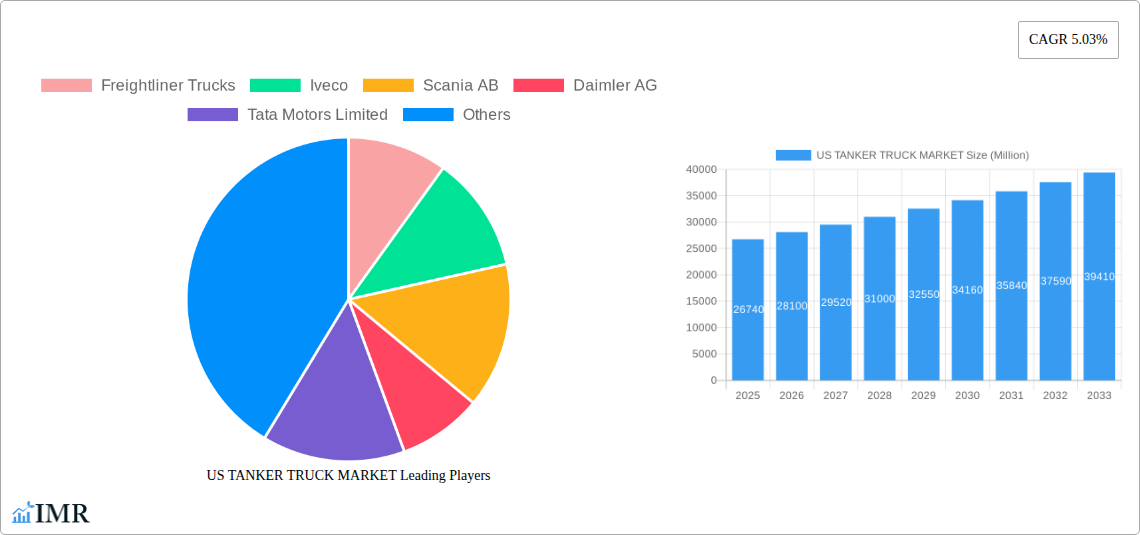
US TANKER TRUCK MARKET Market Size (In Billion)
The projected growth trajectory for the US tanker truck market reflects both organic expansion and strategic investments. The increasing adoption of advanced safety features and telematics solutions enhances efficiency and reduces operational costs, attracting investments. Further consolidation among key market players is expected, leading to increased market concentration. Regional variations will likely persist, with faster growth in regions experiencing rapid industrialization and infrastructural development. The market's success hinges on addressing environmental concerns and adopting sustainable practices, including the use of alternative fuels and emission reduction technologies. Market players are focusing on product innovation to cater to evolving customer demands and stringent regulatory compliance requirements, influencing the competitive landscape and market segmentation.
US TANKER TRUCK MARKET Company Market Share
US Tanker Truck Market: A Comprehensive Report (2019-2033)
This in-depth report provides a comprehensive analysis of the US tanker truck market, encompassing market dynamics, growth trends, regional dominance, product landscape, key players, and future outlook. The report covers the period from 2019 to 2033, with a base year of 2025 and a forecast period of 2025-2033. This analysis is crucial for businesses involved in the parent market of commercial vehicles and the child market of specialized transportation equipment, enabling informed decision-making and strategic planning. The market size is presented in million units.
US TANKER TRUCK MARKET Market Dynamics & Structure
The US tanker truck market is characterized by a moderately consolidated structure with several major players competing alongside numerous smaller regional operators. Technological advancements, primarily in engine technology, safety features, and telematics, are key drivers of innovation. Stringent regulatory frameworks concerning emissions, safety standards, and driver hours significantly impact market dynamics. Competitive product substitutes include rail and pipeline transportation, particularly for long-distance bulk haulage. End-user demographics are diverse, spanning various sectors with varying transportation needs. M&A activity remains moderate, with occasional consolidations among smaller players seeking operational efficiencies and expanded market reach.
- Market Concentration: Moderately consolidated, with a xx% market share held by the top 5 players in 2024.
- Technological Innovation: Focus on fuel efficiency, emission reduction, and advanced safety systems.
- Regulatory Framework: Stringent EPA emissions standards, FMCSA safety regulations, and driver hour limitations.
- Competitive Substitutes: Rail and pipeline transportation for bulk commodities.
- M&A Trends: Moderate activity, driven by efficiency gains and market expansion strategies. xx M&A deals recorded between 2019 and 2024.
- End-User Demographics: Diverse, including oil & gas, food, chemicals, and waste management.
US TANKER TRUCK MARKET Growth Trends & Insights
The US tanker truck market experienced steady growth between 2019 and 2024, driven primarily by expanding industrial activities and increasing demand for efficient transportation of liquids and gases across various sectors. The market is projected to maintain a Compound Annual Growth Rate (CAGR) of xx% during the forecast period (2025-2033), propelled by investments in infrastructure development and the rising adoption of advanced technologies within the trucking sector. Technological disruptions, such as the introduction of electric and alternative fuel vehicles, are expected to reshape the market landscape. Shifting consumer preferences toward environmentally sustainable transportation solutions are also anticipated to influence future growth. Market penetration of new technologies is estimated to reach xx% by 2033. The market size is projected to reach xx million units by 2033 from xx million units in 2024.
Dominant Regions, Countries, or Segments in US TANKER TRUCK MARKET
The "Between 1,000 Gallons and 4,000 Gallons" capacity segment dominates the US tanker truck market, accounting for approximately xx% of the total market share in 2024. This segment caters to a wide range of industries and transportation needs. The Oil and Gas Industry represents the largest sector type, driving a significant portion of market demand due to the substantial volume of liquid petroleum products transported. Regions with robust industrial activity and extensive highway networks experience higher market penetration.
- Dominant Capacity Segment: Between 1,000 and 4,000 gallons.
- Dominant Sector Type: Oil and Gas Industry, due to high volume transportation needs.
- Key Regional Drivers: States with significant industrial activity and extensive highway infrastructure (e.g., Texas, California, Louisiana).
- Growth Potential: Expansion in the renewable energy sector (biofuels) is expected to boost demand for specialized tanker trucks.
US TANKER TRUCK MARKET Product Landscape
Tanker truck designs are constantly evolving, incorporating features that enhance safety, fuel efficiency, and payload capacity. Innovations include advanced aerodynamic designs, lightweight materials, and sophisticated telematics systems for improved route optimization and fleet management. Unique selling propositions frequently focus on specialized tank configurations tailored to specific liquid cargo requirements, and advanced safety features minimizing risks associated with hazardous materials transport.
Key Drivers, Barriers & Challenges in US TANKER TRUCK MARKET
Key Drivers:
- Increasing industrial activity across various sectors.
- Expanding infrastructure development projects, requiring efficient material transport.
- Government initiatives promoting efficient transportation and reducing emissions.
Challenges:
- Driver shortages and high labor costs impacting operational efficiency.
- Fluctuating fuel prices influencing transportation costs.
- Stringent emissions regulations increasing compliance expenses.
Emerging Opportunities in US TANKER TRUCK MARKET
- Growing demand for sustainable and eco-friendly transportation solutions.
- Increasing adoption of advanced telematics and IoT technologies for improved fleet management.
- Expanding market penetration in the renewable energy sector (biofuels and other sustainable liquid products).
Growth Accelerators in the US TANKER TRUCK MARKET Industry
Technological advancements, particularly in electric and alternative fuel vehicles, offer significant growth potential. Strategic partnerships among manufacturers, logistics providers, and technology companies create synergies, boosting innovation and efficiency. Expansion into new markets and diversification into specialized transportation services further fuels long-term market growth.
Key Players Shaping the US TANKER TRUCK MARKET Market
Notable Milestones in US TANKER TRUCK MARKET Sector
- December 2023: Trina Solar launches its Trina-branded trucks for transporting PV modules, signaling a shift toward electric vehicles in 2024.
- April 2023: Daimler Truck unveils Rizon, a new brand of medium-duty electric trucks for the US market.
In-Depth US TANKER TRUCK MARKET Market Outlook
The US tanker truck market is poised for sustained growth, driven by technological innovation, expanding industrial activity, and a growing emphasis on sustainable transportation. Strategic partnerships and investments in electric vehicle infrastructure are key factors shaping the future market landscape. Opportunities exist for companies specializing in sustainable solutions and advanced fleet management technologies to capture significant market share in the coming years.
US TANKER TRUCK MARKET Segmentation
-
1. Capacity
- 1.1. Less Than 1, 000 Gallons
- 1.2. Between 1, 000 Gallons and 4, 000 Gallons
- 1.3. More Than 4, 000 Gallons
-
2. Sector Type
- 2.1. Oil and Gas Industry
- 2.2. Food Sector
- 2.3. Healthcare Sector
- 2.4. Water Treatment Facilities
- 2.5. Chemical Industry
- 2.6. Construction
- 2.7. Waste Management
- 2.8. Other Sectors
US TANKER TRUCK MARKET Segmentation By Geography
-
1. North America
- 1.1. United States
- 1.2. Canada
- 1.3. Mexico
-
2. South America
- 2.1. Brazil
- 2.2. Argentina
- 2.3. Rest of South America
-
3. Europe
- 3.1. United Kingdom
- 3.2. Germany
- 3.3. France
- 3.4. Italy
- 3.5. Spain
- 3.6. Russia
- 3.7. Benelux
- 3.8. Nordics
- 3.9. Rest of Europe
-
4. Middle East & Africa
- 4.1. Turkey
- 4.2. Israel
- 4.3. GCC
- 4.4. North Africa
- 4.5. South Africa
- 4.6. Rest of Middle East & Africa
-
5. Asia Pacific
- 5.1. China
- 5.2. India
- 5.3. Japan
- 5.4. South Korea
- 5.5. ASEAN
- 5.6. Oceania
- 5.7. Rest of Asia Pacific
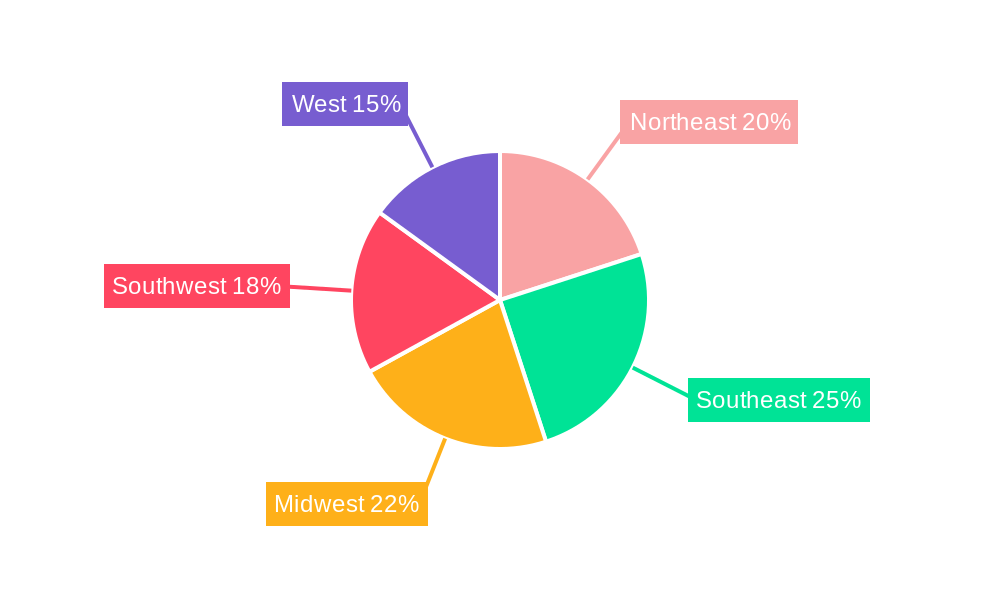
US TANKER TRUCK MARKET Regional Market Share
Geographic Coverage of US TANKER TRUCK MARKET
US TANKER TRUCK MARKET REPORT HIGHLIGHTS
| Aspects | Details |
|---|---|
| Study Period | 2020-2034 |
| Base Year | 2025 |
| Estimated Year | 2026 |
| Forecast Period | 2026-2034 |
| Historical Period | 2020-2025 |
| Growth Rate | CAGR of 5.03% from 2020-2034 |
| Segmentation |
|
Table of Contents
- 1. Introduction
- 1.1. Research Scope
- 1.2. Market Segmentation
- 1.3. Research Objective
- 1.4. Definitions and Assumptions
- 2. Executive Summary
- 2.1. Market Snapshot
- 3. Market Dynamics
- 3.1. Market Drivers
- 3.2. Market Restrains
- 3.3. Market Trends
- 3.4. Market Opportunities
- 4. Market Factor Analysis
- 4.1. Porters Five Forces
- 4.1.1. Bargaining Power of Suppliers
- 4.1.2. Bargaining Power of Buyers
- 4.1.3. Threat of New Entrants
- 4.1.4. Threat of Substitutes
- 4.1.5. Competitive Rivalry
- 4.2. PESTEL analysis
- 4.3. BCG Analysis
- 4.3.1. Stars (High Growth, High Market Share)
- 4.3.2. Cash Cows (Low Growth, High Market Share)
- 4.3.3. Question Mark (High Growth, Low Market Share)
- 4.3.4. Dogs (Low Growth, Low Market Share)
- 4.4. Ansoff Matrix Analysis
- 4.5. Supply Chain Analysis
- 4.6. Regulatory Landscape
- 4.7. Current Market Potential and Opportunity Assessment (TAM–SAM–SOM Framework)
- 4.8. IMR Analyst Note
- 4.1. Porters Five Forces
- 5. Market Analysis, Insights and Forecast 2021-2033
- 5.1. Market Analysis, Insights and Forecast - by Capacity
- 5.1.1. Less Than 1, 000 Gallons
- 5.1.2. Between 1, 000 Gallons and 4, 000 Gallons
- 5.1.3. More Than 4, 000 Gallons
- 5.2. Market Analysis, Insights and Forecast - by Sector Type
- 5.2.1. Oil and Gas Industry
- 5.2.2. Food Sector
- 5.2.3. Healthcare Sector
- 5.2.4. Water Treatment Facilities
- 5.2.5. Chemical Industry
- 5.2.6. Construction
- 5.2.7. Waste Management
- 5.2.8. Other Sectors
- 5.3. Market Analysis, Insights and Forecast - by Region
- 5.3.1. North America
- 5.3.2. South America
- 5.3.3. Europe
- 5.3.4. Middle East & Africa
- 5.3.5. Asia Pacific
- 5.1. Market Analysis, Insights and Forecast - by Capacity
- 6. Global US TANKER TRUCK MARKET Analysis, Insights and Forecast, 2021-2033
- 6.1. Market Analysis, Insights and Forecast - by Capacity
- 6.1.1. Less Than 1, 000 Gallons
- 6.1.2. Between 1, 000 Gallons and 4, 000 Gallons
- 6.1.3. More Than 4, 000 Gallons
- 6.2. Market Analysis, Insights and Forecast - by Sector Type
- 6.2.1. Oil and Gas Industry
- 6.2.2. Food Sector
- 6.2.3. Healthcare Sector
- 6.2.4. Water Treatment Facilities
- 6.2.5. Chemical Industry
- 6.2.6. Construction
- 6.2.7. Waste Management
- 6.2.8. Other Sectors
- 6.1. Market Analysis, Insights and Forecast - by Capacity
- 7. North America US TANKER TRUCK MARKET Analysis, Insights and Forecast, 2020-2032
- 7.1. Market Analysis, Insights and Forecast - by Capacity
- 7.1.1. Less Than 1, 000 Gallons
- 7.1.2. Between 1, 000 Gallons and 4, 000 Gallons
- 7.1.3. More Than 4, 000 Gallons
- 7.2. Market Analysis, Insights and Forecast - by Sector Type
- 7.2.1. Oil and Gas Industry
- 7.2.2. Food Sector
- 7.2.3. Healthcare Sector
- 7.2.4. Water Treatment Facilities
- 7.2.5. Chemical Industry
- 7.2.6. Construction
- 7.2.7. Waste Management
- 7.2.8. Other Sectors
- 7.1. Market Analysis, Insights and Forecast - by Capacity
- 8. South America US TANKER TRUCK MARKET Analysis, Insights and Forecast, 2020-2032
- 8.1. Market Analysis, Insights and Forecast - by Capacity
- 8.1.1. Less Than 1, 000 Gallons
- 8.1.2. Between 1, 000 Gallons and 4, 000 Gallons
- 8.1.3. More Than 4, 000 Gallons
- 8.2. Market Analysis, Insights and Forecast - by Sector Type
- 8.2.1. Oil and Gas Industry
- 8.2.2. Food Sector
- 8.2.3. Healthcare Sector
- 8.2.4. Water Treatment Facilities
- 8.2.5. Chemical Industry
- 8.2.6. Construction
- 8.2.7. Waste Management
- 8.2.8. Other Sectors
- 8.1. Market Analysis, Insights and Forecast - by Capacity
- 9. Europe US TANKER TRUCK MARKET Analysis, Insights and Forecast, 2020-2032
- 9.1. Market Analysis, Insights and Forecast - by Capacity
- 9.1.1. Less Than 1, 000 Gallons
- 9.1.2. Between 1, 000 Gallons and 4, 000 Gallons
- 9.1.3. More Than 4, 000 Gallons
- 9.2. Market Analysis, Insights and Forecast - by Sector Type
- 9.2.1. Oil and Gas Industry
- 9.2.2. Food Sector
- 9.2.3. Healthcare Sector
- 9.2.4. Water Treatment Facilities
- 9.2.5. Chemical Industry
- 9.2.6. Construction
- 9.2.7. Waste Management
- 9.2.8. Other Sectors
- 9.1. Market Analysis, Insights and Forecast - by Capacity
- 10. Middle East & Africa US TANKER TRUCK MARKET Analysis, Insights and Forecast, 2020-2032
- 10.1. Market Analysis, Insights and Forecast - by Capacity
- 10.1.1. Less Than 1, 000 Gallons
- 10.1.2. Between 1, 000 Gallons and 4, 000 Gallons
- 10.1.3. More Than 4, 000 Gallons
- 10.2. Market Analysis, Insights and Forecast - by Sector Type
- 10.2.1. Oil and Gas Industry
- 10.2.2. Food Sector
- 10.2.3. Healthcare Sector
- 10.2.4. Water Treatment Facilities
- 10.2.5. Chemical Industry
- 10.2.6. Construction
- 10.2.7. Waste Management
- 10.2.8. Other Sectors
- 10.1. Market Analysis, Insights and Forecast - by Capacity
- 11. Asia Pacific US TANKER TRUCK MARKET Analysis, Insights and Forecast, 2020-2032
- 11.1. Market Analysis, Insights and Forecast - by Capacity
- 11.1.1. Less Than 1, 000 Gallons
- 11.1.2. Between 1, 000 Gallons and 4, 000 Gallons
- 11.1.3. More Than 4, 000 Gallons
- 11.2. Market Analysis, Insights and Forecast - by Sector Type
- 11.2.1. Oil and Gas Industry
- 11.2.2. Food Sector
- 11.2.3. Healthcare Sector
- 11.2.4. Water Treatment Facilities
- 11.2.5. Chemical Industry
- 11.2.6. Construction
- 11.2.7. Waste Management
- 11.2.8. Other Sectors
- 11.1. Market Analysis, Insights and Forecast - by Capacity
- 12. Competitive Analysis
- 12.1. Company Profiles
- 12.1.1 Freightliner Trucks
- 12.1.1.1. Company Overview
- 12.1.1.2. Products
- 12.1.1.3. Company Financials
- 12.1.1.4. SWOT Analysis
- 12.1.2 Iveco
- 12.1.2.1. Company Overview
- 12.1.2.2. Products
- 12.1.2.3. Company Financials
- 12.1.2.4. SWOT Analysis
- 12.1.3 Scania AB
- 12.1.3.1. Company Overview
- 12.1.3.2. Products
- 12.1.3.3. Company Financials
- 12.1.3.4. SWOT Analysis
- 12.1.4 Daimler AG
- 12.1.4.1. Company Overview
- 12.1.4.2. Products
- 12.1.4.3. Company Financials
- 12.1.4.4. SWOT Analysis
- 12.1.5 Tata Motors Limited
- 12.1.5.1. Company Overview
- 12.1.5.2. Products
- 12.1.5.3. Company Financials
- 12.1.5.4. SWOT Analysis
- 12.1.6 Volvo Group
- 12.1.6.1. Company Overview
- 12.1.6.2. Products
- 12.1.6.3. Company Financials
- 12.1.6.4. SWOT Analysis
- 12.1.7 Navistar International Corporation
- 12.1.7.1. Company Overview
- 12.1.7.2. Products
- 12.1.7.3. Company Financials
- 12.1.7.4. SWOT Analysis
- 12.1.8 Hyundai Motor Company
- 12.1.8.1. Company Overview
- 12.1.8.2. Products
- 12.1.8.3. Company Financials
- 12.1.8.4. SWOT Analysis
- 12.1.9 Polar Tank Trailer*List Not Exhaustive
- 12.1.9.1. Company Overview
- 12.1.9.2. Products
- 12.1.9.3. Company Financials
- 12.1.9.4. SWOT Analysis
- 12.1.10 Kenworth
- 12.1.10.1. Company Overview
- 12.1.10.2. Products
- 12.1.10.3. Company Financials
- 12.1.10.4. SWOT Analysis
- 12.1.11 MAN Truck & Bus AG
- 12.1.11.1. Company Overview
- 12.1.11.2. Products
- 12.1.11.3. Company Financials
- 12.1.11.4. SWOT Analysis
- 12.1.1 Freightliner Trucks
- 12.2. Market Entropy
- 12.2.1 Company's Key Areas Served
- 12.2.2 Recent Developments
- 12.3. Company Market Share Analysis 2025
- 12.3.1 Top 5 Companies Market Share Analysis
- 12.3.2 Top 3 Companies Market Share Analysis
- 12.4. List of Potential Customers
- 13. Research Methodology
List of Figures
- Figure 1: Global US TANKER TRUCK MARKET Revenue Breakdown (Million, %) by Region 2025 & 2033
- Figure 2: North America US TANKER TRUCK MARKET Revenue (Million), by Capacity 2025 & 2033
- Figure 3: North America US TANKER TRUCK MARKET Revenue Share (%), by Capacity 2025 & 2033
- Figure 4: North America US TANKER TRUCK MARKET Revenue (Million), by Sector Type 2025 & 2033
- Figure 5: North America US TANKER TRUCK MARKET Revenue Share (%), by Sector Type 2025 & 2033
- Figure 6: North America US TANKER TRUCK MARKET Revenue (Million), by Country 2025 & 2033
- Figure 7: North America US TANKER TRUCK MARKET Revenue Share (%), by Country 2025 & 2033
- Figure 8: South America US TANKER TRUCK MARKET Revenue (Million), by Capacity 2025 & 2033
- Figure 9: South America US TANKER TRUCK MARKET Revenue Share (%), by Capacity 2025 & 2033
- Figure 10: South America US TANKER TRUCK MARKET Revenue (Million), by Sector Type 2025 & 2033
- Figure 11: South America US TANKER TRUCK MARKET Revenue Share (%), by Sector Type 2025 & 2033
- Figure 12: South America US TANKER TRUCK MARKET Revenue (Million), by Country 2025 & 2033
- Figure 13: South America US TANKER TRUCK MARKET Revenue Share (%), by Country 2025 & 2033
- Figure 14: Europe US TANKER TRUCK MARKET Revenue (Million), by Capacity 2025 & 2033
- Figure 15: Europe US TANKER TRUCK MARKET Revenue Share (%), by Capacity 2025 & 2033
- Figure 16: Europe US TANKER TRUCK MARKET Revenue (Million), by Sector Type 2025 & 2033
- Figure 17: Europe US TANKER TRUCK MARKET Revenue Share (%), by Sector Type 2025 & 2033
- Figure 18: Europe US TANKER TRUCK MARKET Revenue (Million), by Country 2025 & 2033
- Figure 19: Europe US TANKER TRUCK MARKET Revenue Share (%), by Country 2025 & 2033
- Figure 20: Middle East & Africa US TANKER TRUCK MARKET Revenue (Million), by Capacity 2025 & 2033
- Figure 21: Middle East & Africa US TANKER TRUCK MARKET Revenue Share (%), by Capacity 2025 & 2033
- Figure 22: Middle East & Africa US TANKER TRUCK MARKET Revenue (Million), by Sector Type 2025 & 2033
- Figure 23: Middle East & Africa US TANKER TRUCK MARKET Revenue Share (%), by Sector Type 2025 & 2033
- Figure 24: Middle East & Africa US TANKER TRUCK MARKET Revenue (Million), by Country 2025 & 2033
- Figure 25: Middle East & Africa US TANKER TRUCK MARKET Revenue Share (%), by Country 2025 & 2033
- Figure 26: Asia Pacific US TANKER TRUCK MARKET Revenue (Million), by Capacity 2025 & 2033
- Figure 27: Asia Pacific US TANKER TRUCK MARKET Revenue Share (%), by Capacity 2025 & 2033
- Figure 28: Asia Pacific US TANKER TRUCK MARKET Revenue (Million), by Sector Type 2025 & 2033
- Figure 29: Asia Pacific US TANKER TRUCK MARKET Revenue Share (%), by Sector Type 2025 & 2033
- Figure 30: Asia Pacific US TANKER TRUCK MARKET Revenue (Million), by Country 2025 & 2033
- Figure 31: Asia Pacific US TANKER TRUCK MARKET Revenue Share (%), by Country 2025 & 2033
List of Tables
- Table 1: Global US TANKER TRUCK MARKET Revenue Million Forecast, by Capacity 2020 & 2033
- Table 2: Global US TANKER TRUCK MARKET Revenue Million Forecast, by Sector Type 2020 & 2033
- Table 3: Global US TANKER TRUCK MARKET Revenue Million Forecast, by Region 2020 & 2033
- Table 4: Global US TANKER TRUCK MARKET Revenue Million Forecast, by Capacity 2020 & 2033
- Table 5: Global US TANKER TRUCK MARKET Revenue Million Forecast, by Sector Type 2020 & 2033
- Table 6: Global US TANKER TRUCK MARKET Revenue Million Forecast, by Country 2020 & 2033
- Table 7: United States US TANKER TRUCK MARKET Revenue (Million) Forecast, by Application 2020 & 2033
- Table 8: Canada US TANKER TRUCK MARKET Revenue (Million) Forecast, by Application 2020 & 2033
- Table 9: Mexico US TANKER TRUCK MARKET Revenue (Million) Forecast, by Application 2020 & 2033
- Table 10: Global US TANKER TRUCK MARKET Revenue Million Forecast, by Capacity 2020 & 2033
- Table 11: Global US TANKER TRUCK MARKET Revenue Million Forecast, by Sector Type 2020 & 2033
- Table 12: Global US TANKER TRUCK MARKET Revenue Million Forecast, by Country 2020 & 2033
- Table 13: Brazil US TANKER TRUCK MARKET Revenue (Million) Forecast, by Application 2020 & 2033
- Table 14: Argentina US TANKER TRUCK MARKET Revenue (Million) Forecast, by Application 2020 & 2033
- Table 15: Rest of South America US TANKER TRUCK MARKET Revenue (Million) Forecast, by Application 2020 & 2033
- Table 16: Global US TANKER TRUCK MARKET Revenue Million Forecast, by Capacity 2020 & 2033
- Table 17: Global US TANKER TRUCK MARKET Revenue Million Forecast, by Sector Type 2020 & 2033
- Table 18: Global US TANKER TRUCK MARKET Revenue Million Forecast, by Country 2020 & 2033
- Table 19: United Kingdom US TANKER TRUCK MARKET Revenue (Million) Forecast, by Application 2020 & 2033
- Table 20: Germany US TANKER TRUCK MARKET Revenue (Million) Forecast, by Application 2020 & 2033
- Table 21: France US TANKER TRUCK MARKET Revenue (Million) Forecast, by Application 2020 & 2033
- Table 22: Italy US TANKER TRUCK MARKET Revenue (Million) Forecast, by Application 2020 & 2033
- Table 23: Spain US TANKER TRUCK MARKET Revenue (Million) Forecast, by Application 2020 & 2033
- Table 24: Russia US TANKER TRUCK MARKET Revenue (Million) Forecast, by Application 2020 & 2033
- Table 25: Benelux US TANKER TRUCK MARKET Revenue (Million) Forecast, by Application 2020 & 2033
- Table 26: Nordics US TANKER TRUCK MARKET Revenue (Million) Forecast, by Application 2020 & 2033
- Table 27: Rest of Europe US TANKER TRUCK MARKET Revenue (Million) Forecast, by Application 2020 & 2033
- Table 28: Global US TANKER TRUCK MARKET Revenue Million Forecast, by Capacity 2020 & 2033
- Table 29: Global US TANKER TRUCK MARKET Revenue Million Forecast, by Sector Type 2020 & 2033
- Table 30: Global US TANKER TRUCK MARKET Revenue Million Forecast, by Country 2020 & 2033
- Table 31: Turkey US TANKER TRUCK MARKET Revenue (Million) Forecast, by Application 2020 & 2033
- Table 32: Israel US TANKER TRUCK MARKET Revenue (Million) Forecast, by Application 2020 & 2033
- Table 33: GCC US TANKER TRUCK MARKET Revenue (Million) Forecast, by Application 2020 & 2033
- Table 34: North Africa US TANKER TRUCK MARKET Revenue (Million) Forecast, by Application 2020 & 2033
- Table 35: South Africa US TANKER TRUCK MARKET Revenue (Million) Forecast, by Application 2020 & 2033
- Table 36: Rest of Middle East & Africa US TANKER TRUCK MARKET Revenue (Million) Forecast, by Application 2020 & 2033
- Table 37: Global US TANKER TRUCK MARKET Revenue Million Forecast, by Capacity 2020 & 2033
- Table 38: Global US TANKER TRUCK MARKET Revenue Million Forecast, by Sector Type 2020 & 2033
- Table 39: Global US TANKER TRUCK MARKET Revenue Million Forecast, by Country 2020 & 2033
- Table 40: China US TANKER TRUCK MARKET Revenue (Million) Forecast, by Application 2020 & 2033
- Table 41: India US TANKER TRUCK MARKET Revenue (Million) Forecast, by Application 2020 & 2033
- Table 42: Japan US TANKER TRUCK MARKET Revenue (Million) Forecast, by Application 2020 & 2033
- Table 43: South Korea US TANKER TRUCK MARKET Revenue (Million) Forecast, by Application 2020 & 2033
- Table 44: ASEAN US TANKER TRUCK MARKET Revenue (Million) Forecast, by Application 2020 & 2033
- Table 45: Oceania US TANKER TRUCK MARKET Revenue (Million) Forecast, by Application 2020 & 2033
- Table 46: Rest of Asia Pacific US TANKER TRUCK MARKET Revenue (Million) Forecast, by Application 2020 & 2033
Frequently Asked Questions
1. What is the projected Compound Annual Growth Rate (CAGR) of the US TANKER TRUCK MARKET?
The projected CAGR is approximately 5.03%.
2. Which companies are prominent players in the US TANKER TRUCK MARKET?
Key companies in the market include Freightliner Trucks, Iveco, Scania AB, Daimler AG, Tata Motors Limited, Volvo Group, Navistar International Corporation, Hyundai Motor Company, Polar Tank Trailer*List Not Exhaustive, Kenworth, MAN Truck & Bus AG.
3. What are the main segments of the US TANKER TRUCK MARKET?
The market segments include Capacity, Sector Type.
4. Can you provide details about the market size?
The market size is estimated to be USD 26.74 Million as of 2022.
5. What are some drivers contributing to market growth?
Increased Vehicle Sales to Fuel Market Growth.
6. What are the notable trends driving market growth?
Between 1. 000 Gallons and 4. 000 Gallons Tanker Truck is Dominating the Market.
7. Are there any restraints impacting market growth?
N/A
8. Can you provide examples of recent developments in the market?
In December 2023, Trina Solar, a provider of intelligent solar solutions, introduced its latest lineup of Trina-branded trucks to transport photovoltaic (PV) modules for large-scale solar projects across the United States.
9. What pricing options are available for accessing the report?
Pricing options include single-user, multi-user, and enterprise licenses priced at USD 3800, USD 4500, and USD 5800 respectively.
10. Is the market size provided in terms of value or volume?
The market size is provided in terms of value, measured in Million.
11. Are there any specific market keywords associated with the report?
Yes, the market keyword associated with the report is "US TANKER TRUCK MARKET," which aids in identifying and referencing the specific market segment covered.
12. How do I determine which pricing option suits my needs best?
The pricing options vary based on user requirements and access needs. Individual users may opt for single-user licenses, while businesses requiring broader access may choose multi-user or enterprise licenses for cost-effective access to the report.
13. Are there any additional resources or data provided in the US TANKER TRUCK MARKET report?
While the report offers comprehensive insights, it's advisable to review the specific contents or supplementary materials provided to ascertain if additional resources or data are available.
14. How can I stay updated on further developments or reports in the US TANKER TRUCK MARKET?
To stay informed about further developments, trends, and reports in the US TANKER TRUCK MARKET, consider subscribing to industry newsletters, following relevant companies and organizations, or regularly checking reputable industry news sources and publications.
Methodology
Step 1 - Identification of Relevant Samples Size from Population Database


Step 2 - Approaches for Defining Global Market Size (Value, Volume* & Price*)

Note*: In applicable scenarios
Step 3 - Data Sources
Primary Research
- Web Analytics
- Survey Reports
- Research Institute
- Latest Research Reports
- Opinion Leaders
Secondary Research
- Annual Reports
- White Paper
- Latest Press Release
- Industry Association
- Paid Database
- Investor Presentations

Step 4 - Data Triangulation
Involves using different sources of information in order to increase the validity of a study
These sources are likely to be stakeholders in a program - participants, other researchers, program staff, other community members, and so on.
Then we put all data in single framework & apply various statistical tools to find out the dynamic on the market.
During the analysis stage, feedback from the stakeholder groups would be compared to determine areas of agreement as well as areas of divergence