

Key Insights
The global vehicle chassis component market is poised for significant expansion, driven by escalating vehicle demand worldwide, particularly in emerging economies. Key growth catalysts include the widespread adoption of Advanced Driver-Assistance Systems (ADAS) and a growing consumer preference for lightweight vehicles to enhance fuel efficiency. Innovations in materials science are concurrently enabling the development of more robust, lighter, and cost-effective chassis solutions. The automotive industry's transition to Electric Vehicles (EVs) presents a dynamic landscape, fostering demand for novel chassis designs and components. Furthermore, stringent global emission regulations are accelerating the adoption of sustainable and efficient technologies, bolstering market growth. The competitive environment features established manufacturers and emerging players engaged in strategic collaborations to advance technological capabilities and broaden market penetration. Leading companies are prioritizing R&D investments to elevate the performance, safety, and longevity of chassis components.
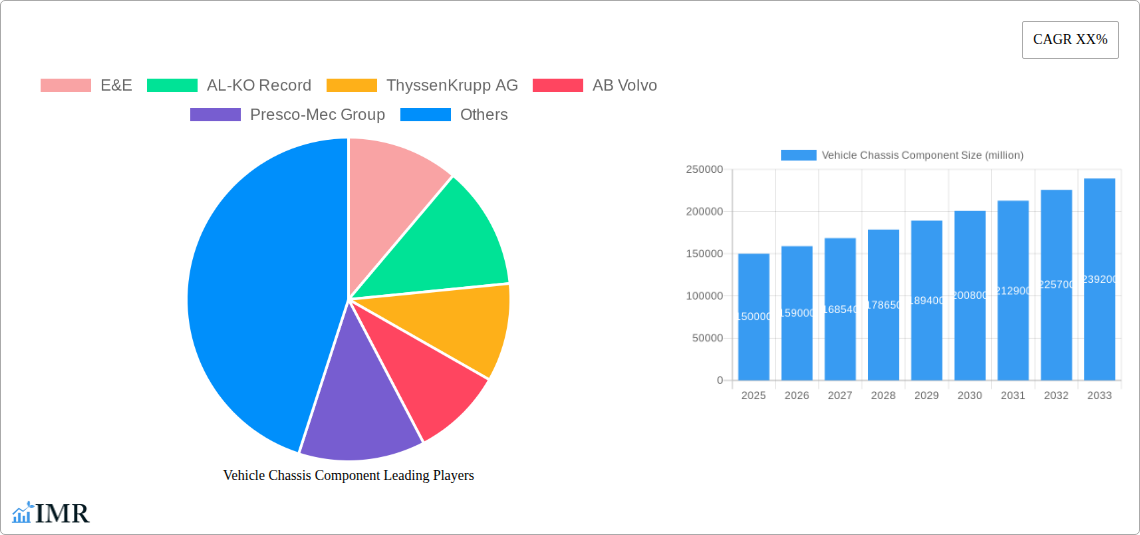
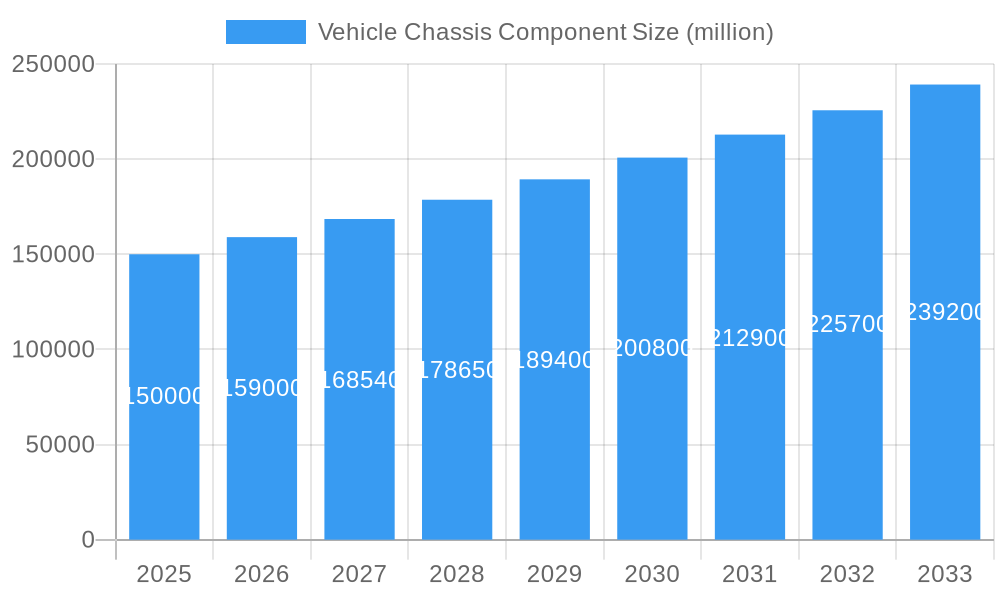
Vehicle Chassis Component Market Size (In Billion)
While the market demonstrates a strong growth outlook, it is not without its hurdles. Volatile raw material prices, especially for steel and aluminum, can impact production expenses and profitability. Persistent global semiconductor shortages continue to disrupt vehicle and component manufacturing. Additionally, rising labor costs and rigorous regulatory compliance requirements pose ongoing challenges. However, these obstacles are anticipated to be mitigated by sustained long-term growth drivers, ensuring continued expansion of the vehicle chassis component market throughout the forecast period. The market is segmented by component type, vehicle type, and geographical region, with distinct growth patterns observed across these segments.
Vehicle Chassis Component Company Market Share
Vehicle Chassis Component Market Report: 2019-2033
This comprehensive report provides a detailed analysis of the global Vehicle Chassis Component market, encompassing its dynamics, growth trends, regional dominance, product landscape, and key players. The study period spans from 2019 to 2033, with 2025 serving as the base and estimated year. The report leverages extensive market research to offer actionable insights for industry professionals, investors, and stakeholders seeking to navigate this dynamic sector. Market values are presented in million units.
Vehicle Chassis Component Market Dynamics & Structure
The global Vehicle Chassis Component market, valued at xx million units in 2025, is characterized by a moderately concentrated structure with several key players holding significant market share. Technological innovation, driven by the demand for lighter, stronger, and more efficient chassis components, is a key driver. Stringent regulatory frameworks concerning vehicle safety and emissions are shaping design and manufacturing processes. The rise of electric vehicles (EVs) and autonomous driving technologies presents both opportunities and challenges, necessitating the development of specialized chassis components. Competitive substitutes, such as advanced composite materials, are emerging, impacting the market share of traditional materials. The market exhibits diverse end-user demographics, spanning passenger cars, commercial vehicles, and off-highway vehicles. M&A activity in the sector has been moderate, with xx major deals recorded during the historical period (2019-2024), largely focused on consolidating market presence and acquiring specialized technologies.
- Market Concentration: Moderately concentrated, with top 5 players holding approximately xx% market share in 2025.
- Technological Innovation: Focus on lightweighting, high-strength materials (e.g., advanced high-strength steels, aluminum alloys, composites), and smart chassis technologies.
- Regulatory Landscape: Stringent safety and emission standards are driving the adoption of advanced materials and manufacturing processes.
- Competitive Substitutes: Growing adoption of composite materials and alternative materials poses a challenge to traditional steel and aluminum components.
- End-User Demographics: Diverse, encompassing passenger cars, commercial vehicles (heavy-duty trucks, buses), and off-highway vehicles (construction, agriculture).
- M&A Trends: Moderate activity, primarily driven by consolidation and technology acquisition; xx major deals between 2019-2024. Innovation barriers include high R&D costs and the need for rigorous testing and certification.
Vehicle Chassis Component Growth Trends & Insights
The global Vehicle Chassis Component market exhibited a CAGR of xx% during the historical period (2019-2024), reaching xx million units in 2024. This growth is primarily attributed to the increasing global vehicle production, particularly in developing economies. The rising demand for passenger vehicles and commercial vehicles, fueled by economic growth and urbanization, has significantly contributed to market expansion. Technological advancements, such as the adoption of lightweight materials and advanced manufacturing techniques, have improved component performance and efficiency. The shift towards electric and autonomous vehicles is expected to accelerate market growth in the forecast period (2025-2033), albeit with some initial challenges related to component design and integration. Consumer preferences for improved vehicle safety, fuel efficiency, and comfort are also driving demand for advanced chassis components. The market penetration of advanced materials is projected to increase from xx% in 2025 to xx% by 2033. The projected CAGR for the forecast period (2025-2033) is xx%.
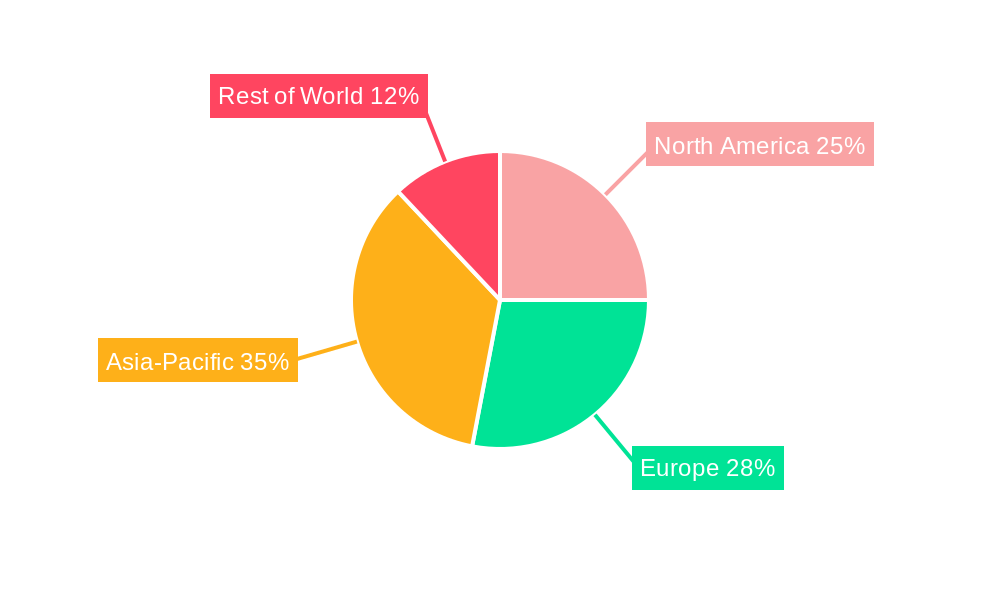
Dominant Regions, Countries, or Segments in Vehicle Chassis Component
The Asia-Pacific region is expected to dominate the global Vehicle Chassis Component market during the forecast period, driven by robust vehicle production growth in countries like China and India. The region benefits from a large and expanding automotive industry, supportive government policies, and a growing middle class with increased purchasing power. Europe and North America also hold significant market shares, driven by technological advancements and stringent emission regulations. The commercial vehicle segment is projected to experience faster growth compared to the passenger vehicle segment, driven by the increasing demand for freight transportation and logistics services.
- Key Drivers in Asia-Pacific:
- Rapid growth of the automotive industry.
- Increasing vehicle production in China and India.
- Supportive government policies promoting automotive manufacturing.
- Growing middle class with rising disposable income.
- Key Drivers in Europe:
- Stringent emission regulations.
- Technological advancements in automotive manufacturing.
- Focus on fuel efficiency and safety.
- Key Drivers in North America:
- Strong demand for light-duty trucks and SUVs.
- Growing adoption of advanced driver-assistance systems.
- Increasing investment in automotive R&D.
Vehicle Chassis Component Product Landscape
The Vehicle Chassis Component market encompasses a diverse range of products, including frames, axles, suspensions, steering systems, and braking systems. Recent innovations focus on lightweighting through advanced materials like aluminum alloys and composites, improving fuel efficiency and vehicle performance. Advanced manufacturing techniques, such as additive manufacturing (3D printing) and high-strength steel forming, are enhancing component strength and durability. Unique selling propositions include improved safety features, reduced weight, enhanced fuel efficiency, and superior durability. The integration of smart sensors and actuators is enabling the development of intelligent chassis systems that enhance vehicle handling and stability.
Key Drivers, Barriers & Challenges in Vehicle Chassis Component
Key Drivers:
The increasing demand for vehicles globally, advancements in lightweight materials, stringent safety and emission regulations, and the growing adoption of advanced driver-assistance systems (ADAS) are key drivers of market growth. Government incentives for electric vehicles and fuel-efficient technologies also contribute to the market's expansion.
Challenges & Restraints:
Fluctuations in raw material prices, supply chain disruptions, and intense competition among component manufacturers pose significant challenges. The high cost of research and development for new materials and technologies is a major barrier to innovation. Strict regulatory compliance requirements and the need for rigorous testing and certification also increase the cost of product development and launch. The shift towards electric vehicles necessitates significant changes in chassis design and component specifications, leading to potential short-term disruptions.
Emerging Opportunities in Vehicle Chassis Component
Emerging opportunities lie in the development of lightweight chassis components for electric vehicles, the integration of advanced sensor technologies for autonomous driving, and the increasing demand for customized chassis solutions for niche vehicle segments (e.g., off-highway vehicles, specialized commercial vehicles). Untapped markets in developing economies present significant growth potential. The adoption of sustainable materials and manufacturing processes offers opportunities for environmentally conscious manufacturers.
Growth Accelerators in the Vehicle Chassis Component Industry
Long-term growth will be accelerated by technological breakthroughs in materials science, leading to lighter and stronger components. Strategic partnerships between component manufacturers and automotive OEMs will enhance collaboration and innovation. Expansion into emerging markets and the adoption of advanced manufacturing techniques will further stimulate market growth.
Key Players Shaping the Vehicle Chassis Component Market
- E&E
- AL-KO Record
- ThyssenKrupp AG
- AB Volvo
- Presco-Mec Group
- Elgin Industries
- Aichi Forge
- Bharat Forge
- Caparo
- JAS Motorsport
- Pressmark Pressings
- IBEF
- Y-TEC CORPORATION
- HÖRMANN Automotive
Notable Milestones in Vehicle Chassis Component Sector
- 2020: Introduction of a new lightweight aluminum chassis component by Company X.
- 2021: Merger of two major component manufacturers, resulting in increased market share.
- 2022: Launch of a new generation of smart chassis systems integrating advanced sensor technologies.
- 2023: Significant investment in R&D for advanced materials and manufacturing processes.
- 2024: Adoption of a new industry standard for chassis component testing and certification.
In-Depth Vehicle Chassis Component Market Outlook
The Vehicle Chassis Component market is poised for sustained growth over the forecast period, driven by the ongoing expansion of the automotive industry, technological advancements, and the increasing demand for fuel-efficient and safe vehicles. Strategic investments in R&D, the adoption of sustainable materials, and the development of innovative chassis technologies will create significant opportunities for market participants. The market's future success hinges on adapting to the evolving needs of electric and autonomous vehicles and addressing the challenges posed by supply chain disruptions and regulatory changes.
Vehicle Chassis Component Segmentation
-
1. Application
- 1.1. Passenger Vehicle
- 1.2. Commercial Vehicle
-
2. Types
- 2.1. Track Rollers/Load Rollers
- 2.2. Crawler Chain
- 2.3. Idler and Sprocket
- 2.4. Track Shoes/Rubber Track
- 2.5. Other Components (Bushings, Seals)
Vehicle Chassis Component Segmentation By Geography
-
1. North America
- 1.1. United States
- 1.2. Canada
- 1.3. Mexico
-
2. South America
- 2.1. Brazil
- 2.2. Argentina
- 2.3. Rest of South America
-
3. Europe
- 3.1. United Kingdom
- 3.2. Germany
- 3.3. France
- 3.4. Italy
- 3.5. Spain
- 3.6. Russia
- 3.7. Benelux
- 3.8. Nordics
- 3.9. Rest of Europe
-
4. Middle East & Africa
- 4.1. Turkey
- 4.2. Israel
- 4.3. GCC
- 4.4. North Africa
- 4.5. South Africa
- 4.6. Rest of Middle East & Africa
-
5. Asia Pacific
- 5.1. China
- 5.2. India
- 5.3. Japan
- 5.4. South Korea
- 5.5. ASEAN
- 5.6. Oceania
- 5.7. Rest of Asia Pacific
Vehicle Chassis Component Regional Market Share
Geographic Coverage of Vehicle Chassis Component
Vehicle Chassis Component REPORT HIGHLIGHTS
| Aspects | Details |
|---|---|
| Study Period | 2020-2034 |
| Base Year | 2025 |
| Estimated Year | 2026 |
| Forecast Period | 2026-2034 |
| Historical Period | 2020-2025 |
| Growth Rate | CAGR of 10% from 2020-2034 |
| Segmentation |
|
Table of Contents
- 1. Introduction
- 1.1. Research Scope
- 1.2. Market Segmentation
- 1.3. Research Objective
- 1.4. Definitions and Assumptions
- 2. Executive Summary
- 2.1. Market Snapshot
- 3. Market Dynamics
- 3.1. Market Drivers
- 3.2. Market Restrains
- 3.3. Market Trends
- 3.4. Market Opportunities
- 4. Market Factor Analysis
- 4.1. Porters Five Forces
- 4.1.1. Bargaining Power of Suppliers
- 4.1.2. Bargaining Power of Buyers
- 4.1.3. Threat of New Entrants
- 4.1.4. Threat of Substitutes
- 4.1.5. Competitive Rivalry
- 4.2. PESTEL analysis
- 4.3. BCG Analysis
- 4.3.1. Stars (High Growth, High Market Share)
- 4.3.2. Cash Cows (Low Growth, High Market Share)
- 4.3.3. Question Mark (High Growth, Low Market Share)
- 4.3.4. Dogs (Low Growth, Low Market Share)
- 4.4. Ansoff Matrix Analysis
- 4.5. Supply Chain Analysis
- 4.6. Regulatory Landscape
- 4.7. Current Market Potential and Opportunity Assessment (TAM–SAM–SOM Framework)
- 4.8. IMR Analyst Note
- 4.1. Porters Five Forces
- 5. Market Analysis, Insights and Forecast 2021-2033
- 5.1. Market Analysis, Insights and Forecast - by Application
- 5.1.1. Passenger Vehicle
- 5.1.2. Commercial Vehicle
- 5.2. Market Analysis, Insights and Forecast - by Types
- 5.2.1. Track Rollers/Load Rollers
- 5.2.2. Crawler Chain
- 5.2.3. Idler and Sprocket
- 5.2.4. Track Shoes/Rubber Track
- 5.2.5. Other Components (Bushings, Seals)
- 5.3. Market Analysis, Insights and Forecast - by Region
- 5.3.1. North America
- 5.3.2. South America
- 5.3.3. Europe
- 5.3.4. Middle East & Africa
- 5.3.5. Asia Pacific
- 5.1. Market Analysis, Insights and Forecast - by Application
- 6. Global Vehicle Chassis Component Analysis, Insights and Forecast, 2021-2033
- 6.1. Market Analysis, Insights and Forecast - by Application
- 6.1.1. Passenger Vehicle
- 6.1.2. Commercial Vehicle
- 6.2. Market Analysis, Insights and Forecast - by Types
- 6.2.1. Track Rollers/Load Rollers
- 6.2.2. Crawler Chain
- 6.2.3. Idler and Sprocket
- 6.2.4. Track Shoes/Rubber Track
- 6.2.5. Other Components (Bushings, Seals)
- 6.1. Market Analysis, Insights and Forecast - by Application
- 7. North America Vehicle Chassis Component Analysis, Insights and Forecast, 2020-2032
- 7.1. Market Analysis, Insights and Forecast - by Application
- 7.1.1. Passenger Vehicle
- 7.1.2. Commercial Vehicle
- 7.2. Market Analysis, Insights and Forecast - by Types
- 7.2.1. Track Rollers/Load Rollers
- 7.2.2. Crawler Chain
- 7.2.3. Idler and Sprocket
- 7.2.4. Track Shoes/Rubber Track
- 7.2.5. Other Components (Bushings, Seals)
- 7.1. Market Analysis, Insights and Forecast - by Application
- 8. South America Vehicle Chassis Component Analysis, Insights and Forecast, 2020-2032
- 8.1. Market Analysis, Insights and Forecast - by Application
- 8.1.1. Passenger Vehicle
- 8.1.2. Commercial Vehicle
- 8.2. Market Analysis, Insights and Forecast - by Types
- 8.2.1. Track Rollers/Load Rollers
- 8.2.2. Crawler Chain
- 8.2.3. Idler and Sprocket
- 8.2.4. Track Shoes/Rubber Track
- 8.2.5. Other Components (Bushings, Seals)
- 8.1. Market Analysis, Insights and Forecast - by Application
- 9. Europe Vehicle Chassis Component Analysis, Insights and Forecast, 2020-2032
- 9.1. Market Analysis, Insights and Forecast - by Application
- 9.1.1. Passenger Vehicle
- 9.1.2. Commercial Vehicle
- 9.2. Market Analysis, Insights and Forecast - by Types
- 9.2.1. Track Rollers/Load Rollers
- 9.2.2. Crawler Chain
- 9.2.3. Idler and Sprocket
- 9.2.4. Track Shoes/Rubber Track
- 9.2.5. Other Components (Bushings, Seals)
- 9.1. Market Analysis, Insights and Forecast - by Application
- 10. Middle East & Africa Vehicle Chassis Component Analysis, Insights and Forecast, 2020-2032
- 10.1. Market Analysis, Insights and Forecast - by Application
- 10.1.1. Passenger Vehicle
- 10.1.2. Commercial Vehicle
- 10.2. Market Analysis, Insights and Forecast - by Types
- 10.2.1. Track Rollers/Load Rollers
- 10.2.2. Crawler Chain
- 10.2.3. Idler and Sprocket
- 10.2.4. Track Shoes/Rubber Track
- 10.2.5. Other Components (Bushings, Seals)
- 10.1. Market Analysis, Insights and Forecast - by Application
- 11. Asia Pacific Vehicle Chassis Component Analysis, Insights and Forecast, 2020-2032
- 11.1. Market Analysis, Insights and Forecast - by Application
- 11.1.1. Passenger Vehicle
- 11.1.2. Commercial Vehicle
- 11.2. Market Analysis, Insights and Forecast - by Types
- 11.2.1. Track Rollers/Load Rollers
- 11.2.2. Crawler Chain
- 11.2.3. Idler and Sprocket
- 11.2.4. Track Shoes/Rubber Track
- 11.2.5. Other Components (Bushings, Seals)
- 11.1. Market Analysis, Insights and Forecast - by Application
- 12. Competitive Analysis
- 12.1. Company Profiles
- 12.1.1 E&E
- 12.1.1.1. Company Overview
- 12.1.1.2. Products
- 12.1.1.3. Company Financials
- 12.1.1.4. SWOT Analysis
- 12.1.2 AL-KO Record
- 12.1.2.1. Company Overview
- 12.1.2.2. Products
- 12.1.2.3. Company Financials
- 12.1.2.4. SWOT Analysis
- 12.1.3 ThyssenKrupp AG
- 12.1.3.1. Company Overview
- 12.1.3.2. Products
- 12.1.3.3. Company Financials
- 12.1.3.4. SWOT Analysis
- 12.1.4 AB Volvo
- 12.1.4.1. Company Overview
- 12.1.4.2. Products
- 12.1.4.3. Company Financials
- 12.1.4.4. SWOT Analysis
- 12.1.5 Presco-Mec Group
- 12.1.5.1. Company Overview
- 12.1.5.2. Products
- 12.1.5.3. Company Financials
- 12.1.5.4. SWOT Analysis
- 12.1.6 Elgin Industries
- 12.1.6.1. Company Overview
- 12.1.6.2. Products
- 12.1.6.3. Company Financials
- 12.1.6.4. SWOT Analysis
- 12.1.7 Aichi Forge
- 12.1.7.1. Company Overview
- 12.1.7.2. Products
- 12.1.7.3. Company Financials
- 12.1.7.4. SWOT Analysis
- 12.1.8 Bharat Forge
- 12.1.8.1. Company Overview
- 12.1.8.2. Products
- 12.1.8.3. Company Financials
- 12.1.8.4. SWOT Analysis
- 12.1.9 Caparo
- 12.1.9.1. Company Overview
- 12.1.9.2. Products
- 12.1.9.3. Company Financials
- 12.1.9.4. SWOT Analysis
- 12.1.10 JAS Motorsport
- 12.1.10.1. Company Overview
- 12.1.10.2. Products
- 12.1.10.3. Company Financials
- 12.1.10.4. SWOT Analysis
- 12.1.11 Pressmark Pressings
- 12.1.11.1. Company Overview
- 12.1.11.2. Products
- 12.1.11.3. Company Financials
- 12.1.11.4. SWOT Analysis
- 12.1.12 IBEF
- 12.1.12.1. Company Overview
- 12.1.12.2. Products
- 12.1.12.3. Company Financials
- 12.1.12.4. SWOT Analysis
- 12.1.13 Y-TEC CORPORATION
- 12.1.13.1. Company Overview
- 12.1.13.2. Products
- 12.1.13.3. Company Financials
- 12.1.13.4. SWOT Analysis
- 12.1.14 HÖRMANN Automotive
- 12.1.14.1. Company Overview
- 12.1.14.2. Products
- 12.1.14.3. Company Financials
- 12.1.14.4. SWOT Analysis
- 12.1.1 E&E
- 12.2. Market Entropy
- 12.2.1 Company's Key Areas Served
- 12.2.2 Recent Developments
- 12.3. Company Market Share Analysis 2025
- 12.3.1 Top 5 Companies Market Share Analysis
- 12.3.2 Top 3 Companies Market Share Analysis
- 12.4. List of Potential Customers
- 13. Research Methodology
List of Figures
- Figure 1: Global Vehicle Chassis Component Revenue Breakdown (million, %) by Region 2025 & 2033
- Figure 2: Global Vehicle Chassis Component Volume Breakdown (K, %) by Region 2025 & 2033
- Figure 3: North America Vehicle Chassis Component Revenue (million), by Application 2025 & 2033
- Figure 4: North America Vehicle Chassis Component Volume (K), by Application 2025 & 2033
- Figure 5: North America Vehicle Chassis Component Revenue Share (%), by Application 2025 & 2033
- Figure 6: North America Vehicle Chassis Component Volume Share (%), by Application 2025 & 2033
- Figure 7: North America Vehicle Chassis Component Revenue (million), by Types 2025 & 2033
- Figure 8: North America Vehicle Chassis Component Volume (K), by Types 2025 & 2033
- Figure 9: North America Vehicle Chassis Component Revenue Share (%), by Types 2025 & 2033
- Figure 10: North America Vehicle Chassis Component Volume Share (%), by Types 2025 & 2033
- Figure 11: North America Vehicle Chassis Component Revenue (million), by Country 2025 & 2033
- Figure 12: North America Vehicle Chassis Component Volume (K), by Country 2025 & 2033
- Figure 13: North America Vehicle Chassis Component Revenue Share (%), by Country 2025 & 2033
- Figure 14: North America Vehicle Chassis Component Volume Share (%), by Country 2025 & 2033
- Figure 15: South America Vehicle Chassis Component Revenue (million), by Application 2025 & 2033
- Figure 16: South America Vehicle Chassis Component Volume (K), by Application 2025 & 2033
- Figure 17: South America Vehicle Chassis Component Revenue Share (%), by Application 2025 & 2033
- Figure 18: South America Vehicle Chassis Component Volume Share (%), by Application 2025 & 2033
- Figure 19: South America Vehicle Chassis Component Revenue (million), by Types 2025 & 2033
- Figure 20: South America Vehicle Chassis Component Volume (K), by Types 2025 & 2033
- Figure 21: South America Vehicle Chassis Component Revenue Share (%), by Types 2025 & 2033
- Figure 22: South America Vehicle Chassis Component Volume Share (%), by Types 2025 & 2033
- Figure 23: South America Vehicle Chassis Component Revenue (million), by Country 2025 & 2033
- Figure 24: South America Vehicle Chassis Component Volume (K), by Country 2025 & 2033
- Figure 25: South America Vehicle Chassis Component Revenue Share (%), by Country 2025 & 2033
- Figure 26: South America Vehicle Chassis Component Volume Share (%), by Country 2025 & 2033
- Figure 27: Europe Vehicle Chassis Component Revenue (million), by Application 2025 & 2033
- Figure 28: Europe Vehicle Chassis Component Volume (K), by Application 2025 & 2033
- Figure 29: Europe Vehicle Chassis Component Revenue Share (%), by Application 2025 & 2033
- Figure 30: Europe Vehicle Chassis Component Volume Share (%), by Application 2025 & 2033
- Figure 31: Europe Vehicle Chassis Component Revenue (million), by Types 2025 & 2033
- Figure 32: Europe Vehicle Chassis Component Volume (K), by Types 2025 & 2033
- Figure 33: Europe Vehicle Chassis Component Revenue Share (%), by Types 2025 & 2033
- Figure 34: Europe Vehicle Chassis Component Volume Share (%), by Types 2025 & 2033
- Figure 35: Europe Vehicle Chassis Component Revenue (million), by Country 2025 & 2033
- Figure 36: Europe Vehicle Chassis Component Volume (K), by Country 2025 & 2033
- Figure 37: Europe Vehicle Chassis Component Revenue Share (%), by Country 2025 & 2033
- Figure 38: Europe Vehicle Chassis Component Volume Share (%), by Country 2025 & 2033
- Figure 39: Middle East & Africa Vehicle Chassis Component Revenue (million), by Application 2025 & 2033
- Figure 40: Middle East & Africa Vehicle Chassis Component Volume (K), by Application 2025 & 2033
- Figure 41: Middle East & Africa Vehicle Chassis Component Revenue Share (%), by Application 2025 & 2033
- Figure 42: Middle East & Africa Vehicle Chassis Component Volume Share (%), by Application 2025 & 2033
- Figure 43: Middle East & Africa Vehicle Chassis Component Revenue (million), by Types 2025 & 2033
- Figure 44: Middle East & Africa Vehicle Chassis Component Volume (K), by Types 2025 & 2033
- Figure 45: Middle East & Africa Vehicle Chassis Component Revenue Share (%), by Types 2025 & 2033
- Figure 46: Middle East & Africa Vehicle Chassis Component Volume Share (%), by Types 2025 & 2033
- Figure 47: Middle East & Africa Vehicle Chassis Component Revenue (million), by Country 2025 & 2033
- Figure 48: Middle East & Africa Vehicle Chassis Component Volume (K), by Country 2025 & 2033
- Figure 49: Middle East & Africa Vehicle Chassis Component Revenue Share (%), by Country 2025 & 2033
- Figure 50: Middle East & Africa Vehicle Chassis Component Volume Share (%), by Country 2025 & 2033
- Figure 51: Asia Pacific Vehicle Chassis Component Revenue (million), by Application 2025 & 2033
- Figure 52: Asia Pacific Vehicle Chassis Component Volume (K), by Application 2025 & 2033
- Figure 53: Asia Pacific Vehicle Chassis Component Revenue Share (%), by Application 2025 & 2033
- Figure 54: Asia Pacific Vehicle Chassis Component Volume Share (%), by Application 2025 & 2033
- Figure 55: Asia Pacific Vehicle Chassis Component Revenue (million), by Types 2025 & 2033
- Figure 56: Asia Pacific Vehicle Chassis Component Volume (K), by Types 2025 & 2033
- Figure 57: Asia Pacific Vehicle Chassis Component Revenue Share (%), by Types 2025 & 2033
- Figure 58: Asia Pacific Vehicle Chassis Component Volume Share (%), by Types 2025 & 2033
- Figure 59: Asia Pacific Vehicle Chassis Component Revenue (million), by Country 2025 & 2033
- Figure 60: Asia Pacific Vehicle Chassis Component Volume (K), by Country 2025 & 2033
- Figure 61: Asia Pacific Vehicle Chassis Component Revenue Share (%), by Country 2025 & 2033
- Figure 62: Asia Pacific Vehicle Chassis Component Volume Share (%), by Country 2025 & 2033
List of Tables
- Table 1: Global Vehicle Chassis Component Revenue million Forecast, by Application 2020 & 2033
- Table 2: Global Vehicle Chassis Component Volume K Forecast, by Application 2020 & 2033
- Table 3: Global Vehicle Chassis Component Revenue million Forecast, by Types 2020 & 2033
- Table 4: Global Vehicle Chassis Component Volume K Forecast, by Types 2020 & 2033
- Table 5: Global Vehicle Chassis Component Revenue million Forecast, by Region 2020 & 2033
- Table 6: Global Vehicle Chassis Component Volume K Forecast, by Region 2020 & 2033
- Table 7: Global Vehicle Chassis Component Revenue million Forecast, by Application 2020 & 2033
- Table 8: Global Vehicle Chassis Component Volume K Forecast, by Application 2020 & 2033
- Table 9: Global Vehicle Chassis Component Revenue million Forecast, by Types 2020 & 2033
- Table 10: Global Vehicle Chassis Component Volume K Forecast, by Types 2020 & 2033
- Table 11: Global Vehicle Chassis Component Revenue million Forecast, by Country 2020 & 2033
- Table 12: Global Vehicle Chassis Component Volume K Forecast, by Country 2020 & 2033
- Table 13: United States Vehicle Chassis Component Revenue (million) Forecast, by Application 2020 & 2033
- Table 14: United States Vehicle Chassis Component Volume (K) Forecast, by Application 2020 & 2033
- Table 15: Canada Vehicle Chassis Component Revenue (million) Forecast, by Application 2020 & 2033
- Table 16: Canada Vehicle Chassis Component Volume (K) Forecast, by Application 2020 & 2033
- Table 17: Mexico Vehicle Chassis Component Revenue (million) Forecast, by Application 2020 & 2033
- Table 18: Mexico Vehicle Chassis Component Volume (K) Forecast, by Application 2020 & 2033
- Table 19: Global Vehicle Chassis Component Revenue million Forecast, by Application 2020 & 2033
- Table 20: Global Vehicle Chassis Component Volume K Forecast, by Application 2020 & 2033
- Table 21: Global Vehicle Chassis Component Revenue million Forecast, by Types 2020 & 2033
- Table 22: Global Vehicle Chassis Component Volume K Forecast, by Types 2020 & 2033
- Table 23: Global Vehicle Chassis Component Revenue million Forecast, by Country 2020 & 2033
- Table 24: Global Vehicle Chassis Component Volume K Forecast, by Country 2020 & 2033
- Table 25: Brazil Vehicle Chassis Component Revenue (million) Forecast, by Application 2020 & 2033
- Table 26: Brazil Vehicle Chassis Component Volume (K) Forecast, by Application 2020 & 2033
- Table 27: Argentina Vehicle Chassis Component Revenue (million) Forecast, by Application 2020 & 2033
- Table 28: Argentina Vehicle Chassis Component Volume (K) Forecast, by Application 2020 & 2033
- Table 29: Rest of South America Vehicle Chassis Component Revenue (million) Forecast, by Application 2020 & 2033
- Table 30: Rest of South America Vehicle Chassis Component Volume (K) Forecast, by Application 2020 & 2033
- Table 31: Global Vehicle Chassis Component Revenue million Forecast, by Application 2020 & 2033
- Table 32: Global Vehicle Chassis Component Volume K Forecast, by Application 2020 & 2033
- Table 33: Global Vehicle Chassis Component Revenue million Forecast, by Types 2020 & 2033
- Table 34: Global Vehicle Chassis Component Volume K Forecast, by Types 2020 & 2033
- Table 35: Global Vehicle Chassis Component Revenue million Forecast, by Country 2020 & 2033
- Table 36: Global Vehicle Chassis Component Volume K Forecast, by Country 2020 & 2033
- Table 37: United Kingdom Vehicle Chassis Component Revenue (million) Forecast, by Application 2020 & 2033
- Table 38: United Kingdom Vehicle Chassis Component Volume (K) Forecast, by Application 2020 & 2033
- Table 39: Germany Vehicle Chassis Component Revenue (million) Forecast, by Application 2020 & 2033
- Table 40: Germany Vehicle Chassis Component Volume (K) Forecast, by Application 2020 & 2033
- Table 41: France Vehicle Chassis Component Revenue (million) Forecast, by Application 2020 & 2033
- Table 42: France Vehicle Chassis Component Volume (K) Forecast, by Application 2020 & 2033
- Table 43: Italy Vehicle Chassis Component Revenue (million) Forecast, by Application 2020 & 2033
- Table 44: Italy Vehicle Chassis Component Volume (K) Forecast, by Application 2020 & 2033
- Table 45: Spain Vehicle Chassis Component Revenue (million) Forecast, by Application 2020 & 2033
- Table 46: Spain Vehicle Chassis Component Volume (K) Forecast, by Application 2020 & 2033
- Table 47: Russia Vehicle Chassis Component Revenue (million) Forecast, by Application 2020 & 2033
- Table 48: Russia Vehicle Chassis Component Volume (K) Forecast, by Application 2020 & 2033
- Table 49: Benelux Vehicle Chassis Component Revenue (million) Forecast, by Application 2020 & 2033
- Table 50: Benelux Vehicle Chassis Component Volume (K) Forecast, by Application 2020 & 2033
- Table 51: Nordics Vehicle Chassis Component Revenue (million) Forecast, by Application 2020 & 2033
- Table 52: Nordics Vehicle Chassis Component Volume (K) Forecast, by Application 2020 & 2033
- Table 53: Rest of Europe Vehicle Chassis Component Revenue (million) Forecast, by Application 2020 & 2033
- Table 54: Rest of Europe Vehicle Chassis Component Volume (K) Forecast, by Application 2020 & 2033
- Table 55: Global Vehicle Chassis Component Revenue million Forecast, by Application 2020 & 2033
- Table 56: Global Vehicle Chassis Component Volume K Forecast, by Application 2020 & 2033
- Table 57: Global Vehicle Chassis Component Revenue million Forecast, by Types 2020 & 2033
- Table 58: Global Vehicle Chassis Component Volume K Forecast, by Types 2020 & 2033
- Table 59: Global Vehicle Chassis Component Revenue million Forecast, by Country 2020 & 2033
- Table 60: Global Vehicle Chassis Component Volume K Forecast, by Country 2020 & 2033
- Table 61: Turkey Vehicle Chassis Component Revenue (million) Forecast, by Application 2020 & 2033
- Table 62: Turkey Vehicle Chassis Component Volume (K) Forecast, by Application 2020 & 2033
- Table 63: Israel Vehicle Chassis Component Revenue (million) Forecast, by Application 2020 & 2033
- Table 64: Israel Vehicle Chassis Component Volume (K) Forecast, by Application 2020 & 2033
- Table 65: GCC Vehicle Chassis Component Revenue (million) Forecast, by Application 2020 & 2033
- Table 66: GCC Vehicle Chassis Component Volume (K) Forecast, by Application 2020 & 2033
- Table 67: North Africa Vehicle Chassis Component Revenue (million) Forecast, by Application 2020 & 2033
- Table 68: North Africa Vehicle Chassis Component Volume (K) Forecast, by Application 2020 & 2033
- Table 69: South Africa Vehicle Chassis Component Revenue (million) Forecast, by Application 2020 & 2033
- Table 70: South Africa Vehicle Chassis Component Volume (K) Forecast, by Application 2020 & 2033
- Table 71: Rest of Middle East & Africa Vehicle Chassis Component Revenue (million) Forecast, by Application 2020 & 2033
- Table 72: Rest of Middle East & Africa Vehicle Chassis Component Volume (K) Forecast, by Application 2020 & 2033
- Table 73: Global Vehicle Chassis Component Revenue million Forecast, by Application 2020 & 2033
- Table 74: Global Vehicle Chassis Component Volume K Forecast, by Application 2020 & 2033
- Table 75: Global Vehicle Chassis Component Revenue million Forecast, by Types 2020 & 2033
- Table 76: Global Vehicle Chassis Component Volume K Forecast, by Types 2020 & 2033
- Table 77: Global Vehicle Chassis Component Revenue million Forecast, by Country 2020 & 2033
- Table 78: Global Vehicle Chassis Component Volume K Forecast, by Country 2020 & 2033
- Table 79: China Vehicle Chassis Component Revenue (million) Forecast, by Application 2020 & 2033
- Table 80: China Vehicle Chassis Component Volume (K) Forecast, by Application 2020 & 2033
- Table 81: India Vehicle Chassis Component Revenue (million) Forecast, by Application 2020 & 2033
- Table 82: India Vehicle Chassis Component Volume (K) Forecast, by Application 2020 & 2033
- Table 83: Japan Vehicle Chassis Component Revenue (million) Forecast, by Application 2020 & 2033
- Table 84: Japan Vehicle Chassis Component Volume (K) Forecast, by Application 2020 & 2033
- Table 85: South Korea Vehicle Chassis Component Revenue (million) Forecast, by Application 2020 & 2033
- Table 86: South Korea Vehicle Chassis Component Volume (K) Forecast, by Application 2020 & 2033
- Table 87: ASEAN Vehicle Chassis Component Revenue (million) Forecast, by Application 2020 & 2033
- Table 88: ASEAN Vehicle Chassis Component Volume (K) Forecast, by Application 2020 & 2033
- Table 89: Oceania Vehicle Chassis Component Revenue (million) Forecast, by Application 2020 & 2033
- Table 90: Oceania Vehicle Chassis Component Volume (K) Forecast, by Application 2020 & 2033
- Table 91: Rest of Asia Pacific Vehicle Chassis Component Revenue (million) Forecast, by Application 2020 & 2033
- Table 92: Rest of Asia Pacific Vehicle Chassis Component Volume (K) Forecast, by Application 2020 & 2033
Frequently Asked Questions
1. What is the projected Compound Annual Growth Rate (CAGR) of the Vehicle Chassis Component?
The projected CAGR is approximately 10%.
2. Which companies are prominent players in the Vehicle Chassis Component?
Key companies in the market include E&E, AL-KO Record, ThyssenKrupp AG, AB Volvo, Presco-Mec Group, Elgin Industries, Aichi Forge, Bharat Forge, Caparo, JAS Motorsport, Pressmark Pressings, IBEF, Y-TEC CORPORATION, HÖRMANN Automotive.
3. What are the main segments of the Vehicle Chassis Component?
The market segments include Application, Types.
4. Can you provide details about the market size?
The market size is estimated to be USD 35393 million as of 2022.
5. What are some drivers contributing to market growth?
N/A
6. What are the notable trends driving market growth?
N/A
7. Are there any restraints impacting market growth?
N/A
8. Can you provide examples of recent developments in the market?
N/A
9. What pricing options are available for accessing the report?
Pricing options include single-user, multi-user, and enterprise licenses priced at USD 3350.00, USD 5025.00, and USD 6700.00 respectively.
10. Is the market size provided in terms of value or volume?
The market size is provided in terms of value, measured in million and volume, measured in K.
11. Are there any specific market keywords associated with the report?
Yes, the market keyword associated with the report is "Vehicle Chassis Component," which aids in identifying and referencing the specific market segment covered.
12. How do I determine which pricing option suits my needs best?
The pricing options vary based on user requirements and access needs. Individual users may opt for single-user licenses, while businesses requiring broader access may choose multi-user or enterprise licenses for cost-effective access to the report.
13. Are there any additional resources or data provided in the Vehicle Chassis Component report?
While the report offers comprehensive insights, it's advisable to review the specific contents or supplementary materials provided to ascertain if additional resources or data are available.
14. How can I stay updated on further developments or reports in the Vehicle Chassis Component?
To stay informed about further developments, trends, and reports in the Vehicle Chassis Component, consider subscribing to industry newsletters, following relevant companies and organizations, or regularly checking reputable industry news sources and publications.
Methodology
Step 1 - Identification of Relevant Samples Size from Population Database


Step 2 - Approaches for Defining Global Market Size (Value, Volume* & Price*)

Note*: In applicable scenarios
Step 3 - Data Sources
Primary Research
- Web Analytics
- Survey Reports
- Research Institute
- Latest Research Reports
- Opinion Leaders
Secondary Research
- Annual Reports
- White Paper
- Latest Press Release
- Industry Association
- Paid Database
- Investor Presentations

Step 4 - Data Triangulation
Involves using different sources of information in order to increase the validity of a study
These sources are likely to be stakeholders in a program - participants, other researchers, program staff, other community members, and so on.
Then we put all data in single framework & apply various statistical tools to find out the dynamic on the market.
During the analysis stage, feedback from the stakeholder groups would be compared to determine areas of agreement as well as areas of divergence