

Key Insights
The global vehicle instrument panel market is projected for substantial expansion, propelled by escalating vehicle production, especially in emerging economies, and the growing adoption of Advanced Driver-Assistance Systems (ADAS) and sophisticated infotainment. Technological innovations are driving the creation of advanced instrument panels featuring larger displays, customizable interfaces, and integrated connectivity, meeting consumer demand for enhanced vehicle comfort and technology. Key industry leaders are investing in R&D for innovative features like augmented reality head-up displays and haptic feedback, fostering a competitive environment that spurs continuous product improvement. The market size is estimated at $10.4 billion in the base year of 2024, with a projected Compound Annual Growth Rate (CAGR) of 6.9% from 2024 to 2033. Growth is expected to be consistent globally, though regional variations will occur due to economic conditions and regulatory landscapes.
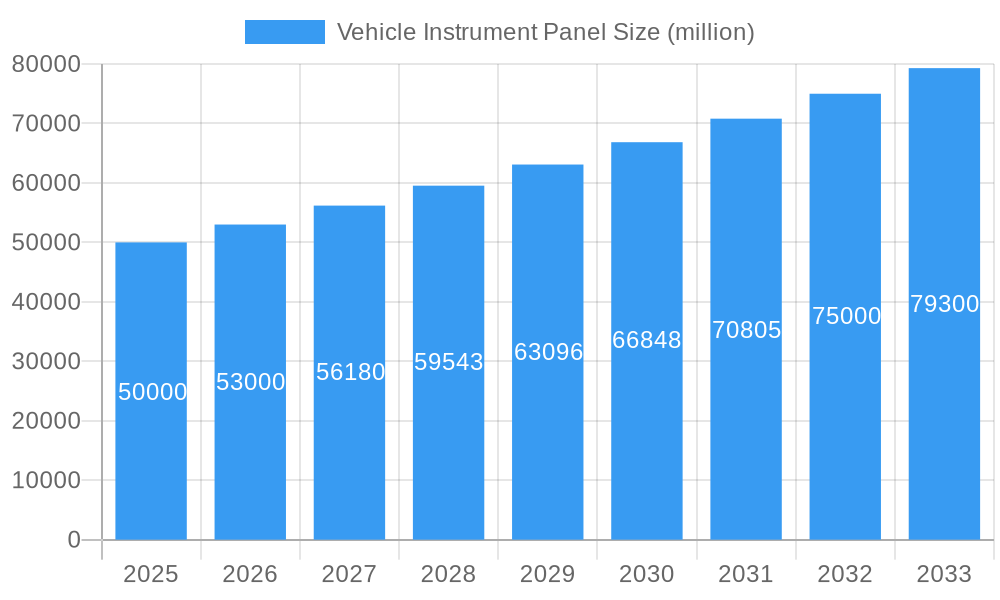
Vehicle Instrument Panel Market Size (In Billion)
Market growth is moderated by challenges including raw material price volatility, particularly for plastics and electronics, which impacts production costs. Stringent environmental regulations on material usage and supply chain disruptions, coupled with geopolitical uncertainties, also pose hurdles. Manufacturers are advised to implement sustainable sourcing, robust supply chain management, and adapt to evolving technological and regulatory frameworks. The market is segmented by vehicle type (passenger, commercial), material (plastic, metal), and geography. The rise of electric and autonomous vehicles presents significant opportunities for innovation, driving further market expansion through new technological integrations.
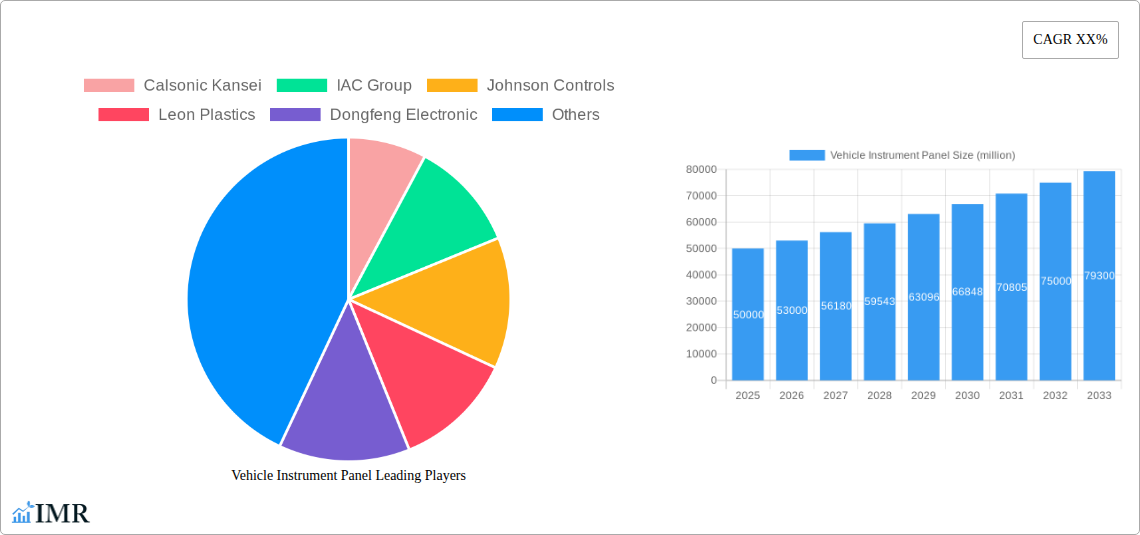
Vehicle Instrument Panel Company Market Share
Vehicle Instrument Panel Market Report: 2019-2033
This comprehensive report provides an in-depth analysis of the global Vehicle Instrument Panel market, projecting robust growth from 2025 to 2033. Targeting automotive industry professionals, investors, and researchers, this report offers invaluable insights into market dynamics, growth trends, key players, and emerging opportunities. The study covers the historical period of 2019-2024, with 2025 as the base year and a forecast period spanning 2025-2033. The market size is valued in million units throughout the report.
Vehicle Instrument Panel Market Dynamics & Structure
The global vehicle instrument panel market exhibits a moderately consolidated structure with key players like Johnson Controls, Faurecia, and Calsonic Kansei holding significant market share. Technological innovation, driven by the increasing demand for advanced driver-assistance systems (ADAS) and digital cockpits, is a major growth driver. Stringent regulatory frameworks regarding safety and emissions are shaping product development. The rise of connected car technologies and the increasing adoption of electric vehicles (EVs) further fuel market growth. Substitute products, while limited, include simpler dashboard designs in low-cost vehicles; however, the trend toward enhanced features and connectivity is mitigating their impact. M&A activity in the sector is moderate, with a projected xx number of deals annually during the forecast period, consolidating market share among major players.
- Market Concentration: Moderately consolidated, with top 3 players holding xx% market share in 2025.
- Technological Innovation: Focus on ADAS integration, digital displays, and customizable interfaces.
- Regulatory Landscape: Stringent safety and emissions standards driving innovation.
- Competitive Substitutes: Limited impact due to growing demand for advanced features.
- End-User Demographics: Increasing demand from luxury and commercial vehicle segments.
- M&A Activity: Projected xx deals annually (2025-2033), fostering consolidation.
Vehicle Instrument Panel Growth Trends & Insights
The global vehicle instrument panel market is experiencing significant growth, driven by factors such as the rising demand for passenger vehicles, increasing adoption of advanced driver-assistance systems (ADAS) and infotainment systems, and the global shift towards electric vehicles (EVs). The market size is estimated at xx million units in 2025, exhibiting a CAGR of xx% during the forecast period (2025-2033). This growth is further fueled by technological advancements in display technology, leading to the adoption of larger, higher-resolution displays and the integration of advanced functionalities such as augmented reality (AR) overlays and haptic feedback. Consumer preferences are shifting towards more personalized and interactive instrument panels, boosting market demand. Technological disruptions in the automotive sector, specifically in electronics and software, are accelerating the innovation and evolution of instrument panel designs.
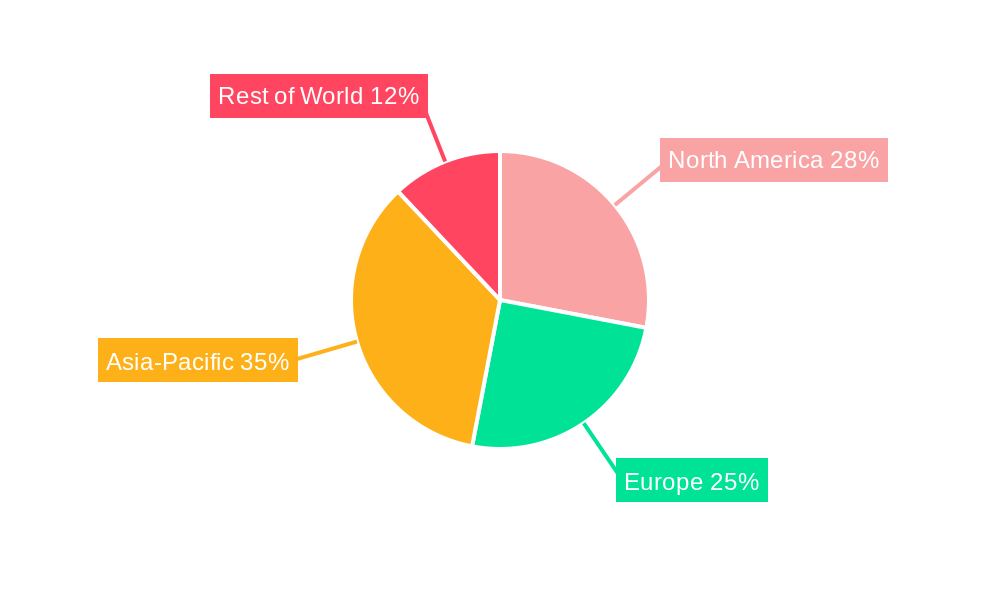
Dominant Regions, Countries, or Segments in Vehicle Instrument Panel
The Asia-Pacific region is expected to dominate the vehicle instrument panel market throughout the forecast period, driven by robust automotive production in countries like China, India, and Japan. North America and Europe are also significant markets, exhibiting steady growth, albeit at a slower rate compared to Asia-Pacific. The growth within the Asia-Pacific region is fueled by factors such as rapid economic expansion, rising disposable incomes, and government initiatives promoting automotive manufacturing.
- Asia-Pacific: Strong automotive production, rising disposable incomes, and government support.
- North America: Steady growth driven by demand for advanced features and high-end vehicles.
- Europe: Focus on electric vehicle adoption and stringent emission norms driving market growth.
- Market Share: Asia-Pacific holds approximately xx% of the global market in 2025.
Vehicle Instrument Panel Product Landscape
The vehicle instrument panel market offers a range of products, from basic analog displays to sophisticated digital instrument clusters incorporating advanced driver-assistance systems (ADAS). The latest innovations include fully digital instrument panels with customizable layouts, high-resolution displays, augmented reality (AR) head-up displays (HUDs), and haptic feedback for enhanced driver interaction. These advancements focus on improving driver safety, comfort, and in-car entertainment. Unique selling propositions include improved user experience, better safety features, and integration with infotainment and connectivity systems.
Key Drivers, Barriers & Challenges in Vehicle Instrument Panel
Key Drivers: The rising demand for advanced driver-assistance systems (ADAS), increasing adoption of connected car technologies, and the growing popularity of electric vehicles are key drivers in this market. Governmental regulations promoting vehicle safety and emissions reductions also stimulate demand for advanced instrument panels.
Key Challenges: Supply chain disruptions, particularly concerning semiconductor shortages, pose a significant challenge to production. The high cost of developing and implementing advanced technologies, coupled with intense competition among established and new players, is another significant challenge. Stringent regulatory compliance standards further add complexity. Estimated production losses due to these factors account for approximately xx million units annually.
Emerging Opportunities in Vehicle Instrument Panel
Emerging opportunities lie in the development and integration of augmented reality (AR) and virtual reality (VR) technologies into instrument panels. The growing demand for personalized and customizable displays opens opportunities for niche product development. Expanding into emerging markets, particularly in developing economies, represents a considerable growth potential. Moreover, integration with AI-powered assistants and voice-activated controls will further enhance user experience and drive market demand.
Growth Accelerators in the Vehicle Instrument Panel Industry
Technological advancements, strategic partnerships, and market expansion strategies are key growth accelerators. Breakthroughs in display technologies, such as OLED and microLED, are expected to propel market growth. Collaboration between automotive manufacturers and technology companies is driving innovation and fostering the development of cutting-edge instrument panels. Expansion into new markets and product segments, particularly in the commercial vehicle sector, offers significant growth potential.
Key Players Shaping the Vehicle Instrument Panel Market
- Calsonic Kansei
- IAC Group
- Johnson Controls
- Leon Plastics
- Dongfeng Electronic
- Faurecia
- Reydel Automotive
- Changchun
- Faway-Johnson Controls
Notable Milestones in Vehicle Instrument Panel Sector
- 2020: Johnson Controls launched a new line of digital instrument clusters with advanced connectivity features.
- 2021: Faurecia announced a significant investment in R&D for next-generation instrument panel technologies.
- 2022: A major merger between two key players resulted in increased market consolidation. (xx further details to be added)
- 2023: Significant advancements in AR HUD technology were showcased at major automotive expos.
In-Depth Vehicle Instrument Panel Market Outlook
The future of the vehicle instrument panel market appears promising, driven by continued technological advancements and the increasing demand for advanced features in vehicles. The market is poised for substantial growth, particularly in the areas of augmented reality, artificial intelligence, and seamless connectivity. Strategic partnerships and expansions into new markets will be crucial for success in this evolving landscape. The market is projected to reach xx million units by 2033, highlighting substantial growth and investment opportunities.
Vehicle Instrument Panel Segmentation
-
1. Application
- 1.1. Passenger Vehicle
- 1.2. Commercial Vehicle
-
2. Types
- 2.1. Analog
- 2.2. Hybrid
- 2.3. Digital
Vehicle Instrument Panel Segmentation By Geography
-
1. North America
- 1.1. United States
- 1.2. Canada
- 1.3. Mexico
-
2. South America
- 2.1. Brazil
- 2.2. Argentina
- 2.3. Rest of South America
-
3. Europe
- 3.1. United Kingdom
- 3.2. Germany
- 3.3. France
- 3.4. Italy
- 3.5. Spain
- 3.6. Russia
- 3.7. Benelux
- 3.8. Nordics
- 3.9. Rest of Europe
-
4. Middle East & Africa
- 4.1. Turkey
- 4.2. Israel
- 4.3. GCC
- 4.4. North Africa
- 4.5. South Africa
- 4.6. Rest of Middle East & Africa
-
5. Asia Pacific
- 5.1. China
- 5.2. India
- 5.3. Japan
- 5.4. South Korea
- 5.5. ASEAN
- 5.6. Oceania
- 5.7. Rest of Asia Pacific
Vehicle Instrument Panel Regional Market Share
Geographic Coverage of Vehicle Instrument Panel
Vehicle Instrument Panel REPORT HIGHLIGHTS
| Aspects | Details |
|---|---|
| Study Period | 2020-2034 |
| Base Year | 2025 |
| Estimated Year | 2026 |
| Forecast Period | 2026-2034 |
| Historical Period | 2020-2025 |
| Growth Rate | CAGR of 6.9% from 2020-2034 |
| Segmentation |
|
Table of Contents
- 1. Introduction
- 1.1. Research Scope
- 1.2. Market Segmentation
- 1.3. Research Objective
- 1.4. Definitions and Assumptions
- 2. Executive Summary
- 2.1. Market Snapshot
- 3. Market Dynamics
- 3.1. Market Drivers
- 3.2. Market Restrains
- 3.3. Market Trends
- 3.4. Market Opportunities
- 4. Market Factor Analysis
- 4.1. Porters Five Forces
- 4.1.1. Bargaining Power of Suppliers
- 4.1.2. Bargaining Power of Buyers
- 4.1.3. Threat of New Entrants
- 4.1.4. Threat of Substitutes
- 4.1.5. Competitive Rivalry
- 4.2. PESTEL analysis
- 4.3. BCG Analysis
- 4.3.1. Stars (High Growth, High Market Share)
- 4.3.2. Cash Cows (Low Growth, High Market Share)
- 4.3.3. Question Mark (High Growth, Low Market Share)
- 4.3.4. Dogs (Low Growth, Low Market Share)
- 4.4. Ansoff Matrix Analysis
- 4.5. Supply Chain Analysis
- 4.6. Regulatory Landscape
- 4.7. Current Market Potential and Opportunity Assessment (TAM–SAM–SOM Framework)
- 4.8. IMR Analyst Note
- 4.1. Porters Five Forces
- 5. Market Analysis, Insights and Forecast 2021-2033
- 5.1. Market Analysis, Insights and Forecast - by Application
- 5.1.1. Passenger Vehicle
- 5.1.2. Commercial Vehicle
- 5.2. Market Analysis, Insights and Forecast - by Types
- 5.2.1. Analog
- 5.2.2. Hybrid
- 5.2.3. Digital
- 5.3. Market Analysis, Insights and Forecast - by Region
- 5.3.1. North America
- 5.3.2. South America
- 5.3.3. Europe
- 5.3.4. Middle East & Africa
- 5.3.5. Asia Pacific
- 5.1. Market Analysis, Insights and Forecast - by Application
- 6. Global Vehicle Instrument Panel Analysis, Insights and Forecast, 2021-2033
- 6.1. Market Analysis, Insights and Forecast - by Application
- 6.1.1. Passenger Vehicle
- 6.1.2. Commercial Vehicle
- 6.2. Market Analysis, Insights and Forecast - by Types
- 6.2.1. Analog
- 6.2.2. Hybrid
- 6.2.3. Digital
- 6.1. Market Analysis, Insights and Forecast - by Application
- 7. North America Vehicle Instrument Panel Analysis, Insights and Forecast, 2020-2032
- 7.1. Market Analysis, Insights and Forecast - by Application
- 7.1.1. Passenger Vehicle
- 7.1.2. Commercial Vehicle
- 7.2. Market Analysis, Insights and Forecast - by Types
- 7.2.1. Analog
- 7.2.2. Hybrid
- 7.2.3. Digital
- 7.1. Market Analysis, Insights and Forecast - by Application
- 8. South America Vehicle Instrument Panel Analysis, Insights and Forecast, 2020-2032
- 8.1. Market Analysis, Insights and Forecast - by Application
- 8.1.1. Passenger Vehicle
- 8.1.2. Commercial Vehicle
- 8.2. Market Analysis, Insights and Forecast - by Types
- 8.2.1. Analog
- 8.2.2. Hybrid
- 8.2.3. Digital
- 8.1. Market Analysis, Insights and Forecast - by Application
- 9. Europe Vehicle Instrument Panel Analysis, Insights and Forecast, 2020-2032
- 9.1. Market Analysis, Insights and Forecast - by Application
- 9.1.1. Passenger Vehicle
- 9.1.2. Commercial Vehicle
- 9.2. Market Analysis, Insights and Forecast - by Types
- 9.2.1. Analog
- 9.2.2. Hybrid
- 9.2.3. Digital
- 9.1. Market Analysis, Insights and Forecast - by Application
- 10. Middle East & Africa Vehicle Instrument Panel Analysis, Insights and Forecast, 2020-2032
- 10.1. Market Analysis, Insights and Forecast - by Application
- 10.1.1. Passenger Vehicle
- 10.1.2. Commercial Vehicle
- 10.2. Market Analysis, Insights and Forecast - by Types
- 10.2.1. Analog
- 10.2.2. Hybrid
- 10.2.3. Digital
- 10.1. Market Analysis, Insights and Forecast - by Application
- 11. Asia Pacific Vehicle Instrument Panel Analysis, Insights and Forecast, 2020-2032
- 11.1. Market Analysis, Insights and Forecast - by Application
- 11.1.1. Passenger Vehicle
- 11.1.2. Commercial Vehicle
- 11.2. Market Analysis, Insights and Forecast - by Types
- 11.2.1. Analog
- 11.2.2. Hybrid
- 11.2.3. Digital
- 11.1. Market Analysis, Insights and Forecast - by Application
- 12. Competitive Analysis
- 12.1. Company Profiles
- 12.1.1 Calsonic Kansei
- 12.1.1.1. Company Overview
- 12.1.1.2. Products
- 12.1.1.3. Company Financials
- 12.1.1.4. SWOT Analysis
- 12.1.2 IAC Group
- 12.1.2.1. Company Overview
- 12.1.2.2. Products
- 12.1.2.3. Company Financials
- 12.1.2.4. SWOT Analysis
- 12.1.3 Johnson Controls
- 12.1.3.1. Company Overview
- 12.1.3.2. Products
- 12.1.3.3. Company Financials
- 12.1.3.4. SWOT Analysis
- 12.1.4 Leon Plastics
- 12.1.4.1. Company Overview
- 12.1.4.2. Products
- 12.1.4.3. Company Financials
- 12.1.4.4. SWOT Analysis
- 12.1.5 Dongfeng Electronic
- 12.1.5.1. Company Overview
- 12.1.5.2. Products
- 12.1.5.3. Company Financials
- 12.1.5.4. SWOT Analysis
- 12.1.6 Faurecia
- 12.1.6.1. Company Overview
- 12.1.6.2. Products
- 12.1.6.3. Company Financials
- 12.1.6.4. SWOT Analysis
- 12.1.7 Reydel Automotive
- 12.1.7.1. Company Overview
- 12.1.7.2. Products
- 12.1.7.3. Company Financials
- 12.1.7.4. SWOT Analysis
- 12.1.8 Changchun
- 12.1.8.1. Company Overview
- 12.1.8.2. Products
- 12.1.8.3. Company Financials
- 12.1.8.4. SWOT Analysis
- 12.1.9 Faway-Johnson Controls
- 12.1.9.1. Company Overview
- 12.1.9.2. Products
- 12.1.9.3. Company Financials
- 12.1.9.4. SWOT Analysis
- 12.1.1 Calsonic Kansei
- 12.2. Market Entropy
- 12.2.1 Company's Key Areas Served
- 12.2.2 Recent Developments
- 12.3. Company Market Share Analysis 2025
- 12.3.1 Top 5 Companies Market Share Analysis
- 12.3.2 Top 3 Companies Market Share Analysis
- 12.4. List of Potential Customers
- 13. Research Methodology
List of Figures
- Figure 1: Global Vehicle Instrument Panel Revenue Breakdown (billion, %) by Region 2025 & 2033
- Figure 2: North America Vehicle Instrument Panel Revenue (billion), by Application 2025 & 2033
- Figure 3: North America Vehicle Instrument Panel Revenue Share (%), by Application 2025 & 2033
- Figure 4: North America Vehicle Instrument Panel Revenue (billion), by Types 2025 & 2033
- Figure 5: North America Vehicle Instrument Panel Revenue Share (%), by Types 2025 & 2033
- Figure 6: North America Vehicle Instrument Panel Revenue (billion), by Country 2025 & 2033
- Figure 7: North America Vehicle Instrument Panel Revenue Share (%), by Country 2025 & 2033
- Figure 8: South America Vehicle Instrument Panel Revenue (billion), by Application 2025 & 2033
- Figure 9: South America Vehicle Instrument Panel Revenue Share (%), by Application 2025 & 2033
- Figure 10: South America Vehicle Instrument Panel Revenue (billion), by Types 2025 & 2033
- Figure 11: South America Vehicle Instrument Panel Revenue Share (%), by Types 2025 & 2033
- Figure 12: South America Vehicle Instrument Panel Revenue (billion), by Country 2025 & 2033
- Figure 13: South America Vehicle Instrument Panel Revenue Share (%), by Country 2025 & 2033
- Figure 14: Europe Vehicle Instrument Panel Revenue (billion), by Application 2025 & 2033
- Figure 15: Europe Vehicle Instrument Panel Revenue Share (%), by Application 2025 & 2033
- Figure 16: Europe Vehicle Instrument Panel Revenue (billion), by Types 2025 & 2033
- Figure 17: Europe Vehicle Instrument Panel Revenue Share (%), by Types 2025 & 2033
- Figure 18: Europe Vehicle Instrument Panel Revenue (billion), by Country 2025 & 2033
- Figure 19: Europe Vehicle Instrument Panel Revenue Share (%), by Country 2025 & 2033
- Figure 20: Middle East & Africa Vehicle Instrument Panel Revenue (billion), by Application 2025 & 2033
- Figure 21: Middle East & Africa Vehicle Instrument Panel Revenue Share (%), by Application 2025 & 2033
- Figure 22: Middle East & Africa Vehicle Instrument Panel Revenue (billion), by Types 2025 & 2033
- Figure 23: Middle East & Africa Vehicle Instrument Panel Revenue Share (%), by Types 2025 & 2033
- Figure 24: Middle East & Africa Vehicle Instrument Panel Revenue (billion), by Country 2025 & 2033
- Figure 25: Middle East & Africa Vehicle Instrument Panel Revenue Share (%), by Country 2025 & 2033
- Figure 26: Asia Pacific Vehicle Instrument Panel Revenue (billion), by Application 2025 & 2033
- Figure 27: Asia Pacific Vehicle Instrument Panel Revenue Share (%), by Application 2025 & 2033
- Figure 28: Asia Pacific Vehicle Instrument Panel Revenue (billion), by Types 2025 & 2033
- Figure 29: Asia Pacific Vehicle Instrument Panel Revenue Share (%), by Types 2025 & 2033
- Figure 30: Asia Pacific Vehicle Instrument Panel Revenue (billion), by Country 2025 & 2033
- Figure 31: Asia Pacific Vehicle Instrument Panel Revenue Share (%), by Country 2025 & 2033
List of Tables
- Table 1: Global Vehicle Instrument Panel Revenue billion Forecast, by Application 2020 & 2033
- Table 2: Global Vehicle Instrument Panel Revenue billion Forecast, by Types 2020 & 2033
- Table 3: Global Vehicle Instrument Panel Revenue billion Forecast, by Region 2020 & 2033
- Table 4: Global Vehicle Instrument Panel Revenue billion Forecast, by Application 2020 & 2033
- Table 5: Global Vehicle Instrument Panel Revenue billion Forecast, by Types 2020 & 2033
- Table 6: Global Vehicle Instrument Panel Revenue billion Forecast, by Country 2020 & 2033
- Table 7: United States Vehicle Instrument Panel Revenue (billion) Forecast, by Application 2020 & 2033
- Table 8: Canada Vehicle Instrument Panel Revenue (billion) Forecast, by Application 2020 & 2033
- Table 9: Mexico Vehicle Instrument Panel Revenue (billion) Forecast, by Application 2020 & 2033
- Table 10: Global Vehicle Instrument Panel Revenue billion Forecast, by Application 2020 & 2033
- Table 11: Global Vehicle Instrument Panel Revenue billion Forecast, by Types 2020 & 2033
- Table 12: Global Vehicle Instrument Panel Revenue billion Forecast, by Country 2020 & 2033
- Table 13: Brazil Vehicle Instrument Panel Revenue (billion) Forecast, by Application 2020 & 2033
- Table 14: Argentina Vehicle Instrument Panel Revenue (billion) Forecast, by Application 2020 & 2033
- Table 15: Rest of South America Vehicle Instrument Panel Revenue (billion) Forecast, by Application 2020 & 2033
- Table 16: Global Vehicle Instrument Panel Revenue billion Forecast, by Application 2020 & 2033
- Table 17: Global Vehicle Instrument Panel Revenue billion Forecast, by Types 2020 & 2033
- Table 18: Global Vehicle Instrument Panel Revenue billion Forecast, by Country 2020 & 2033
- Table 19: United Kingdom Vehicle Instrument Panel Revenue (billion) Forecast, by Application 2020 & 2033
- Table 20: Germany Vehicle Instrument Panel Revenue (billion) Forecast, by Application 2020 & 2033
- Table 21: France Vehicle Instrument Panel Revenue (billion) Forecast, by Application 2020 & 2033
- Table 22: Italy Vehicle Instrument Panel Revenue (billion) Forecast, by Application 2020 & 2033
- Table 23: Spain Vehicle Instrument Panel Revenue (billion) Forecast, by Application 2020 & 2033
- Table 24: Russia Vehicle Instrument Panel Revenue (billion) Forecast, by Application 2020 & 2033
- Table 25: Benelux Vehicle Instrument Panel Revenue (billion) Forecast, by Application 2020 & 2033
- Table 26: Nordics Vehicle Instrument Panel Revenue (billion) Forecast, by Application 2020 & 2033
- Table 27: Rest of Europe Vehicle Instrument Panel Revenue (billion) Forecast, by Application 2020 & 2033
- Table 28: Global Vehicle Instrument Panel Revenue billion Forecast, by Application 2020 & 2033
- Table 29: Global Vehicle Instrument Panel Revenue billion Forecast, by Types 2020 & 2033
- Table 30: Global Vehicle Instrument Panel Revenue billion Forecast, by Country 2020 & 2033
- Table 31: Turkey Vehicle Instrument Panel Revenue (billion) Forecast, by Application 2020 & 2033
- Table 32: Israel Vehicle Instrument Panel Revenue (billion) Forecast, by Application 2020 & 2033
- Table 33: GCC Vehicle Instrument Panel Revenue (billion) Forecast, by Application 2020 & 2033
- Table 34: North Africa Vehicle Instrument Panel Revenue (billion) Forecast, by Application 2020 & 2033
- Table 35: South Africa Vehicle Instrument Panel Revenue (billion) Forecast, by Application 2020 & 2033
- Table 36: Rest of Middle East & Africa Vehicle Instrument Panel Revenue (billion) Forecast, by Application 2020 & 2033
- Table 37: Global Vehicle Instrument Panel Revenue billion Forecast, by Application 2020 & 2033
- Table 38: Global Vehicle Instrument Panel Revenue billion Forecast, by Types 2020 & 2033
- Table 39: Global Vehicle Instrument Panel Revenue billion Forecast, by Country 2020 & 2033
- Table 40: China Vehicle Instrument Panel Revenue (billion) Forecast, by Application 2020 & 2033
- Table 41: India Vehicle Instrument Panel Revenue (billion) Forecast, by Application 2020 & 2033
- Table 42: Japan Vehicle Instrument Panel Revenue (billion) Forecast, by Application 2020 & 2033
- Table 43: South Korea Vehicle Instrument Panel Revenue (billion) Forecast, by Application 2020 & 2033
- Table 44: ASEAN Vehicle Instrument Panel Revenue (billion) Forecast, by Application 2020 & 2033
- Table 45: Oceania Vehicle Instrument Panel Revenue (billion) Forecast, by Application 2020 & 2033
- Table 46: Rest of Asia Pacific Vehicle Instrument Panel Revenue (billion) Forecast, by Application 2020 & 2033
Frequently Asked Questions
1. What is the projected Compound Annual Growth Rate (CAGR) of the Vehicle Instrument Panel?
The projected CAGR is approximately 6.9%.
2. Which companies are prominent players in the Vehicle Instrument Panel?
Key companies in the market include Calsonic Kansei, IAC Group, Johnson Controls, Leon Plastics, Dongfeng Electronic, Faurecia, Reydel Automotive, Changchun, Faway-Johnson Controls.
3. What are the main segments of the Vehicle Instrument Panel?
The market segments include Application, Types.
4. Can you provide details about the market size?
The market size is estimated to be USD 10.4 billion as of 2022.
5. What are some drivers contributing to market growth?
N/A
6. What are the notable trends driving market growth?
N/A
7. Are there any restraints impacting market growth?
N/A
8. Can you provide examples of recent developments in the market?
N/A
9. What pricing options are available for accessing the report?
Pricing options include single-user, multi-user, and enterprise licenses priced at USD 2900.00, USD 4350.00, and USD 5800.00 respectively.
10. Is the market size provided in terms of value or volume?
The market size is provided in terms of value, measured in billion.
11. Are there any specific market keywords associated with the report?
Yes, the market keyword associated with the report is "Vehicle Instrument Panel," which aids in identifying and referencing the specific market segment covered.
12. How do I determine which pricing option suits my needs best?
The pricing options vary based on user requirements and access needs. Individual users may opt for single-user licenses, while businesses requiring broader access may choose multi-user or enterprise licenses for cost-effective access to the report.
13. Are there any additional resources or data provided in the Vehicle Instrument Panel report?
While the report offers comprehensive insights, it's advisable to review the specific contents or supplementary materials provided to ascertain if additional resources or data are available.
14. How can I stay updated on further developments or reports in the Vehicle Instrument Panel?
To stay informed about further developments, trends, and reports in the Vehicle Instrument Panel, consider subscribing to industry newsletters, following relevant companies and organizations, or regularly checking reputable industry news sources and publications.
Methodology
Step 1 - Identification of Relevant Samples Size from Population Database


Step 2 - Approaches for Defining Global Market Size (Value, Volume* & Price*)

Note*: In applicable scenarios
Step 3 - Data Sources
Primary Research
- Web Analytics
- Survey Reports
- Research Institute
- Latest Research Reports
- Opinion Leaders
Secondary Research
- Annual Reports
- White Paper
- Latest Press Release
- Industry Association
- Paid Database
- Investor Presentations

Step 4 - Data Triangulation
Involves using different sources of information in order to increase the validity of a study
These sources are likely to be stakeholders in a program - participants, other researchers, program staff, other community members, and so on.
Then we put all data in single framework & apply various statistical tools to find out the dynamic on the market.
During the analysis stage, feedback from the stakeholder groups would be compared to determine areas of agreement as well as areas of divergence