

Key Insights
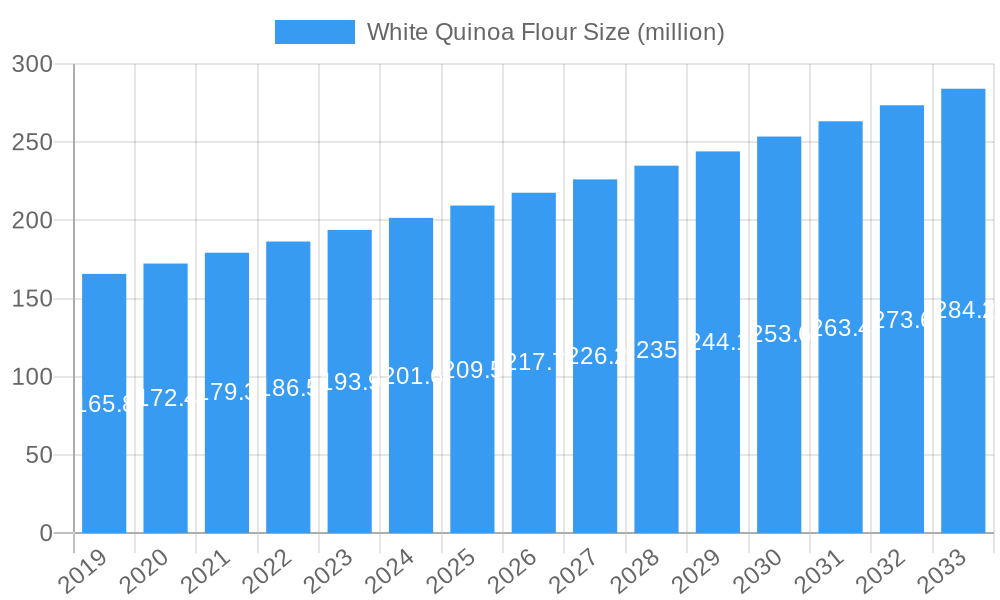
The white quinoa flour market, currently valued at $219 million in 2025, is projected to experience robust growth, driven by increasing consumer awareness of its health benefits and versatility in culinary applications. The 4.5% CAGR indicates a steady expansion over the forecast period (2025-2033). This growth is fueled by several key factors. The rising popularity of gluten-free diets and the increasing demand for nutritious and functional foods are major drivers. White quinoa flour's high protein content, fiber richness, and complete amino acid profile are key selling points for health-conscious consumers. Furthermore, its neutral flavor profile makes it adaptable to various food products, from baked goods and pasta to sauces and batters, further broadening its market appeal. The market is witnessing innovation in product formulations, with manufacturers incorporating white quinoa flour into diverse food items to cater to evolving consumer preferences. This includes ready-to-eat meals, snacks, and convenience foods containing white quinoa flour.
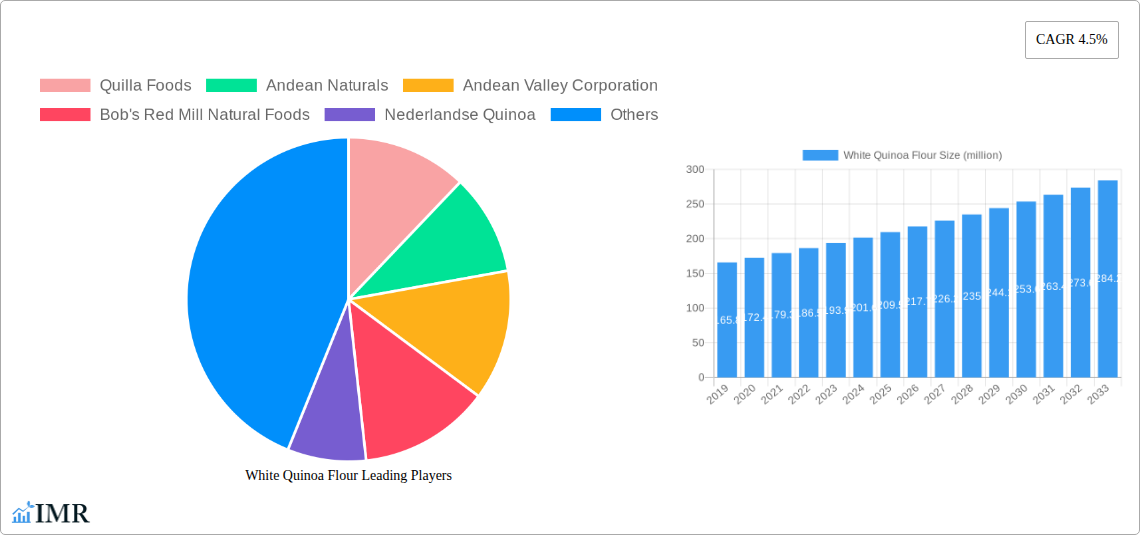
White Quinoa Flour Market Size (In Million)
Competition in the market is relatively fragmented, with several key players such as Quilla Foods, Andean Naturals, and Bob's Red Mill Natural Foods contributing to the market’s dynamic landscape. However, opportunities exist for new entrants to establish a strong presence by focusing on niche market segments and developing innovative products that cater to specific dietary needs or preferences. Challenges may include maintaining consistent supply chains, given the dependence on quinoa cultivation, and managing price fluctuations influenced by factors like weather patterns and agricultural practices. The overall market outlook remains positive, with significant growth potential as consumer demand for healthy and versatile food ingredients continues to rise globally. Strategic partnerships and investments in research and development will be crucial for companies aiming for market leadership in this expanding sector.
White Quinoa Flour Company Market Share
White Quinoa Flour Market Report: 2019-2033
A Comprehensive Analysis of Market Dynamics, Growth Trends, and Future Outlook
This in-depth report provides a comprehensive analysis of the global white quinoa flour market, covering the period 2019-2033. It offers invaluable insights for industry professionals, investors, and businesses seeking to understand the market's current state, future trajectory, and key players. The report leverages extensive data analysis and expert insights to deliver a detailed understanding of market dynamics, growth trends, and emerging opportunities within the parent market of grain flours and the child market of gluten-free flours. The report projects a market size of XX million units by 2033, presenting a compelling investment case for stakeholders.
White Quinoa Flour Market Dynamics & Structure
This section analyzes the competitive landscape, technological advancements, regulatory environment, and market trends impacting the white quinoa flour market. The market is characterized by a moderately fragmented structure with several key players vying for market share.
- Market Concentration: The market exhibits moderate concentration, with the top five players holding an estimated XX% market share in 2025.
- Technological Innovation: Innovations focus on improving flour quality, processing efficiency, and expanding application areas. Barriers to innovation include high initial investment costs for advanced processing technologies.
- Regulatory Framework: Regulations concerning food safety and labeling vary across regions, impacting market access and product development.
- Competitive Substitutes: Other gluten-free flours (e.g., rice flour, almond flour) pose significant competitive pressure.
- End-User Demographics: Growing demand from health-conscious consumers and those with dietary restrictions (e.g., celiac disease) fuels market growth.
- M&A Trends: The number of M&A deals within the white quinoa flour industry averaged XX per year during the historical period (2019-2024), indicating consolidation.
The qualitative factors significantly influencing the market include consumer preferences for healthier and sustainable food options, increasing awareness of the nutritional benefits of quinoa, and rising demand for gluten-free products.
White Quinoa Flour Growth Trends & Insights
The global white quinoa flour market experienced a CAGR of XX% during the historical period (2019-2024), driven by increasing consumer awareness of its nutritional value and versatility. Market adoption rates are increasing steadily, especially in developed countries with a strong health and wellness focus. Technological advancements in quinoa processing and flour refinement have improved product quality and expanded its applications across diverse food and beverage industries. Consumer behavior shifts towards healthier diets and a preference for gluten-free alternatives fuel significant growth, with the market projected to reach XX million units by 2025 and XX million units by 2033. The market penetration rate is expected to increase from XX% in 2025 to XX% by 2033.
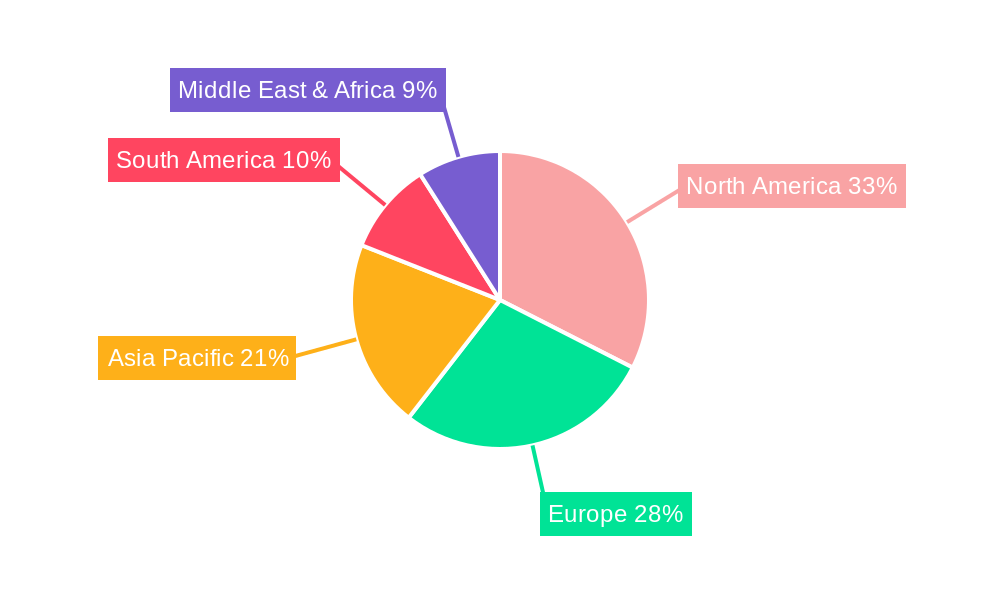
Dominant Regions, Countries, or Segments in White Quinoa Flour
North America currently dominates the white quinoa flour market, holding the largest market share in 2025 due to high consumer demand for gluten-free products and strong purchasing power. However, significant growth potential exists in Asia-Pacific and Europe, driven by rising awareness of quinoa's health benefits and increasing disposable incomes.
- Key Drivers in North America: High consumer awareness of health and wellness, strong demand for gluten-free products, established distribution networks.
- Key Drivers in Asia-Pacific: Rising disposable incomes, increasing adoption of western dietary habits, growing health-conscious population.
- Key Drivers in Europe: Strong demand for gluten-free and organic products, government support for sustainable agriculture.
Market dominance is primarily determined by consumer preference, distribution infrastructure, and regulatory frameworks. Growth potential varies across regions, with developing economies showing substantial expansion opportunities.
White Quinoa Flour Product Landscape
White quinoa flour is increasingly being offered in various forms, including organic, non-GMO, and specialty blends. Product innovation focuses on enhancing functionality, texture, and taste, leading to broader applications in baking, cooking, and other food products. Unique selling propositions include its high protein content, gluten-free nature, and versatility. Advancements in processing technology allow for finer particle sizes and improved flour consistency.
Key Drivers, Barriers & Challenges in White Quinoa Flour
Key Drivers:
- Growing demand for gluten-free and health-conscious food products.
- Increasing awareness of quinoa’s nutritional benefits.
- Expansion into new food applications (e.g., snacks, beverages).
Challenges & Restraints:
- Fluctuations in quinoa production and prices due to climatic conditions.
- Competition from other gluten-free flours and grains.
- Limited availability and high cost compared to wheat flour in some markets. This creates a significant barrier to wider market penetration, impacting overall demand by an estimated XX% in 2025.
Emerging Opportunities in White Quinoa Flour
- Expanding into new geographical markets, particularly in developing economies.
- Development of innovative products such as quinoa flour-based snacks and ready-to-eat meals.
- Leveraging the growing interest in plant-based and sustainable foods.
Growth Accelerators in the White Quinoa Flour Industry
Technological advancements in quinoa processing and flour refinement will drive market growth. Strategic partnerships between quinoa producers and food manufacturers will further facilitate market expansion. Growing demand from the food service industry will significantly boost market size.
Key Players Shaping the White Quinoa Flour Market
- Quilla Foods
- Andean Naturals
- Andean Valley Corporation
- Bob's Red Mill Natural Foods
- Nederlandse Quinoa
- NorQuin
- Nutriwish
- The British Quinoa Company
Notable Milestones in White Quinoa Flour Sector
- 2020: Increased consumer demand for gluten-free products during the pandemic.
- 2021: Several key players invested in improving quinoa processing technology to enhance flour quality.
- 2022: Launch of new quinoa flour-based products in major retail outlets.
- 2023: Increased focus on sustainability and ethical sourcing of quinoa.
In-Depth White Quinoa Flour Market Outlook
The white quinoa flour market is poised for significant growth over the forecast period (2025-2033). Continued consumer preference for healthy and gluten-free options, coupled with product innovation and strategic partnerships, will fuel market expansion. Untapped market potential in developing economies presents significant opportunities for new entrants and established players. The market's future success hinges on addressing supply chain challenges, enhancing product quality, and promoting quinoa's nutritional benefits to a wider consumer base.
White Quinoa Flour Segmentation
-
1. Application
- 1.1. Online Sales
- 1.2. Offline Sales
-
2. Type
- 2.1. Organic White Quinoa Flour
- 2.2. Inorganic White Quinoa Flour
White Quinoa Flour Segmentation By Geography
-
1. North America
- 1.1. United States
- 1.2. Canada
- 1.3. Mexico
-
2. South America
- 2.1. Brazil
- 2.2. Argentina
- 2.3. Rest of South America
-
3. Europe
- 3.1. United Kingdom
- 3.2. Germany
- 3.3. France
- 3.4. Italy
- 3.5. Spain
- 3.6. Russia
- 3.7. Benelux
- 3.8. Nordics
- 3.9. Rest of Europe
-
4. Middle East & Africa
- 4.1. Turkey
- 4.2. Israel
- 4.3. GCC
- 4.4. North Africa
- 4.5. South Africa
- 4.6. Rest of Middle East & Africa
-
5. Asia Pacific
- 5.1. China
- 5.2. India
- 5.3. Japan
- 5.4. South Korea
- 5.5. ASEAN
- 5.6. Oceania
- 5.7. Rest of Asia Pacific
White Quinoa Flour Regional Market Share
Geographic Coverage of White Quinoa Flour
White Quinoa Flour REPORT HIGHLIGHTS
| Aspects | Details |
|---|---|
| Study Period | 2020-2034 |
| Base Year | 2025 |
| Estimated Year | 2026 |
| Forecast Period | 2026-2034 |
| Historical Period | 2020-2025 |
| Growth Rate | CAGR of 4.5% from 2020-2034 |
| Segmentation |
|
Table of Contents
- 1. Introduction
- 1.1. Research Scope
- 1.2. Market Segmentation
- 1.3. Research Methodology
- 1.4. Definitions and Assumptions
- 2. Executive Summary
- 2.1. Introduction
- 3. Market Dynamics
- 3.1. Introduction
- 3.2. Market Drivers
- 3.3. Market Restrains
- 3.4. Market Trends
- 4. Market Factor Analysis
- 4.1. Porters Five Forces
- 4.2. Supply/Value Chain
- 4.3. PESTEL analysis
- 4.4. Market Entropy
- 4.5. Patent/Trademark Analysis
- 5. Global White Quinoa Flour Analysis, Insights and Forecast, 2020-2032
- 5.1. Market Analysis, Insights and Forecast - by Application
- 5.1.1. Online Sales
- 5.1.2. Offline Sales
- 5.2. Market Analysis, Insights and Forecast - by Type
- 5.2.1. Organic White Quinoa Flour
- 5.2.2. Inorganic White Quinoa Flour
- 5.3. Market Analysis, Insights and Forecast - by Region
- 5.3.1. North America
- 5.3.2. South America
- 5.3.3. Europe
- 5.3.4. Middle East & Africa
- 5.3.5. Asia Pacific
- 5.1. Market Analysis, Insights and Forecast - by Application
- 6. North America White Quinoa Flour Analysis, Insights and Forecast, 2020-2032
- 6.1. Market Analysis, Insights and Forecast - by Application
- 6.1.1. Online Sales
- 6.1.2. Offline Sales
- 6.2. Market Analysis, Insights and Forecast - by Type
- 6.2.1. Organic White Quinoa Flour
- 6.2.2. Inorganic White Quinoa Flour
- 6.1. Market Analysis, Insights and Forecast - by Application
- 7. South America White Quinoa Flour Analysis, Insights and Forecast, 2020-2032
- 7.1. Market Analysis, Insights and Forecast - by Application
- 7.1.1. Online Sales
- 7.1.2. Offline Sales
- 7.2. Market Analysis, Insights and Forecast - by Type
- 7.2.1. Organic White Quinoa Flour
- 7.2.2. Inorganic White Quinoa Flour
- 7.1. Market Analysis, Insights and Forecast - by Application
- 8. Europe White Quinoa Flour Analysis, Insights and Forecast, 2020-2032
- 8.1. Market Analysis, Insights and Forecast - by Application
- 8.1.1. Online Sales
- 8.1.2. Offline Sales
- 8.2. Market Analysis, Insights and Forecast - by Type
- 8.2.1. Organic White Quinoa Flour
- 8.2.2. Inorganic White Quinoa Flour
- 8.1. Market Analysis, Insights and Forecast - by Application
- 9. Middle East & Africa White Quinoa Flour Analysis, Insights and Forecast, 2020-2032
- 9.1. Market Analysis, Insights and Forecast - by Application
- 9.1.1. Online Sales
- 9.1.2. Offline Sales
- 9.2. Market Analysis, Insights and Forecast - by Type
- 9.2.1. Organic White Quinoa Flour
- 9.2.2. Inorganic White Quinoa Flour
- 9.1. Market Analysis, Insights and Forecast - by Application
- 10. Asia Pacific White Quinoa Flour Analysis, Insights and Forecast, 2020-2032
- 10.1. Market Analysis, Insights and Forecast - by Application
- 10.1.1. Online Sales
- 10.1.2. Offline Sales
- 10.2. Market Analysis, Insights and Forecast - by Type
- 10.2.1. Organic White Quinoa Flour
- 10.2.2. Inorganic White Quinoa Flour
- 10.1. Market Analysis, Insights and Forecast - by Application
- 11. Competitive Analysis
- 11.1. Global Market Share Analysis 2025
- 11.2. Company Profiles
- 11.2.1 Quilla Foods
- 11.2.1.1. Overview
- 11.2.1.2. Products
- 11.2.1.3. SWOT Analysis
- 11.2.1.4. Recent Developments
- 11.2.1.5. Financials (Based on Availability)
- 11.2.2 Andean Naturals
- 11.2.2.1. Overview
- 11.2.2.2. Products
- 11.2.2.3. SWOT Analysis
- 11.2.2.4. Recent Developments
- 11.2.2.5. Financials (Based on Availability)
- 11.2.3 Andean Valley Corporation
- 11.2.3.1. Overview
- 11.2.3.2. Products
- 11.2.3.3. SWOT Analysis
- 11.2.3.4. Recent Developments
- 11.2.3.5. Financials (Based on Availability)
- 11.2.4 Bob's Red Mill Natural Foods
- 11.2.4.1. Overview
- 11.2.4.2. Products
- 11.2.4.3. SWOT Analysis
- 11.2.4.4. Recent Developments
- 11.2.4.5. Financials (Based on Availability)
- 11.2.5 Nederlandse Quinoa
- 11.2.5.1. Overview
- 11.2.5.2. Products
- 11.2.5.3. SWOT Analysis
- 11.2.5.4. Recent Developments
- 11.2.5.5. Financials (Based on Availability)
- 11.2.6 NorQuin
- 11.2.6.1. Overview
- 11.2.6.2. Products
- 11.2.6.3. SWOT Analysis
- 11.2.6.4. Recent Developments
- 11.2.6.5. Financials (Based on Availability)
- 11.2.7 Nutriwish
- 11.2.7.1. Overview
- 11.2.7.2. Products
- 11.2.7.3. SWOT Analysis
- 11.2.7.4. Recent Developments
- 11.2.7.5. Financials (Based on Availability)
- 11.2.8 The British Quinoa Company
- 11.2.8.1. Overview
- 11.2.8.2. Products
- 11.2.8.3. SWOT Analysis
- 11.2.8.4. Recent Developments
- 11.2.8.5. Financials (Based on Availability)
- 11.2.1 Quilla Foods
List of Figures
- Figure 1: Global White Quinoa Flour Revenue Breakdown (million, %) by Region 2025 & 2033
- Figure 2: North America White Quinoa Flour Revenue (million), by Application 2025 & 2033
- Figure 3: North America White Quinoa Flour Revenue Share (%), by Application 2025 & 2033
- Figure 4: North America White Quinoa Flour Revenue (million), by Type 2025 & 2033
- Figure 5: North America White Quinoa Flour Revenue Share (%), by Type 2025 & 2033
- Figure 6: North America White Quinoa Flour Revenue (million), by Country 2025 & 2033
- Figure 7: North America White Quinoa Flour Revenue Share (%), by Country 2025 & 2033
- Figure 8: South America White Quinoa Flour Revenue (million), by Application 2025 & 2033
- Figure 9: South America White Quinoa Flour Revenue Share (%), by Application 2025 & 2033
- Figure 10: South America White Quinoa Flour Revenue (million), by Type 2025 & 2033
- Figure 11: South America White Quinoa Flour Revenue Share (%), by Type 2025 & 2033
- Figure 12: South America White Quinoa Flour Revenue (million), by Country 2025 & 2033
- Figure 13: South America White Quinoa Flour Revenue Share (%), by Country 2025 & 2033
- Figure 14: Europe White Quinoa Flour Revenue (million), by Application 2025 & 2033
- Figure 15: Europe White Quinoa Flour Revenue Share (%), by Application 2025 & 2033
- Figure 16: Europe White Quinoa Flour Revenue (million), by Type 2025 & 2033
- Figure 17: Europe White Quinoa Flour Revenue Share (%), by Type 2025 & 2033
- Figure 18: Europe White Quinoa Flour Revenue (million), by Country 2025 & 2033
- Figure 19: Europe White Quinoa Flour Revenue Share (%), by Country 2025 & 2033
- Figure 20: Middle East & Africa White Quinoa Flour Revenue (million), by Application 2025 & 2033
- Figure 21: Middle East & Africa White Quinoa Flour Revenue Share (%), by Application 2025 & 2033
- Figure 22: Middle East & Africa White Quinoa Flour Revenue (million), by Type 2025 & 2033
- Figure 23: Middle East & Africa White Quinoa Flour Revenue Share (%), by Type 2025 & 2033
- Figure 24: Middle East & Africa White Quinoa Flour Revenue (million), by Country 2025 & 2033
- Figure 25: Middle East & Africa White Quinoa Flour Revenue Share (%), by Country 2025 & 2033
- Figure 26: Asia Pacific White Quinoa Flour Revenue (million), by Application 2025 & 2033
- Figure 27: Asia Pacific White Quinoa Flour Revenue Share (%), by Application 2025 & 2033
- Figure 28: Asia Pacific White Quinoa Flour Revenue (million), by Type 2025 & 2033
- Figure 29: Asia Pacific White Quinoa Flour Revenue Share (%), by Type 2025 & 2033
- Figure 30: Asia Pacific White Quinoa Flour Revenue (million), by Country 2025 & 2033
- Figure 31: Asia Pacific White Quinoa Flour Revenue Share (%), by Country 2025 & 2033
List of Tables
- Table 1: Global White Quinoa Flour Revenue million Forecast, by Application 2020 & 2033
- Table 2: Global White Quinoa Flour Revenue million Forecast, by Type 2020 & 2033
- Table 3: Global White Quinoa Flour Revenue million Forecast, by Region 2020 & 2033
- Table 4: Global White Quinoa Flour Revenue million Forecast, by Application 2020 & 2033
- Table 5: Global White Quinoa Flour Revenue million Forecast, by Type 2020 & 2033
- Table 6: Global White Quinoa Flour Revenue million Forecast, by Country 2020 & 2033
- Table 7: United States White Quinoa Flour Revenue (million) Forecast, by Application 2020 & 2033
- Table 8: Canada White Quinoa Flour Revenue (million) Forecast, by Application 2020 & 2033
- Table 9: Mexico White Quinoa Flour Revenue (million) Forecast, by Application 2020 & 2033
- Table 10: Global White Quinoa Flour Revenue million Forecast, by Application 2020 & 2033
- Table 11: Global White Quinoa Flour Revenue million Forecast, by Type 2020 & 2033
- Table 12: Global White Quinoa Flour Revenue million Forecast, by Country 2020 & 2033
- Table 13: Brazil White Quinoa Flour Revenue (million) Forecast, by Application 2020 & 2033
- Table 14: Argentina White Quinoa Flour Revenue (million) Forecast, by Application 2020 & 2033
- Table 15: Rest of South America White Quinoa Flour Revenue (million) Forecast, by Application 2020 & 2033
- Table 16: Global White Quinoa Flour Revenue million Forecast, by Application 2020 & 2033
- Table 17: Global White Quinoa Flour Revenue million Forecast, by Type 2020 & 2033
- Table 18: Global White Quinoa Flour Revenue million Forecast, by Country 2020 & 2033
- Table 19: United Kingdom White Quinoa Flour Revenue (million) Forecast, by Application 2020 & 2033
- Table 20: Germany White Quinoa Flour Revenue (million) Forecast, by Application 2020 & 2033
- Table 21: France White Quinoa Flour Revenue (million) Forecast, by Application 2020 & 2033
- Table 22: Italy White Quinoa Flour Revenue (million) Forecast, by Application 2020 & 2033
- Table 23: Spain White Quinoa Flour Revenue (million) Forecast, by Application 2020 & 2033
- Table 24: Russia White Quinoa Flour Revenue (million) Forecast, by Application 2020 & 2033
- Table 25: Benelux White Quinoa Flour Revenue (million) Forecast, by Application 2020 & 2033
- Table 26: Nordics White Quinoa Flour Revenue (million) Forecast, by Application 2020 & 2033
- Table 27: Rest of Europe White Quinoa Flour Revenue (million) Forecast, by Application 2020 & 2033
- Table 28: Global White Quinoa Flour Revenue million Forecast, by Application 2020 & 2033
- Table 29: Global White Quinoa Flour Revenue million Forecast, by Type 2020 & 2033
- Table 30: Global White Quinoa Flour Revenue million Forecast, by Country 2020 & 2033
- Table 31: Turkey White Quinoa Flour Revenue (million) Forecast, by Application 2020 & 2033
- Table 32: Israel White Quinoa Flour Revenue (million) Forecast, by Application 2020 & 2033
- Table 33: GCC White Quinoa Flour Revenue (million) Forecast, by Application 2020 & 2033
- Table 34: North Africa White Quinoa Flour Revenue (million) Forecast, by Application 2020 & 2033
- Table 35: South Africa White Quinoa Flour Revenue (million) Forecast, by Application 2020 & 2033
- Table 36: Rest of Middle East & Africa White Quinoa Flour Revenue (million) Forecast, by Application 2020 & 2033
- Table 37: Global White Quinoa Flour Revenue million Forecast, by Application 2020 & 2033
- Table 38: Global White Quinoa Flour Revenue million Forecast, by Type 2020 & 2033
- Table 39: Global White Quinoa Flour Revenue million Forecast, by Country 2020 & 2033
- Table 40: China White Quinoa Flour Revenue (million) Forecast, by Application 2020 & 2033
- Table 41: India White Quinoa Flour Revenue (million) Forecast, by Application 2020 & 2033
- Table 42: Japan White Quinoa Flour Revenue (million) Forecast, by Application 2020 & 2033
- Table 43: South Korea White Quinoa Flour Revenue (million) Forecast, by Application 2020 & 2033
- Table 44: ASEAN White Quinoa Flour Revenue (million) Forecast, by Application 2020 & 2033
- Table 45: Oceania White Quinoa Flour Revenue (million) Forecast, by Application 2020 & 2033
- Table 46: Rest of Asia Pacific White Quinoa Flour Revenue (million) Forecast, by Application 2020 & 2033
Frequently Asked Questions
1. What is the projected Compound Annual Growth Rate (CAGR) of the White Quinoa Flour?
The projected CAGR is approximately 4.5%.
2. Which companies are prominent players in the White Quinoa Flour?
Key companies in the market include Quilla Foods, Andean Naturals, Andean Valley Corporation, Bob's Red Mill Natural Foods, Nederlandse Quinoa, NorQuin, Nutriwish, The British Quinoa Company.
3. What are the main segments of the White Quinoa Flour?
The market segments include Application, Type.
4. Can you provide details about the market size?
The market size is estimated to be USD 219 million as of 2022.
5. What are some drivers contributing to market growth?
N/A
6. What are the notable trends driving market growth?
N/A
7. Are there any restraints impacting market growth?
N/A
8. Can you provide examples of recent developments in the market?
N/A
9. What pricing options are available for accessing the report?
Pricing options include single-user, multi-user, and enterprise licenses priced at USD 2900.00, USD 4350.00, and USD 5800.00 respectively.
10. Is the market size provided in terms of value or volume?
The market size is provided in terms of value, measured in million.
11. Are there any specific market keywords associated with the report?
Yes, the market keyword associated with the report is "White Quinoa Flour," which aids in identifying and referencing the specific market segment covered.
12. How do I determine which pricing option suits my needs best?
The pricing options vary based on user requirements and access needs. Individual users may opt for single-user licenses, while businesses requiring broader access may choose multi-user or enterprise licenses for cost-effective access to the report.
13. Are there any additional resources or data provided in the White Quinoa Flour report?
While the report offers comprehensive insights, it's advisable to review the specific contents or supplementary materials provided to ascertain if additional resources or data are available.
14. How can I stay updated on further developments or reports in the White Quinoa Flour?
To stay informed about further developments, trends, and reports in the White Quinoa Flour, consider subscribing to industry newsletters, following relevant companies and organizations, or regularly checking reputable industry news sources and publications.
Methodology
Step 1 - Identification of Relevant Samples Size from Population Database


Step 2 - Approaches for Defining Global Market Size (Value, Volume* & Price*)

Note*: In applicable scenarios
Step 3 - Data Sources
Primary Research
- Web Analytics
- Survey Reports
- Research Institute
- Latest Research Reports
- Opinion Leaders
Secondary Research
- Annual Reports
- White Paper
- Latest Press Release
- Industry Association
- Paid Database
- Investor Presentations

Step 4 - Data Triangulation
Involves using different sources of information in order to increase the validity of a study
These sources are likely to be stakeholders in a program - participants, other researchers, program staff, other community members, and so on.
Then we put all data in single framework & apply various statistical tools to find out the dynamic on the market.
During the analysis stage, feedback from the stakeholder groups would be compared to determine areas of agreement as well as areas of divergence