

Key Insights
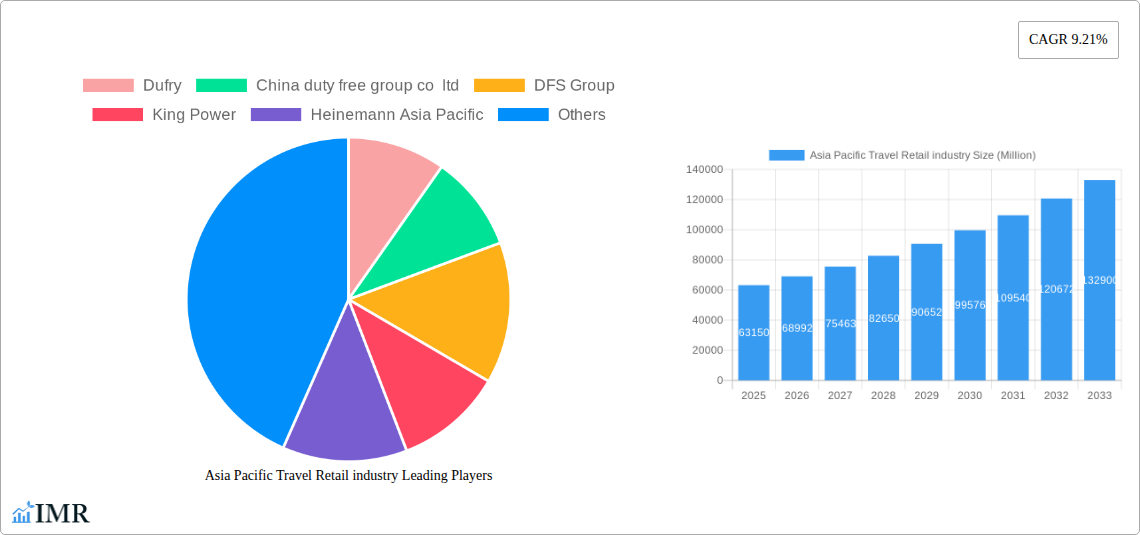
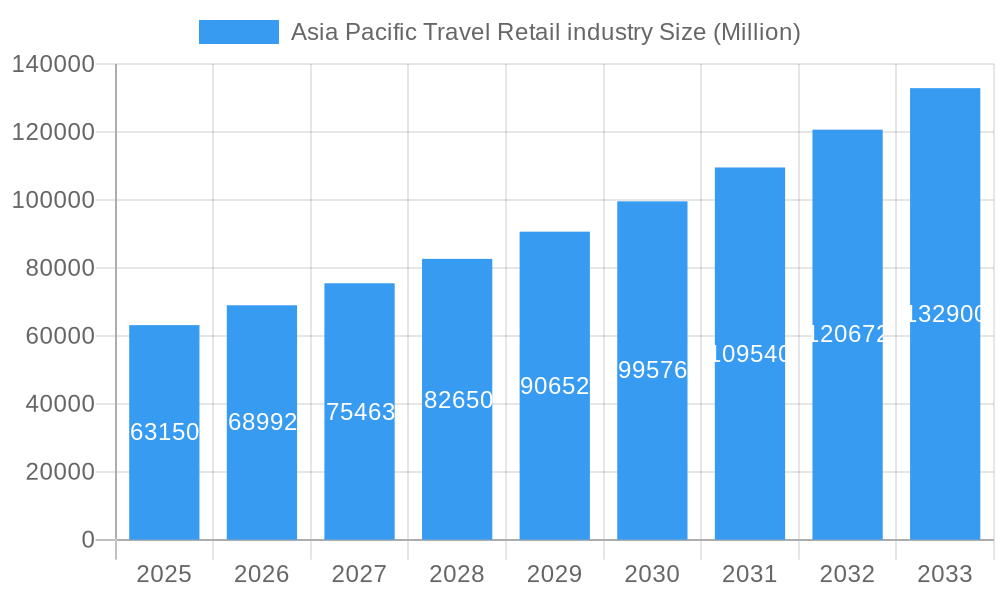
The Asia Pacific travel retail market, valued at $63.15 billion in 2025, is projected to experience robust growth, driven by a compound annual growth rate (CAGR) of 9.21% from 2025 to 2033. This expansion is fueled by several key factors. Firstly, the region's burgeoning middle class, coupled with increasing disposable incomes, is leading to a surge in international travel and spending on luxury goods and experiences. Secondly, the continuous improvement of airport infrastructure and the rise of sophisticated duty-free shopping experiences are enhancing the overall traveler journey and encouraging higher spending. Furthermore, strategic partnerships between travel retailers and airlines, along with innovative digital marketing strategies targeting affluent travelers, are significantly impacting market growth. The increasing popularity of online pre-ordering and curbside pickup options, especially among time-conscious travelers, also contributes to this trend. Competition within the sector is fierce, with major players like Dufry, China Duty Free Group, DFS Group, and King Power vying for market share through strategic acquisitions, expansion into new markets, and the introduction of exclusive product offerings.
Asia Pacific Travel Retail industry Market Size (In Billion)
However, the market also faces certain challenges. Geopolitical uncertainties, fluctuations in currency exchange rates, and potential economic downturns can impact consumer spending. Furthermore, increasing regulatory scrutiny concerning grey market goods and concerns surrounding sustainability and ethical sourcing practices are factors that require careful navigation by market participants. Segment-wise, the luxury goods segment is expected to lead the growth, followed by cosmetics and perfumes, and food and beverages. The consistent expansion of e-commerce within the travel retail sector presents both opportunities and challenges for established businesses, requiring adaptation to new business models and technologies. Ultimately, the Asia Pacific travel retail market presents significant growth potential for companies that can effectively adapt to evolving consumer preferences and market dynamics while strategically mitigating inherent risks.
Asia Pacific Travel Retail industry Company Market Share
This comprehensive report provides an in-depth analysis of the Asia Pacific travel retail market, covering the period 2019-2033. It offers invaluable insights for industry professionals, investors, and strategic planners seeking to understand the market dynamics, growth trends, and future opportunities within this dynamic sector. The report leverages extensive data analysis to deliver actionable intelligence, focusing on key segments, dominant players, and emerging trends. The base year for this report is 2025, with estimations for 2025 and forecasts extending to 2033. The historical period covered is 2019-2024. Values are presented in million units.
Asia Pacific Travel Retail Industry Market Dynamics & Structure
This section analyzes the competitive landscape, technological advancements, regulatory environment, and market forces shaping the Asia Pacific travel retail industry. The market's structure is characterized by a mix of large multinational corporations and regional players, resulting in a moderately consolidated market.
Market Concentration: The Asia Pacific travel retail market exhibits moderate concentration, with a few major players holding significant market share. Dufry, China Duty Free Group Co Ltd, DFS Group, and King Power are among the leading players, collectively controlling an estimated xx% of the market in 2025. Smaller regional players, such as Heinemann Asia Pacific and Lotte Duty Free, also contribute significantly to the overall market.
Technological Innovation Drivers: The industry is witnessing significant technological disruptions, driven by the increasing adoption of digital technologies, including mobile commerce, omnichannel strategies, and personalized customer experiences. This is leading to increased efficiency and customer engagement.
Regulatory Frameworks: Varying regulations across different countries in the Asia Pacific region influence market dynamics. Changes in duty-free allowances, import restrictions, and taxation policies can significantly impact sales and profitability for travel retailers.
Competitive Product Substitutes: Online retail, direct-to-consumer brands, and other forms of non-duty-free shopping present competitive alternatives. Travel retailers need to differentiate themselves through curated product offerings and improved shopping experiences.
End-User Demographics: The Asia Pacific region's diverse demographics influence consumer preferences and purchasing behaviors. The growing middle class and increased travel among young adults drive demand for premium and luxury products.
M&A Trends: The industry has witnessed a moderate level of mergers and acquisitions (M&A) activity in recent years, with strategic alliances and acquisitions aiming to expand market reach and product portfolios. The total value of M&A deals in the Asia Pacific travel retail sector during 2019-2024 was estimated at xx million.
- Market Share (2025): Dufry (xx%), China Duty Free Group (xx%), DFS Group (xx%), King Power (xx%), Others (xx%)
- M&A Deal Volume (2019-2024): xx deals
- Innovation Barriers: High initial investment costs, integration challenges with existing systems, regulatory complexities.
Asia Pacific Travel Retail Industry Growth Trends & Insights
The Asia Pacific travel retail market has experienced significant growth over the past few years, driven by increasing air passenger traffic, rising disposable incomes, and evolving consumer preferences. The market is projected to maintain a robust growth trajectory, propelled by continued economic expansion and technological innovations. The market size has shown a CAGR of xx% during the historical period (2019-2024) and is expected to continue growing at a CAGR of xx% during the forecast period (2025-2033). Market penetration is estimated at xx% in 2025 and is expected to reach xx% by 2033. Technological disruptions, such as the rise of online duty-free shopping and personalized marketing initiatives, are further augmenting market growth. Consumer behavior shifts, including a preference for premium and luxury goods, experiential purchases, and personalized services, are also impacting the industry. The increasing demand for convenience and seamless shopping experiences is driving the adoption of omnichannel strategies by major players.
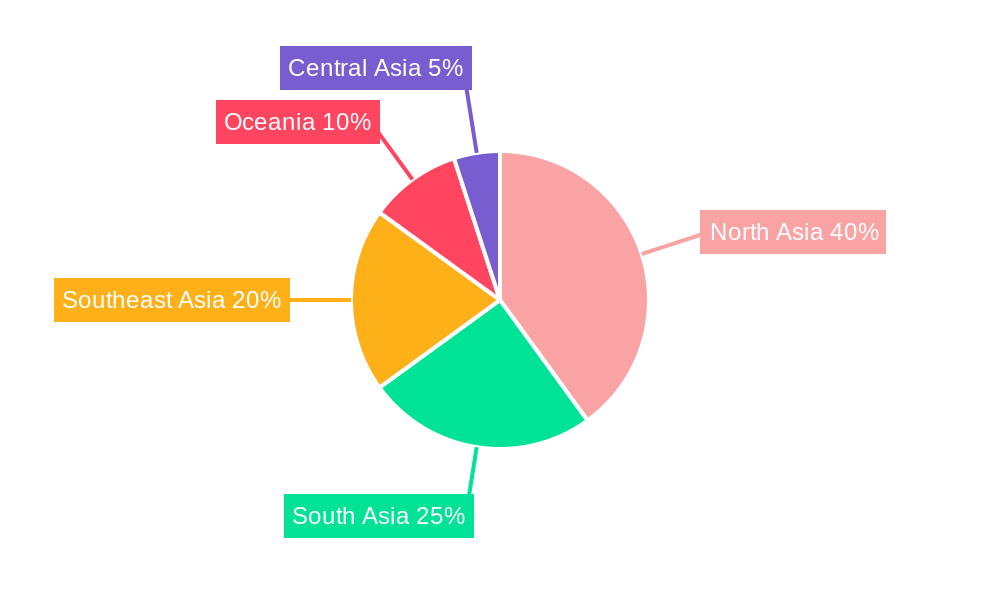
Dominant Regions, Countries, or Segments in Asia Pacific Travel Retail Industry
China, followed by Japan, South Korea, and Singapore, are the leading markets in the Asia Pacific travel retail industry. These countries contribute significantly to the overall market size and growth, driven by factors such as robust economic growth, high tourist arrivals, and favorable government policies.
- China: Dominance is driven by booming domestic tourism, increasing disposable incomes, and the popularity of duty-free shopping in Hainan Island and other major airports. Supportive government policies and robust infrastructure have further contributed to its leadership.
- Japan: Strong inbound tourism, coupled with a preference for luxury goods and high consumer spending, drives significant growth in Japan's travel retail sector.
- South Korea: The popularity of K-beauty products and the high number of international tourists boost the market's performance.
- Singapore: Its strategic location as a major transit hub and focus on luxury retail attract substantial consumer spending.
Key Drivers:
- Strong economic growth in key markets.
- Rising disposable incomes and increased consumer spending.
- Growth in inbound and outbound tourism.
- Favorable government policies and infrastructure developments (e.g., Hainan's duty-free policy).
- Technological advancements and innovation in the retail sector.
Asia Pacific Travel Retail Industry Product Landscape
The Asia Pacific travel retail market offers a diverse range of products, including beauty and cosmetics, liquor and tobacco, fashion and accessories, and food and beverages. Innovation focuses on enhancing customer experience through personalized recommendations, loyalty programs, and seamless omnichannel integration. Technological advancements like augmented reality (AR) and virtual reality (VR) are being used to create immersive shopping experiences. Unique selling propositions focus on exclusive brands, curated product assortments, and convenience of shopping during travel.
Key Drivers, Barriers & Challenges in Asia Pacific Travel Retail Industry
Key Drivers: Growing air passenger traffic, increasing disposable incomes, rising demand for luxury goods and premium brands, and expanding e-commerce infrastructure are key drivers. Government initiatives such as Hainan's duty-free policy also play a crucial role.
Key Challenges & Restraints: Geopolitical uncertainties, economic fluctuations, and stringent regulations pose challenges. Supply chain disruptions, changing consumer preferences, and increasing competition from online retailers also impact market growth. The impact of these challenges on the market is estimated at xx million in revenue loss annually (2025).
Emerging Opportunities in Asia Pacific Travel Retail Industry
Untapped markets in Southeast Asia and expanding e-commerce present significant opportunities. Personalized marketing, AI-powered recommendation systems, and integration with loyalty programs cater to evolving consumer preferences. Focus on sustainability and ethical sourcing is gaining momentum.
Growth Accelerators in the Asia Pacific Travel Retail Industry
Technological innovation, strategic partnerships between online and offline retailers, and expansion into newer markets are key growth accelerators. Investment in digital infrastructure and omnichannel capabilities will drive long-term growth.
Notable Milestones in Asia Pacific Travel Retail Industry Sector
- October 2023: DFS Group launched an entertainment and shopping complex on Hainan Island, China, boosting tourism.
- July 2023: Lagardère Travel Retail partnered with Inflyter to launch online duty-free shopping, expanding digital sales channels.
In-Depth Asia Pacific Travel Retail Industry Market Outlook
The Asia Pacific travel retail market is poised for sustained growth, driven by technological advancements, increasing tourist arrivals, and rising consumer spending. Strategic partnerships, expansion into new markets, and a focus on enhancing customer experience will be crucial for success in this dynamic market. The future presents lucrative opportunities for players who adapt to evolving consumer needs and leverage technological innovations.
Asia Pacific Travel Retail industry Segmentation
-
1. Product Type
- 1.1. Fashion and Accessories
- 1.2. Jewellery and Watches
- 1.3. Wine & Spirits
- 1.4. Food & Confectionary
- 1.5. Fragnances and Cosmetics
- 1.6. Tobacco
-
2. Distribution Channel
- 2.1. Airports
- 2.2. Airlines
- 2.3. Ferries
-
3. Geography
- 3.1. China
- 3.2. Japan
- 3.3. Korea
- 3.4. India
- 3.5. Australia
- 3.6. Southeast Asia
- 3.7. Rest Of APAC
Asia Pacific Travel Retail industry Segmentation By Geography
- 1. China
- 2. Japan
- 3. Korea
- 4. India
- 5. Australia
- 6. Southeast Asia
- 7. Rest Of APAC
Asia Pacific Travel Retail industry Regional Market Share
Geographic Coverage of Asia Pacific Travel Retail industry
Asia Pacific Travel Retail industry REPORT HIGHLIGHTS
| Aspects | Details |
|---|---|
| Study Period | 2020-2034 |
| Base Year | 2025 |
| Estimated Year | 2026 |
| Forecast Period | 2026-2034 |
| Historical Period | 2020-2025 |
| Growth Rate | CAGR of 9.21% from 2020-2034 |
| Segmentation |
|
Table of Contents
- 1. Introduction
- 1.1. Research Scope
- 1.2. Market Segmentation
- 1.3. Research Objective
- 1.4. Definitions and Assumptions
- 2. Executive Summary
- 2.1. Market Snapshot
- 3. Market Dynamics
- 3.1. Market Drivers
- 3.2. Market Restrains
- 3.3. Market Trends
- 3.4. Market Opportunities
- 4. Market Factor Analysis
- 4.1. Porters Five Forces
- 4.1.1. Bargaining Power of Suppliers
- 4.1.2. Bargaining Power of Buyers
- 4.1.3. Threat of New Entrants
- 4.1.4. Threat of Substitutes
- 4.1.5. Competitive Rivalry
- 4.2. PESTEL analysis
- 4.3. BCG Analysis
- 4.3.1. Stars (High Growth, High Market Share)
- 4.3.2. Cash Cows (Low Growth, High Market Share)
- 4.3.3. Question Mark (High Growth, Low Market Share)
- 4.3.4. Dogs (Low Growth, Low Market Share)
- 4.4. Ansoff Matrix Analysis
- 4.5. Supply Chain Analysis
- 4.6. Regulatory Landscape
- 4.7. Current Market Potential and Opportunity Assessment (TAM–SAM–SOM Framework)
- 4.8. IMR Analyst Note
- 4.1. Porters Five Forces
- 5. Market Analysis, Insights and Forecast 2021-2033
- 5.1. Market Analysis, Insights and Forecast - by Product Type
- 5.1.1. Fashion and Accessories
- 5.1.2. Jewellery and Watches
- 5.1.3. Wine & Spirits
- 5.1.4. Food & Confectionary
- 5.1.5. Fragnances and Cosmetics
- 5.1.6. Tobacco
- 5.2. Market Analysis, Insights and Forecast - by Distribution Channel
- 5.2.1. Airports
- 5.2.2. Airlines
- 5.2.3. Ferries
- 5.3. Market Analysis, Insights and Forecast - by Geography
- 5.3.1. China
- 5.3.2. Japan
- 5.3.3. Korea
- 5.3.4. India
- 5.3.5. Australia
- 5.3.6. Southeast Asia
- 5.3.7. Rest Of APAC
- 5.4. Market Analysis, Insights and Forecast - by Region
- 5.4.1. China
- 5.4.2. Japan
- 5.4.3. Korea
- 5.4.4. India
- 5.4.5. Australia
- 5.4.6. Southeast Asia
- 5.4.7. Rest Of APAC
- 5.1. Market Analysis, Insights and Forecast - by Product Type
- 6. Global Asia Pacific Travel Retail industry Analysis, Insights and Forecast, 2021-2033
- 6.1. Market Analysis, Insights and Forecast - by Product Type
- 6.1.1. Fashion and Accessories
- 6.1.2. Jewellery and Watches
- 6.1.3. Wine & Spirits
- 6.1.4. Food & Confectionary
- 6.1.5. Fragnances and Cosmetics
- 6.1.6. Tobacco
- 6.2. Market Analysis, Insights and Forecast - by Distribution Channel
- 6.2.1. Airports
- 6.2.2. Airlines
- 6.2.3. Ferries
- 6.3. Market Analysis, Insights and Forecast - by Geography
- 6.3.1. China
- 6.3.2. Japan
- 6.3.3. Korea
- 6.3.4. India
- 6.3.5. Australia
- 6.3.6. Southeast Asia
- 6.3.7. Rest Of APAC
- 6.1. Market Analysis, Insights and Forecast - by Product Type
- 7. China Asia Pacific Travel Retail industry Analysis, Insights and Forecast, 2020-2032
- 7.1. Market Analysis, Insights and Forecast - by Product Type
- 7.1.1. Fashion and Accessories
- 7.1.2. Jewellery and Watches
- 7.1.3. Wine & Spirits
- 7.1.4. Food & Confectionary
- 7.1.5. Fragnances and Cosmetics
- 7.1.6. Tobacco
- 7.2. Market Analysis, Insights and Forecast - by Distribution Channel
- 7.2.1. Airports
- 7.2.2. Airlines
- 7.2.3. Ferries
- 7.3. Market Analysis, Insights and Forecast - by Geography
- 7.3.1. China
- 7.3.2. Japan
- 7.3.3. Korea
- 7.3.4. India
- 7.3.5. Australia
- 7.3.6. Southeast Asia
- 7.3.7. Rest Of APAC
- 7.1. Market Analysis, Insights and Forecast - by Product Type
- 8. Japan Asia Pacific Travel Retail industry Analysis, Insights and Forecast, 2020-2032
- 8.1. Market Analysis, Insights and Forecast - by Product Type
- 8.1.1. Fashion and Accessories
- 8.1.2. Jewellery and Watches
- 8.1.3. Wine & Spirits
- 8.1.4. Food & Confectionary
- 8.1.5. Fragnances and Cosmetics
- 8.1.6. Tobacco
- 8.2. Market Analysis, Insights and Forecast - by Distribution Channel
- 8.2.1. Airports
- 8.2.2. Airlines
- 8.2.3. Ferries
- 8.3. Market Analysis, Insights and Forecast - by Geography
- 8.3.1. China
- 8.3.2. Japan
- 8.3.3. Korea
- 8.3.4. India
- 8.3.5. Australia
- 8.3.6. Southeast Asia
- 8.3.7. Rest Of APAC
- 8.1. Market Analysis, Insights and Forecast - by Product Type
- 9. Korea Asia Pacific Travel Retail industry Analysis, Insights and Forecast, 2020-2032
- 9.1. Market Analysis, Insights and Forecast - by Product Type
- 9.1.1. Fashion and Accessories
- 9.1.2. Jewellery and Watches
- 9.1.3. Wine & Spirits
- 9.1.4. Food & Confectionary
- 9.1.5. Fragnances and Cosmetics
- 9.1.6. Tobacco
- 9.2. Market Analysis, Insights and Forecast - by Distribution Channel
- 9.2.1. Airports
- 9.2.2. Airlines
- 9.2.3. Ferries
- 9.3. Market Analysis, Insights and Forecast - by Geography
- 9.3.1. China
- 9.3.2. Japan
- 9.3.3. Korea
- 9.3.4. India
- 9.3.5. Australia
- 9.3.6. Southeast Asia
- 9.3.7. Rest Of APAC
- 9.1. Market Analysis, Insights and Forecast - by Product Type
- 10. India Asia Pacific Travel Retail industry Analysis, Insights and Forecast, 2020-2032
- 10.1. Market Analysis, Insights and Forecast - by Product Type
- 10.1.1. Fashion and Accessories
- 10.1.2. Jewellery and Watches
- 10.1.3. Wine & Spirits
- 10.1.4. Food & Confectionary
- 10.1.5. Fragnances and Cosmetics
- 10.1.6. Tobacco
- 10.2. Market Analysis, Insights and Forecast - by Distribution Channel
- 10.2.1. Airports
- 10.2.2. Airlines
- 10.2.3. Ferries
- 10.3. Market Analysis, Insights and Forecast - by Geography
- 10.3.1. China
- 10.3.2. Japan
- 10.3.3. Korea
- 10.3.4. India
- 10.3.5. Australia
- 10.3.6. Southeast Asia
- 10.3.7. Rest Of APAC
- 10.1. Market Analysis, Insights and Forecast - by Product Type
- 11. Australia Asia Pacific Travel Retail industry Analysis, Insights and Forecast, 2020-2032
- 11.1. Market Analysis, Insights and Forecast - by Product Type
- 11.1.1. Fashion and Accessories
- 11.1.2. Jewellery and Watches
- 11.1.3. Wine & Spirits
- 11.1.4. Food & Confectionary
- 11.1.5. Fragnances and Cosmetics
- 11.1.6. Tobacco
- 11.2. Market Analysis, Insights and Forecast - by Distribution Channel
- 11.2.1. Airports
- 11.2.2. Airlines
- 11.2.3. Ferries
- 11.3. Market Analysis, Insights and Forecast - by Geography
- 11.3.1. China
- 11.3.2. Japan
- 11.3.3. Korea
- 11.3.4. India
- 11.3.5. Australia
- 11.3.6. Southeast Asia
- 11.3.7. Rest Of APAC
- 11.1. Market Analysis, Insights and Forecast - by Product Type
- 12. Southeast Asia Asia Pacific Travel Retail industry Analysis, Insights and Forecast, 2020-2032
- 12.1. Market Analysis, Insights and Forecast - by Product Type
- 12.1.1. Fashion and Accessories
- 12.1.2. Jewellery and Watches
- 12.1.3. Wine & Spirits
- 12.1.4. Food & Confectionary
- 12.1.5. Fragnances and Cosmetics
- 12.1.6. Tobacco
- 12.2. Market Analysis, Insights and Forecast - by Distribution Channel
- 12.2.1. Airports
- 12.2.2. Airlines
- 12.2.3. Ferries
- 12.3. Market Analysis, Insights and Forecast - by Geography
- 12.3.1. China
- 12.3.2. Japan
- 12.3.3. Korea
- 12.3.4. India
- 12.3.5. Australia
- 12.3.6. Southeast Asia
- 12.3.7. Rest Of APAC
- 12.1. Market Analysis, Insights and Forecast - by Product Type
- 13. Rest Of APAC Asia Pacific Travel Retail industry Analysis, Insights and Forecast, 2020-2032
- 13.1. Market Analysis, Insights and Forecast - by Product Type
- 13.1.1. Fashion and Accessories
- 13.1.2. Jewellery and Watches
- 13.1.3. Wine & Spirits
- 13.1.4. Food & Confectionary
- 13.1.5. Fragnances and Cosmetics
- 13.1.6. Tobacco
- 13.2. Market Analysis, Insights and Forecast - by Distribution Channel
- 13.2.1. Airports
- 13.2.2. Airlines
- 13.2.3. Ferries
- 13.3. Market Analysis, Insights and Forecast - by Geography
- 13.3.1. China
- 13.3.2. Japan
- 13.3.3. Korea
- 13.3.4. India
- 13.3.5. Australia
- 13.3.6. Southeast Asia
- 13.3.7. Rest Of APAC
- 13.1. Market Analysis, Insights and Forecast - by Product Type
- 14. Competitive Analysis
- 14.1. Company Profiles
- 14.1.1 Dufry
- 14.1.1.1. Company Overview
- 14.1.1.2. Products
- 14.1.1.3. Company Financials
- 14.1.1.4. SWOT Analysis
- 14.1.2 China duty free group co ltd
- 14.1.2.1. Company Overview
- 14.1.2.2. Products
- 14.1.2.3. Company Financials
- 14.1.2.4. SWOT Analysis
- 14.1.3 DFS Group
- 14.1.3.1. Company Overview
- 14.1.3.2. Products
- 14.1.3.3. Company Financials
- 14.1.3.4. SWOT Analysis
- 14.1.4 King Power
- 14.1.4.1. Company Overview
- 14.1.4.2. Products
- 14.1.4.3. Company Financials
- 14.1.4.4. SWOT Analysis
- 14.1.5 Heinemann Asia Pacific
- 14.1.5.1. Company Overview
- 14.1.5.2. Products
- 14.1.5.3. Company Financials
- 14.1.5.4. SWOT Analysis
- 14.1.6 Lotte Duty Free
- 14.1.6.1. Company Overview
- 14.1.6.2. Products
- 14.1.6.3. Company Financials
- 14.1.6.4. SWOT Analysis
- 14.1.7 The shilla duty free
- 14.1.7.1. Company Overview
- 14.1.7.2. Products
- 14.1.7.3. Company Financials
- 14.1.7.4. SWOT Analysis
- 14.1.8 Flemingo International
- 14.1.8.1. Company Overview
- 14.1.8.2. Products
- 14.1.8.3. Company Financials
- 14.1.8.4. SWOT Analysis
- 14.1.9 James Richardson Group
- 14.1.9.1. Company Overview
- 14.1.9.2. Products
- 14.1.9.3. Company Financials
- 14.1.9.4. SWOT Analysis
- 14.1.10 The Nuance Group**List Not Exhaustive
- 14.1.10.1. Company Overview
- 14.1.10.2. Products
- 14.1.10.3. Company Financials
- 14.1.10.4. SWOT Analysis
- 14.1.1 Dufry
- 14.2. Market Entropy
- 14.2.1 Company's Key Areas Served
- 14.2.2 Recent Developments
- 14.3. Company Market Share Analysis 2025
- 14.3.1 Top 5 Companies Market Share Analysis
- 14.3.2 Top 3 Companies Market Share Analysis
- 14.4. List of Potential Customers
- 15. Research Methodology
List of Figures
- Figure 1: Global Asia Pacific Travel Retail industry Revenue Breakdown (Million, %) by Region 2025 & 2033
- Figure 2: Global Asia Pacific Travel Retail industry Volume Breakdown (Billion, %) by Region 2025 & 2033
- Figure 3: China Asia Pacific Travel Retail industry Revenue (Million), by Product Type 2025 & 2033
- Figure 4: China Asia Pacific Travel Retail industry Volume (Billion), by Product Type 2025 & 2033
- Figure 5: China Asia Pacific Travel Retail industry Revenue Share (%), by Product Type 2025 & 2033
- Figure 6: China Asia Pacific Travel Retail industry Volume Share (%), by Product Type 2025 & 2033
- Figure 7: China Asia Pacific Travel Retail industry Revenue (Million), by Distribution Channel 2025 & 2033
- Figure 8: China Asia Pacific Travel Retail industry Volume (Billion), by Distribution Channel 2025 & 2033
- Figure 9: China Asia Pacific Travel Retail industry Revenue Share (%), by Distribution Channel 2025 & 2033
- Figure 10: China Asia Pacific Travel Retail industry Volume Share (%), by Distribution Channel 2025 & 2033
- Figure 11: China Asia Pacific Travel Retail industry Revenue (Million), by Geography 2025 & 2033
- Figure 12: China Asia Pacific Travel Retail industry Volume (Billion), by Geography 2025 & 2033
- Figure 13: China Asia Pacific Travel Retail industry Revenue Share (%), by Geography 2025 & 2033
- Figure 14: China Asia Pacific Travel Retail industry Volume Share (%), by Geography 2025 & 2033
- Figure 15: China Asia Pacific Travel Retail industry Revenue (Million), by Country 2025 & 2033
- Figure 16: China Asia Pacific Travel Retail industry Volume (Billion), by Country 2025 & 2033
- Figure 17: China Asia Pacific Travel Retail industry Revenue Share (%), by Country 2025 & 2033
- Figure 18: China Asia Pacific Travel Retail industry Volume Share (%), by Country 2025 & 2033
- Figure 19: Japan Asia Pacific Travel Retail industry Revenue (Million), by Product Type 2025 & 2033
- Figure 20: Japan Asia Pacific Travel Retail industry Volume (Billion), by Product Type 2025 & 2033
- Figure 21: Japan Asia Pacific Travel Retail industry Revenue Share (%), by Product Type 2025 & 2033
- Figure 22: Japan Asia Pacific Travel Retail industry Volume Share (%), by Product Type 2025 & 2033
- Figure 23: Japan Asia Pacific Travel Retail industry Revenue (Million), by Distribution Channel 2025 & 2033
- Figure 24: Japan Asia Pacific Travel Retail industry Volume (Billion), by Distribution Channel 2025 & 2033
- Figure 25: Japan Asia Pacific Travel Retail industry Revenue Share (%), by Distribution Channel 2025 & 2033
- Figure 26: Japan Asia Pacific Travel Retail industry Volume Share (%), by Distribution Channel 2025 & 2033
- Figure 27: Japan Asia Pacific Travel Retail industry Revenue (Million), by Geography 2025 & 2033
- Figure 28: Japan Asia Pacific Travel Retail industry Volume (Billion), by Geography 2025 & 2033
- Figure 29: Japan Asia Pacific Travel Retail industry Revenue Share (%), by Geography 2025 & 2033
- Figure 30: Japan Asia Pacific Travel Retail industry Volume Share (%), by Geography 2025 & 2033
- Figure 31: Japan Asia Pacific Travel Retail industry Revenue (Million), by Country 2025 & 2033
- Figure 32: Japan Asia Pacific Travel Retail industry Volume (Billion), by Country 2025 & 2033
- Figure 33: Japan Asia Pacific Travel Retail industry Revenue Share (%), by Country 2025 & 2033
- Figure 34: Japan Asia Pacific Travel Retail industry Volume Share (%), by Country 2025 & 2033
- Figure 35: Korea Asia Pacific Travel Retail industry Revenue (Million), by Product Type 2025 & 2033
- Figure 36: Korea Asia Pacific Travel Retail industry Volume (Billion), by Product Type 2025 & 2033
- Figure 37: Korea Asia Pacific Travel Retail industry Revenue Share (%), by Product Type 2025 & 2033
- Figure 38: Korea Asia Pacific Travel Retail industry Volume Share (%), by Product Type 2025 & 2033
- Figure 39: Korea Asia Pacific Travel Retail industry Revenue (Million), by Distribution Channel 2025 & 2033
- Figure 40: Korea Asia Pacific Travel Retail industry Volume (Billion), by Distribution Channel 2025 & 2033
- Figure 41: Korea Asia Pacific Travel Retail industry Revenue Share (%), by Distribution Channel 2025 & 2033
- Figure 42: Korea Asia Pacific Travel Retail industry Volume Share (%), by Distribution Channel 2025 & 2033
- Figure 43: Korea Asia Pacific Travel Retail industry Revenue (Million), by Geography 2025 & 2033
- Figure 44: Korea Asia Pacific Travel Retail industry Volume (Billion), by Geography 2025 & 2033
- Figure 45: Korea Asia Pacific Travel Retail industry Revenue Share (%), by Geography 2025 & 2033
- Figure 46: Korea Asia Pacific Travel Retail industry Volume Share (%), by Geography 2025 & 2033
- Figure 47: Korea Asia Pacific Travel Retail industry Revenue (Million), by Country 2025 & 2033
- Figure 48: Korea Asia Pacific Travel Retail industry Volume (Billion), by Country 2025 & 2033
- Figure 49: Korea Asia Pacific Travel Retail industry Revenue Share (%), by Country 2025 & 2033
- Figure 50: Korea Asia Pacific Travel Retail industry Volume Share (%), by Country 2025 & 2033
- Figure 51: India Asia Pacific Travel Retail industry Revenue (Million), by Product Type 2025 & 2033
- Figure 52: India Asia Pacific Travel Retail industry Volume (Billion), by Product Type 2025 & 2033
- Figure 53: India Asia Pacific Travel Retail industry Revenue Share (%), by Product Type 2025 & 2033
- Figure 54: India Asia Pacific Travel Retail industry Volume Share (%), by Product Type 2025 & 2033
- Figure 55: India Asia Pacific Travel Retail industry Revenue (Million), by Distribution Channel 2025 & 2033
- Figure 56: India Asia Pacific Travel Retail industry Volume (Billion), by Distribution Channel 2025 & 2033
- Figure 57: India Asia Pacific Travel Retail industry Revenue Share (%), by Distribution Channel 2025 & 2033
- Figure 58: India Asia Pacific Travel Retail industry Volume Share (%), by Distribution Channel 2025 & 2033
- Figure 59: India Asia Pacific Travel Retail industry Revenue (Million), by Geography 2025 & 2033
- Figure 60: India Asia Pacific Travel Retail industry Volume (Billion), by Geography 2025 & 2033
- Figure 61: India Asia Pacific Travel Retail industry Revenue Share (%), by Geography 2025 & 2033
- Figure 62: India Asia Pacific Travel Retail industry Volume Share (%), by Geography 2025 & 2033
- Figure 63: India Asia Pacific Travel Retail industry Revenue (Million), by Country 2025 & 2033
- Figure 64: India Asia Pacific Travel Retail industry Volume (Billion), by Country 2025 & 2033
- Figure 65: India Asia Pacific Travel Retail industry Revenue Share (%), by Country 2025 & 2033
- Figure 66: India Asia Pacific Travel Retail industry Volume Share (%), by Country 2025 & 2033
- Figure 67: Australia Asia Pacific Travel Retail industry Revenue (Million), by Product Type 2025 & 2033
- Figure 68: Australia Asia Pacific Travel Retail industry Volume (Billion), by Product Type 2025 & 2033
- Figure 69: Australia Asia Pacific Travel Retail industry Revenue Share (%), by Product Type 2025 & 2033
- Figure 70: Australia Asia Pacific Travel Retail industry Volume Share (%), by Product Type 2025 & 2033
- Figure 71: Australia Asia Pacific Travel Retail industry Revenue (Million), by Distribution Channel 2025 & 2033
- Figure 72: Australia Asia Pacific Travel Retail industry Volume (Billion), by Distribution Channel 2025 & 2033
- Figure 73: Australia Asia Pacific Travel Retail industry Revenue Share (%), by Distribution Channel 2025 & 2033
- Figure 74: Australia Asia Pacific Travel Retail industry Volume Share (%), by Distribution Channel 2025 & 2033
- Figure 75: Australia Asia Pacific Travel Retail industry Revenue (Million), by Geography 2025 & 2033
- Figure 76: Australia Asia Pacific Travel Retail industry Volume (Billion), by Geography 2025 & 2033
- Figure 77: Australia Asia Pacific Travel Retail industry Revenue Share (%), by Geography 2025 & 2033
- Figure 78: Australia Asia Pacific Travel Retail industry Volume Share (%), by Geography 2025 & 2033
- Figure 79: Australia Asia Pacific Travel Retail industry Revenue (Million), by Country 2025 & 2033
- Figure 80: Australia Asia Pacific Travel Retail industry Volume (Billion), by Country 2025 & 2033
- Figure 81: Australia Asia Pacific Travel Retail industry Revenue Share (%), by Country 2025 & 2033
- Figure 82: Australia Asia Pacific Travel Retail industry Volume Share (%), by Country 2025 & 2033
- Figure 83: Southeast Asia Asia Pacific Travel Retail industry Revenue (Million), by Product Type 2025 & 2033
- Figure 84: Southeast Asia Asia Pacific Travel Retail industry Volume (Billion), by Product Type 2025 & 2033
- Figure 85: Southeast Asia Asia Pacific Travel Retail industry Revenue Share (%), by Product Type 2025 & 2033
- Figure 86: Southeast Asia Asia Pacific Travel Retail industry Volume Share (%), by Product Type 2025 & 2033
- Figure 87: Southeast Asia Asia Pacific Travel Retail industry Revenue (Million), by Distribution Channel 2025 & 2033
- Figure 88: Southeast Asia Asia Pacific Travel Retail industry Volume (Billion), by Distribution Channel 2025 & 2033
- Figure 89: Southeast Asia Asia Pacific Travel Retail industry Revenue Share (%), by Distribution Channel 2025 & 2033
- Figure 90: Southeast Asia Asia Pacific Travel Retail industry Volume Share (%), by Distribution Channel 2025 & 2033
- Figure 91: Southeast Asia Asia Pacific Travel Retail industry Revenue (Million), by Geography 2025 & 2033
- Figure 92: Southeast Asia Asia Pacific Travel Retail industry Volume (Billion), by Geography 2025 & 2033
- Figure 93: Southeast Asia Asia Pacific Travel Retail industry Revenue Share (%), by Geography 2025 & 2033
- Figure 94: Southeast Asia Asia Pacific Travel Retail industry Volume Share (%), by Geography 2025 & 2033
- Figure 95: Southeast Asia Asia Pacific Travel Retail industry Revenue (Million), by Country 2025 & 2033
- Figure 96: Southeast Asia Asia Pacific Travel Retail industry Volume (Billion), by Country 2025 & 2033
- Figure 97: Southeast Asia Asia Pacific Travel Retail industry Revenue Share (%), by Country 2025 & 2033
- Figure 98: Southeast Asia Asia Pacific Travel Retail industry Volume Share (%), by Country 2025 & 2033
- Figure 99: Rest Of APAC Asia Pacific Travel Retail industry Revenue (Million), by Product Type 2025 & 2033
- Figure 100: Rest Of APAC Asia Pacific Travel Retail industry Volume (Billion), by Product Type 2025 & 2033
- Figure 101: Rest Of APAC Asia Pacific Travel Retail industry Revenue Share (%), by Product Type 2025 & 2033
- Figure 102: Rest Of APAC Asia Pacific Travel Retail industry Volume Share (%), by Product Type 2025 & 2033
- Figure 103: Rest Of APAC Asia Pacific Travel Retail industry Revenue (Million), by Distribution Channel 2025 & 2033
- Figure 104: Rest Of APAC Asia Pacific Travel Retail industry Volume (Billion), by Distribution Channel 2025 & 2033
- Figure 105: Rest Of APAC Asia Pacific Travel Retail industry Revenue Share (%), by Distribution Channel 2025 & 2033
- Figure 106: Rest Of APAC Asia Pacific Travel Retail industry Volume Share (%), by Distribution Channel 2025 & 2033
- Figure 107: Rest Of APAC Asia Pacific Travel Retail industry Revenue (Million), by Geography 2025 & 2033
- Figure 108: Rest Of APAC Asia Pacific Travel Retail industry Volume (Billion), by Geography 2025 & 2033
- Figure 109: Rest Of APAC Asia Pacific Travel Retail industry Revenue Share (%), by Geography 2025 & 2033
- Figure 110: Rest Of APAC Asia Pacific Travel Retail industry Volume Share (%), by Geography 2025 & 2033
- Figure 111: Rest Of APAC Asia Pacific Travel Retail industry Revenue (Million), by Country 2025 & 2033
- Figure 112: Rest Of APAC Asia Pacific Travel Retail industry Volume (Billion), by Country 2025 & 2033
- Figure 113: Rest Of APAC Asia Pacific Travel Retail industry Revenue Share (%), by Country 2025 & 2033
- Figure 114: Rest Of APAC Asia Pacific Travel Retail industry Volume Share (%), by Country 2025 & 2033
List of Tables
- Table 1: Global Asia Pacific Travel Retail industry Revenue Million Forecast, by Product Type 2020 & 2033
- Table 2: Global Asia Pacific Travel Retail industry Volume Billion Forecast, by Product Type 2020 & 2033
- Table 3: Global Asia Pacific Travel Retail industry Revenue Million Forecast, by Distribution Channel 2020 & 2033
- Table 4: Global Asia Pacific Travel Retail industry Volume Billion Forecast, by Distribution Channel 2020 & 2033
- Table 5: Global Asia Pacific Travel Retail industry Revenue Million Forecast, by Geography 2020 & 2033
- Table 6: Global Asia Pacific Travel Retail industry Volume Billion Forecast, by Geography 2020 & 2033
- Table 7: Global Asia Pacific Travel Retail industry Revenue Million Forecast, by Region 2020 & 2033
- Table 8: Global Asia Pacific Travel Retail industry Volume Billion Forecast, by Region 2020 & 2033
- Table 9: Global Asia Pacific Travel Retail industry Revenue Million Forecast, by Product Type 2020 & 2033
- Table 10: Global Asia Pacific Travel Retail industry Volume Billion Forecast, by Product Type 2020 & 2033
- Table 11: Global Asia Pacific Travel Retail industry Revenue Million Forecast, by Distribution Channel 2020 & 2033
- Table 12: Global Asia Pacific Travel Retail industry Volume Billion Forecast, by Distribution Channel 2020 & 2033
- Table 13: Global Asia Pacific Travel Retail industry Revenue Million Forecast, by Geography 2020 & 2033
- Table 14: Global Asia Pacific Travel Retail industry Volume Billion Forecast, by Geography 2020 & 2033
- Table 15: Global Asia Pacific Travel Retail industry Revenue Million Forecast, by Country 2020 & 2033
- Table 16: Global Asia Pacific Travel Retail industry Volume Billion Forecast, by Country 2020 & 2033
- Table 17: Global Asia Pacific Travel Retail industry Revenue Million Forecast, by Product Type 2020 & 2033
- Table 18: Global Asia Pacific Travel Retail industry Volume Billion Forecast, by Product Type 2020 & 2033
- Table 19: Global Asia Pacific Travel Retail industry Revenue Million Forecast, by Distribution Channel 2020 & 2033
- Table 20: Global Asia Pacific Travel Retail industry Volume Billion Forecast, by Distribution Channel 2020 & 2033
- Table 21: Global Asia Pacific Travel Retail industry Revenue Million Forecast, by Geography 2020 & 2033
- Table 22: Global Asia Pacific Travel Retail industry Volume Billion Forecast, by Geography 2020 & 2033
- Table 23: Global Asia Pacific Travel Retail industry Revenue Million Forecast, by Country 2020 & 2033
- Table 24: Global Asia Pacific Travel Retail industry Volume Billion Forecast, by Country 2020 & 2033
- Table 25: Global Asia Pacific Travel Retail industry Revenue Million Forecast, by Product Type 2020 & 2033
- Table 26: Global Asia Pacific Travel Retail industry Volume Billion Forecast, by Product Type 2020 & 2033
- Table 27: Global Asia Pacific Travel Retail industry Revenue Million Forecast, by Distribution Channel 2020 & 2033
- Table 28: Global Asia Pacific Travel Retail industry Volume Billion Forecast, by Distribution Channel 2020 & 2033
- Table 29: Global Asia Pacific Travel Retail industry Revenue Million Forecast, by Geography 2020 & 2033
- Table 30: Global Asia Pacific Travel Retail industry Volume Billion Forecast, by Geography 2020 & 2033
- Table 31: Global Asia Pacific Travel Retail industry Revenue Million Forecast, by Country 2020 & 2033
- Table 32: Global Asia Pacific Travel Retail industry Volume Billion Forecast, by Country 2020 & 2033
- Table 33: Global Asia Pacific Travel Retail industry Revenue Million Forecast, by Product Type 2020 & 2033
- Table 34: Global Asia Pacific Travel Retail industry Volume Billion Forecast, by Product Type 2020 & 2033
- Table 35: Global Asia Pacific Travel Retail industry Revenue Million Forecast, by Distribution Channel 2020 & 2033
- Table 36: Global Asia Pacific Travel Retail industry Volume Billion Forecast, by Distribution Channel 2020 & 2033
- Table 37: Global Asia Pacific Travel Retail industry Revenue Million Forecast, by Geography 2020 & 2033
- Table 38: Global Asia Pacific Travel Retail industry Volume Billion Forecast, by Geography 2020 & 2033
- Table 39: Global Asia Pacific Travel Retail industry Revenue Million Forecast, by Country 2020 & 2033
- Table 40: Global Asia Pacific Travel Retail industry Volume Billion Forecast, by Country 2020 & 2033
- Table 41: Global Asia Pacific Travel Retail industry Revenue Million Forecast, by Product Type 2020 & 2033
- Table 42: Global Asia Pacific Travel Retail industry Volume Billion Forecast, by Product Type 2020 & 2033
- Table 43: Global Asia Pacific Travel Retail industry Revenue Million Forecast, by Distribution Channel 2020 & 2033
- Table 44: Global Asia Pacific Travel Retail industry Volume Billion Forecast, by Distribution Channel 2020 & 2033
- Table 45: Global Asia Pacific Travel Retail industry Revenue Million Forecast, by Geography 2020 & 2033
- Table 46: Global Asia Pacific Travel Retail industry Volume Billion Forecast, by Geography 2020 & 2033
- Table 47: Global Asia Pacific Travel Retail industry Revenue Million Forecast, by Country 2020 & 2033
- Table 48: Global Asia Pacific Travel Retail industry Volume Billion Forecast, by Country 2020 & 2033
- Table 49: Global Asia Pacific Travel Retail industry Revenue Million Forecast, by Product Type 2020 & 2033
- Table 50: Global Asia Pacific Travel Retail industry Volume Billion Forecast, by Product Type 2020 & 2033
- Table 51: Global Asia Pacific Travel Retail industry Revenue Million Forecast, by Distribution Channel 2020 & 2033
- Table 52: Global Asia Pacific Travel Retail industry Volume Billion Forecast, by Distribution Channel 2020 & 2033
- Table 53: Global Asia Pacific Travel Retail industry Revenue Million Forecast, by Geography 2020 & 2033
- Table 54: Global Asia Pacific Travel Retail industry Volume Billion Forecast, by Geography 2020 & 2033
- Table 55: Global Asia Pacific Travel Retail industry Revenue Million Forecast, by Country 2020 & 2033
- Table 56: Global Asia Pacific Travel Retail industry Volume Billion Forecast, by Country 2020 & 2033
- Table 57: Global Asia Pacific Travel Retail industry Revenue Million Forecast, by Product Type 2020 & 2033
- Table 58: Global Asia Pacific Travel Retail industry Volume Billion Forecast, by Product Type 2020 & 2033
- Table 59: Global Asia Pacific Travel Retail industry Revenue Million Forecast, by Distribution Channel 2020 & 2033
- Table 60: Global Asia Pacific Travel Retail industry Volume Billion Forecast, by Distribution Channel 2020 & 2033
- Table 61: Global Asia Pacific Travel Retail industry Revenue Million Forecast, by Geography 2020 & 2033
- Table 62: Global Asia Pacific Travel Retail industry Volume Billion Forecast, by Geography 2020 & 2033
- Table 63: Global Asia Pacific Travel Retail industry Revenue Million Forecast, by Country 2020 & 2033
- Table 64: Global Asia Pacific Travel Retail industry Volume Billion Forecast, by Country 2020 & 2033
Frequently Asked Questions
1. What is the projected Compound Annual Growth Rate (CAGR) of the Asia Pacific Travel Retail industry?
The projected CAGR is approximately 9.21%.
2. Which companies are prominent players in the Asia Pacific Travel Retail industry?
Key companies in the market include Dufry, China duty free group co ltd, DFS Group, King Power, Heinemann Asia Pacific, Lotte Duty Free, The shilla duty free, Flemingo International, James Richardson Group, The Nuance Group**List Not Exhaustive.
3. What are the main segments of the Asia Pacific Travel Retail industry?
The market segments include Product Type, Distribution Channel, Geography.
4. Can you provide details about the market size?
The market size is estimated to be USD 63.15 Million as of 2022.
5. What are some drivers contributing to market growth?
Guaranteed Customer Base In Travel Duty-Free Shops Drives The Market; Exemption From Taxes When Goods Are Taken Out Of The Country Of Purchase Drives The Market.
6. What are the notable trends driving market growth?
High Revenue Generation From Airport Retailing Drives The Market.
7. Are there any restraints impacting market growth?
Guaranteed Customer Base In Travel Duty-Free Shops Drives The Market; Exemption From Taxes When Goods Are Taken Out Of The Country Of Purchase Drives The Market.
8. Can you provide examples of recent developments in the market?
October 2023: DFS Group, the travel retail company, developed an entertainment and shopping complex on the duty-free Hainan Island of China. This development aimed to enhance the tourism market, even during economic downturns.
9. What pricing options are available for accessing the report?
Pricing options include single-user, multi-user, and enterprise licenses priced at USD 4750, USD 5250, and USD 8750 respectively.
10. Is the market size provided in terms of value or volume?
The market size is provided in terms of value, measured in Million and volume, measured in Billion.
11. Are there any specific market keywords associated with the report?
Yes, the market keyword associated with the report is "Asia Pacific Travel Retail industry," which aids in identifying and referencing the specific market segment covered.
12. How do I determine which pricing option suits my needs best?
The pricing options vary based on user requirements and access needs. Individual users may opt for single-user licenses, while businesses requiring broader access may choose multi-user or enterprise licenses for cost-effective access to the report.
13. Are there any additional resources or data provided in the Asia Pacific Travel Retail industry report?
While the report offers comprehensive insights, it's advisable to review the specific contents or supplementary materials provided to ascertain if additional resources or data are available.
14. How can I stay updated on further developments or reports in the Asia Pacific Travel Retail industry?
To stay informed about further developments, trends, and reports in the Asia Pacific Travel Retail industry, consider subscribing to industry newsletters, following relevant companies and organizations, or regularly checking reputable industry news sources and publications.
Methodology
Step 1 - Identification of Relevant Samples Size from Population Database


Step 2 - Approaches for Defining Global Market Size (Value, Volume* & Price*)

Note*: In applicable scenarios
Step 3 - Data Sources
Primary Research
- Web Analytics
- Survey Reports
- Research Institute
- Latest Research Reports
- Opinion Leaders
Secondary Research
- Annual Reports
- White Paper
- Latest Press Release
- Industry Association
- Paid Database
- Investor Presentations

Step 4 - Data Triangulation
Involves using different sources of information in order to increase the validity of a study
These sources are likely to be stakeholders in a program - participants, other researchers, program staff, other community members, and so on.
Then we put all data in single framework & apply various statistical tools to find out the dynamic on the market.
During the analysis stage, feedback from the stakeholder groups would be compared to determine areas of agreement as well as areas of divergence