

Key Insights
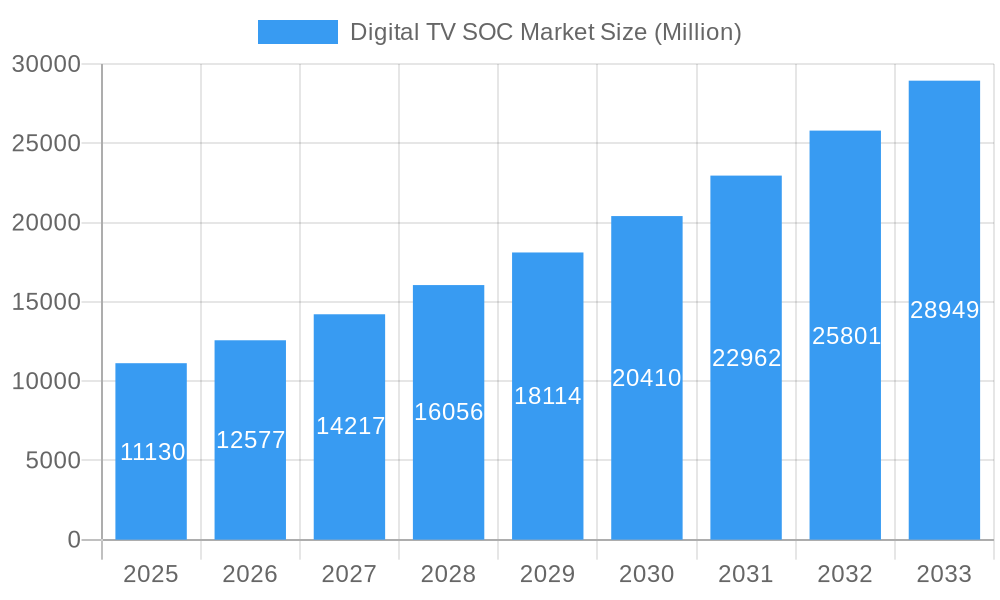
The global Digital TV System-on-Chip (SOC) market is poised for robust expansion, projected to reach an impressive $11.13 billion by 2025, with a significant Compound Annual Growth Rate (CAGR) of 12.90% expected throughout the forecast period of 2025-2033. This substantial growth is primarily fueled by the relentless consumer demand for enhanced viewing experiences, characterized by higher resolutions, smarter functionalities, and seamless connectivity. The proliferation of advanced display technologies such as LCD, LED, OLED, and QLED is a key driver, as each necessitates sophisticated SOCs to manage their intricate processing and display rendering capabilities. Furthermore, the increasing adoption of smart TVs in both residential and commercial sectors, driven by the desire for integrated streaming services, gaming, and interactive content, is creating a substantial market opportunity. The “Other End Users” segment, which can encompass sectors like hospitality, education, and digital signage, is also anticipated to contribute to market growth as these industries increasingly leverage advanced display solutions.
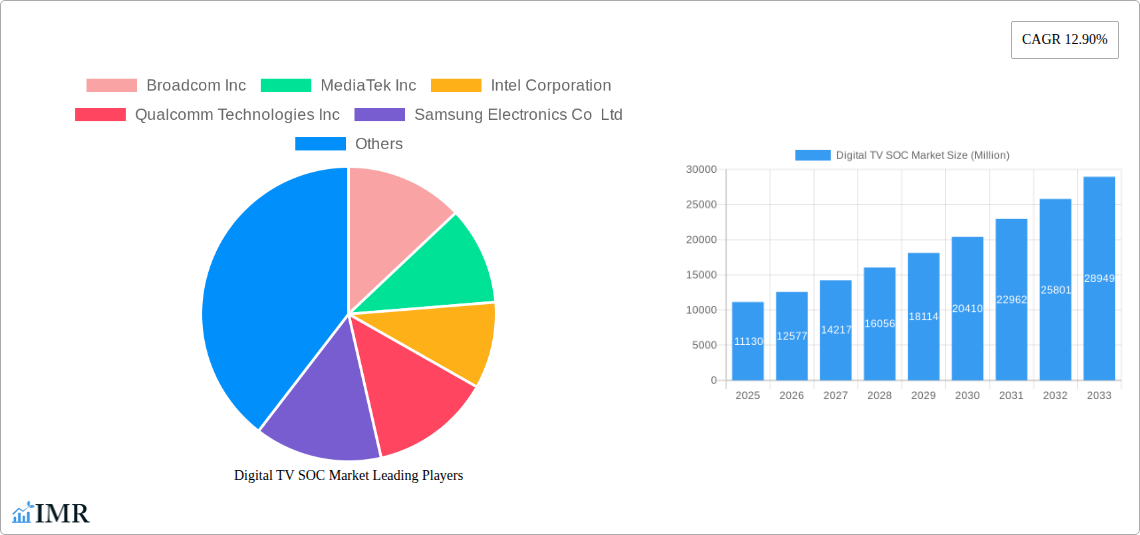
Digital TV SOC Market Market Size (In Billion)
The market landscape is dynamic, with innovation in video processing, AI integration for personalized content recommendations, and energy efficiency in SOC design emerging as critical trends. Companies are investing heavily in R&D to deliver SOCs that support the latest video codecs (like AV1), enable higher refresh rates for smoother motion, and integrate advanced audio processing for immersive sound. However, the market is not without its restraints. Intense competition among key players, including Broadcom Inc., MediaTek Inc., Intel Corporation, Qualcomm Technologies Inc., and Samsung Electronics Co. Ltd., can lead to price pressures. Additionally, the ongoing global semiconductor supply chain challenges, though potentially easing, could still present hurdles in terms of component availability and lead times. Nonetheless, the overarching trend towards digital transformation and the insatiable appetite for premium entertainment are expected to propel the Digital TV SOC market to new heights, solidifying its importance in the modern media ecosystem.
Digital TV SOC Market Company Market Share
Digital TV SOC Market: Comprehensive Analysis and Future Outlook (2019-2033)
This in-depth report provides a detailed analysis of the global Digital TV SoC market, forecasting significant growth and evolution driven by technological advancements and changing consumer demands. The report covers the historical period from 2019-2024, with a base and estimated year of 2025, and projects market trends through 2033. Leveraging extensive research, this report offers actionable insights for stakeholders across the digital television ecosystem, including semiconductor manufacturers, TV brands, content providers, and technology investors. The market dynamics, growth trajectories, competitive landscape, and emerging opportunities within the Digital TV SoC sector are meticulously examined.
Digital TV SOC Market Dynamics & Structure
The Digital TV SoC market is characterized by a dynamic interplay of technological innovation, evolving consumer preferences, and a competitive manufacturing landscape. Market concentration is moderate, with key players like Broadcom Inc., MediaTek Inc., and Samsung Electronics Co Ltd. holding significant market share, particularly in the premium segments. The primary driver of technological innovation is the relentless pursuit of enhanced viewing experiences, including higher resolutions (4K, 8K), advanced HDR formats, and improved processing power for smart TV functionalities and gaming. Regulatory frameworks, while generally supportive of technological advancement, can influence product development through standards for energy efficiency and digital broadcasting. Competitive product substitutes, such as streaming devices and separate gaming consoles, exert pressure on traditional TV manufacturers, pushing SoC providers to integrate more versatile functionalities. End-user demographics are shifting towards a younger, tech-savvy population demanding seamless connectivity and rich multimedia content. Merger and acquisition trends are anticipated to consolidate the market further, with larger entities acquiring innovative startups to gain access to cutting-edge technologies.
- Market Concentration: Moderate, with a few dominant players and several niche providers.
- Technological Innovation Drivers: 4K/8K resolution, HDR, AI-powered features, increased processing power, energy efficiency.
- Regulatory Frameworks: Evolving standards for digital broadcasting, energy consumption, and data privacy.
- Competitive Product Substitutes: Smart streaming devices, gaming consoles, PC-based entertainment.
- End-User Demographics: Growing demand for integrated smart TV features, high-quality audio-visual experiences, and seamless connectivity.
- M&A Trends: Consolidation expected as companies seek to expand their technological portfolios and market reach.
Digital TV SOC Market Growth Trends & Insights
The Digital TV SoC market is poised for robust growth, fueled by escalating consumer demand for immersive and interactive television experiences. The market is projected to witness a Compound Annual Growth Rate (CAGR) of approximately 7.5% during the forecast period (2025-2033), reaching an estimated market size of over 750 Million units by 2033. This expansion is underpinned by the increasing penetration of smart TVs, the adoption of higher resolution displays (4K and 8K), and the integration of advanced features such as artificial intelligence (AI) for personalized content recommendations and voice control. The shift towards energy-efficient designs, driven by global sustainability initiatives, is also a significant growth catalyst.
Technological disruptions, particularly in the realm of display technologies like OLED and QLED, are creating new opportunities for SoC manufacturers to develop specialized chips capable of driving these advanced screens with superior color accuracy and contrast ratios. Consumer behavior is rapidly evolving, with a growing preference for integrated smart TV platforms over external streaming devices. This trend necessitates SoCs that can handle complex operating systems, high-bandwidth streaming, and seamless multitasking. The increasing demand for gaming on TVs also requires SoCs with powerful graphics processing units (GPUs) and low latency.
- Market Size Evolution: Projected to grow from an estimated 400 Million units in 2025 to over 750 Million units by 2033.
- CAGR: Approximately 7.5% during the forecast period (2025-2033).
- Adoption Rates: Steadily increasing smart TV penetration globally, especially in emerging economies.
- Technological Disruptions: Advancements in AI, 5G integration, and next-generation display technologies.
- Consumer Behavior Shifts: Growing preference for all-in-one smart TV solutions, immersive gaming experiences, and personalized content delivery.
Dominant Regions, Countries, or Segments in Digital TV SOC Market
The Residential end-user segment is projected to be the dominant force driving the Digital TV SoC market throughout the forecast period, accounting for an estimated 85% of the total market share in 2025. This dominance stems from the widespread adoption of smart televisions in households globally, where consumers increasingly seek integrated entertainment solutions. The proliferation of connected devices and the growing demand for high-definition content, including streaming services and online gaming, further solidify the residential sector's lead.
Within the application segments, LED and OLED displays are expected to exhibit the most substantial growth, driven by their superior picture quality and energy efficiency. While LCDs remain a significant segment due to their cost-effectiveness, the discerning consumer preference for richer colors, deeper blacks, and faster response times is propelling the adoption of OLED and QLED technologies. This, in turn, spurs demand for sophisticated SoCs capable of fully leveraging the capabilities of these advanced display types.
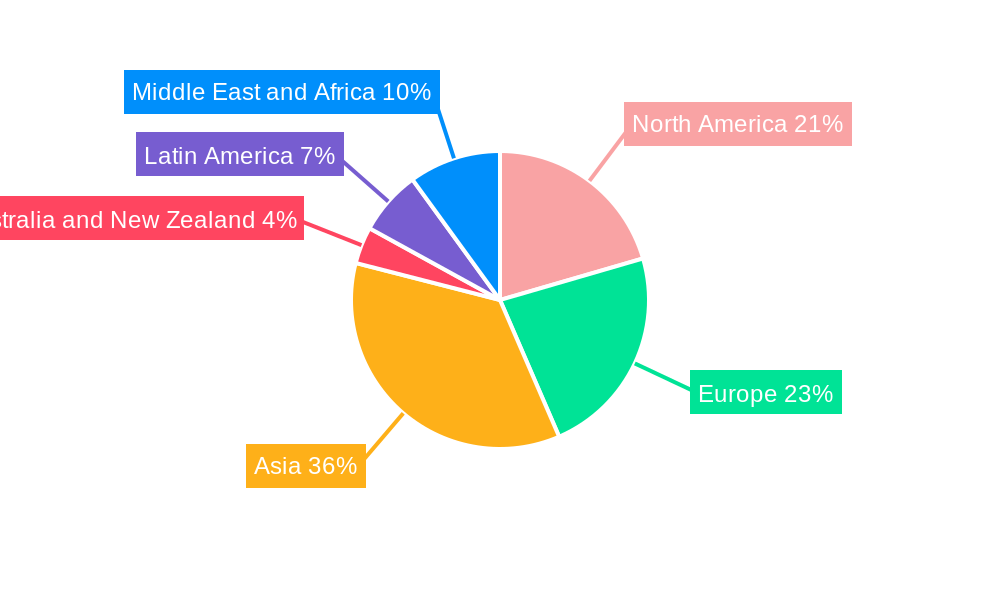
Geographically, Asia Pacific is anticipated to emerge as the leading region, driven by robust economic growth, a burgeoning middle class, and the rapid expansion of the consumer electronics manufacturing base. Countries like China, South Korea, and India are major consumers and producers of digital televisions, making the region a critical hub for the Digital TV SoC market. Government initiatives promoting digital infrastructure and increasing disposable incomes are further accelerating market growth in this region.
- Dominant End User: Residential (estimated 85% market share in 2025).
- Key Drivers: Widespread smart TV adoption, demand for integrated entertainment, growth of streaming services and online gaming, increasing disposable incomes.
- Dominant Application Segments (Growth): LED and OLED displays.
- Key Drivers: Demand for superior picture quality (color, contrast, response time), energy efficiency, technological advancements in panel technology.
- Dominant Region: Asia Pacific.
- Key Drivers: Rapid economic growth, expanding middle class, strong consumer electronics manufacturing base, government support for digital infrastructure, increasing disposable incomes.
Digital TV SOC Market Product Landscape
The Digital TV SoC product landscape is defined by continuous innovation focused on delivering superior visual and auditory experiences, seamless connectivity, and enhanced user interaction. Leading manufacturers are differentiating their offerings through advanced processing architectures that support 4K and 8K video decoding, High Dynamic Range (HDR) processing, and immersive audio technologies. Integration of AI capabilities for intelligent picture enhancement, voice control, and personalized recommendations is a key trend. Furthermore, SoCs are increasingly designed with energy efficiency in mind, meeting stringent global environmental standards. The focus on gaming performance, with low-latency processing and integrated GPUs, is also a significant product development area, catering to the growing trend of playing video games on televisions.
Key Drivers, Barriers & Challenges in Digital TV SOC Market
Key Drivers:
- Technological Advancements: The relentless evolution of display technologies (4K, 8K, OLED, QLED) necessitates increasingly powerful and feature-rich SoCs.
- Growing Demand for Smart TV Features: Consumers' increasing reliance on smart TV functionalities for streaming, apps, and connectivity drives the demand for integrated SoCs.
- Emergence of 5G: The deployment of 5G networks promises higher bandwidth and lower latency, enabling richer streaming experiences and new interactive applications, requiring advanced SoCs.
- Gaming on TV: The rise of cloud gaming and console gaming on larger screens boosts the demand for SoCs with superior graphics processing and low latency.
- Energy Efficiency Regulations: Global mandates for reduced energy consumption are pushing SoC manufacturers to develop more power-efficient designs.
Barriers & Challenges:
- Supply Chain Disruptions: Geopolitical factors and global events can lead to component shortages and increased manufacturing costs, impacting production and pricing.
- Intense Competition: The market is highly competitive, with pressure on pricing and the need for continuous innovation to maintain market share.
- Rising R&D Costs: Developing cutting-edge SoCs requires significant investment in research and development, posing a barrier for smaller players.
- Standardization Challenges: The fragmented nature of broadcasting standards and content formats can create complexities for SoC design and compatibility.
- Economic Downturns: Global economic slowdowns can impact consumer spending on high-end electronics, affecting demand for premium Digital TV SoCs.
Emerging Opportunities in Digital TV SOC Market
Emerging opportunities in the Digital TV SoC market lie in the integration of advanced AI functionalities for personalized user experiences, including predictive content delivery and enhanced smart home integration. The burgeoning market for 8K televisions, despite its nascent stage, presents a significant growth avenue for SoCs capable of handling the immense data processing demands. The increasing adoption of quantum dot and Micro-LED display technologies will also create a demand for specialized SoCs with tailored performance characteristics. Furthermore, the intersection of gaming and television, with the rise of cloud gaming platforms, offers substantial potential for SoCs optimized for low latency and high-fidelity graphics. Expansion into emerging economies with growing disposable incomes and increasing digital literacy also represents a significant untapped market.
Growth Accelerators in the Digital TV SOC Market Industry
Several key catalysts are accelerating growth within the Digital TV SoC industry. The continuous innovation in display technologies, such as the development of more vibrant and efficient OLED and QLED panels, directly fuels demand for corresponding SoC advancements. Strategic partnerships between SoC manufacturers and TV brands are crucial for co-developing optimized solutions, ensuring seamless integration and superior performance. The ongoing expansion of high-speed internet infrastructure, particularly fiber optics and 5G, is enabling richer streaming content and interactive services, thereby increasing the demand for powerful SoCs. Market expansion strategies, including targeting emerging economies and developing cost-effective solutions for broader market penetration, are also significant growth accelerators.
Key Players Shaping the Digital TV SOC Market Market
- Broadcom Inc.
- MediaTek Inc.
- Intel Corporation
- Qualcomm Technologies Inc.
- Samsung Electronics Co Ltd.
- STMicroelectronics NV
- Novatek Microelectronics Corp
- MStar Semiconductor Inc.
- LG Electronics Inc.
- HiSilicon
- NXP Semiconductors
Notable Milestones in Digital TV SOC Market Sector
- May 2024: MediaTek announced its Dimensity 9300+ system-on-chip (SoC), representing the company's newest advancement in processors designed for premium mobile applications. This chipset is equipped with 18 MB of L3 cache and system-level cache (SLC), and it is compatible with the latest LPDDR5T memory, achieving speeds of up to 9,600 Mbps, as well as UFS 4.0 storage. These capabilities enable the device to execute high-speed operations and multitask efficiently without sacrificing performance.
- January 2024: Videocon d2h, a direct-to-home (DTH) service provider, partnered with MStar Semiconductor. Under this collaboration, MStar Semiconductor is expected to supply its high-efficiency video codec (HEVC) H.265 system-on-chip (SoC) for Videocon's high-definition set-top boxes (STBs). MStar Semiconductor effectively integrated HEVC technology into its HD solutions, significantly optimizing bandwidth usage while delivering superior picture quality. This partnership enables operators and STB original equipment manufacturers (OEMs) to lower their development expenses and accelerate their time to market, thereby addressing the demands of the Indian market with the MStar HEVC-capable set-top box SoC solution.
In-Depth Digital TV SOC Market Market Outlook
The future outlook for the Digital TV SoC market is exceptionally bright, driven by continuous technological innovation and evolving consumer lifestyles. Growth accelerators such as the widespread adoption of AI-powered features for personalized viewing and the increasing demand for immersive gaming experiences on television will continue to shape the market. The anticipated transition to 8K resolution, coupled with advancements in display technologies like Micro-LED, will necessitate the development of even more powerful and sophisticated SoCs. Strategic alliances between semiconductor giants and leading TV manufacturers will remain pivotal in bringing these cutting-edge solutions to market efficiently. As emerging economies witness rising disposable incomes and a greater appetite for advanced home entertainment, the market penetration of Digital TV SoCs is poised for significant expansion, creating a dynamic and lucrative landscape for industry stakeholders.
Digital TV SOC Market Segmentation
-
1. Application
- 1.1. LCD
- 1.2. LED
- 1.3. OLED
- 1.4. QLED
-
2. End User
- 2.1. Residential
- 2.2. Commercial
- 2.3. Other End Users
Digital TV SOC Market Segmentation By Geography
- 1. North America
- 2. Europe
- 3. Asia
- 4. Australia and New Zealand
- 5. Latin America
- 6. Middle East and Africa
Digital TV SOC Market Regional Market Share
Geographic Coverage of Digital TV SOC Market
Digital TV SOC Market REPORT HIGHLIGHTS
| Aspects | Details |
|---|---|
| Study Period | 2020-2034 |
| Base Year | 2025 |
| Estimated Year | 2026 |
| Forecast Period | 2026-2034 |
| Historical Period | 2020-2025 |
| Growth Rate | CAGR of 12.90% from 2020-2034 |
| Segmentation |
|
Table of Contents
- 1. Introduction
- 1.1. Research Scope
- 1.2. Market Segmentation
- 1.3. Research Objective
- 1.4. Definitions and Assumptions
- 2. Executive Summary
- 2.1. Market Snapshot
- 3. Market Dynamics
- 3.1. Market Drivers
- 3.2. Market Restrains
- 3.3. Market Trends
- 3.4. Market Opportunities
- 4. Market Factor Analysis
- 4.1. Porters Five Forces
- 4.1.1. Bargaining Power of Suppliers
- 4.1.2. Bargaining Power of Buyers
- 4.1.3. Threat of New Entrants
- 4.1.4. Threat of Substitutes
- 4.1.5. Competitive Rivalry
- 4.2. PESTEL analysis
- 4.3. BCG Analysis
- 4.3.1. Stars (High Growth, High Market Share)
- 4.3.2. Cash Cows (Low Growth, High Market Share)
- 4.3.3. Question Mark (High Growth, Low Market Share)
- 4.3.4. Dogs (Low Growth, Low Market Share)
- 4.4. Ansoff Matrix Analysis
- 4.5. Supply Chain Analysis
- 4.6. Regulatory Landscape
- 4.7. Current Market Potential and Opportunity Assessment (TAM–SAM–SOM Framework)
- 4.8. IMR Analyst Note
- 4.1. Porters Five Forces
- 5. Market Analysis, Insights and Forecast 2021-2033
- 5.1. Market Analysis, Insights and Forecast - by Application
- 5.1.1. LCD
- 5.1.2. LED
- 5.1.3. OLED
- 5.1.4. QLED
- 5.2. Market Analysis, Insights and Forecast - by End User
- 5.2.1. Residential
- 5.2.2. Commercial
- 5.2.3. Other End Users
- 5.3. Market Analysis, Insights and Forecast - by Region
- 5.3.1. North America
- 5.3.2. Europe
- 5.3.3. Asia
- 5.3.4. Australia and New Zealand
- 5.3.5. Latin America
- 5.3.6. Middle East and Africa
- 5.1. Market Analysis, Insights and Forecast - by Application
- 6. Global Digital TV SOC Market Analysis, Insights and Forecast, 2021-2033
- 6.1. Market Analysis, Insights and Forecast - by Application
- 6.1.1. LCD
- 6.1.2. LED
- 6.1.3. OLED
- 6.1.4. QLED
- 6.2. Market Analysis, Insights and Forecast - by End User
- 6.2.1. Residential
- 6.2.2. Commercial
- 6.2.3. Other End Users
- 6.1. Market Analysis, Insights and Forecast - by Application
- 7. North America Digital TV SOC Market Analysis, Insights and Forecast, 2020-2032
- 7.1. Market Analysis, Insights and Forecast - by Application
- 7.1.1. LCD
- 7.1.2. LED
- 7.1.3. OLED
- 7.1.4. QLED
- 7.2. Market Analysis, Insights and Forecast - by End User
- 7.2.1. Residential
- 7.2.2. Commercial
- 7.2.3. Other End Users
- 7.1. Market Analysis, Insights and Forecast - by Application
- 8. Europe Digital TV SOC Market Analysis, Insights and Forecast, 2020-2032
- 8.1. Market Analysis, Insights and Forecast - by Application
- 8.1.1. LCD
- 8.1.2. LED
- 8.1.3. OLED
- 8.1.4. QLED
- 8.2. Market Analysis, Insights and Forecast - by End User
- 8.2.1. Residential
- 8.2.2. Commercial
- 8.2.3. Other End Users
- 8.1. Market Analysis, Insights and Forecast - by Application
- 9. Asia Digital TV SOC Market Analysis, Insights and Forecast, 2020-2032
- 9.1. Market Analysis, Insights and Forecast - by Application
- 9.1.1. LCD
- 9.1.2. LED
- 9.1.3. OLED
- 9.1.4. QLED
- 9.2. Market Analysis, Insights and Forecast - by End User
- 9.2.1. Residential
- 9.2.2. Commercial
- 9.2.3. Other End Users
- 9.1. Market Analysis, Insights and Forecast - by Application
- 10. Australia and New Zealand Digital TV SOC Market Analysis, Insights and Forecast, 2020-2032
- 10.1. Market Analysis, Insights and Forecast - by Application
- 10.1.1. LCD
- 10.1.2. LED
- 10.1.3. OLED
- 10.1.4. QLED
- 10.2. Market Analysis, Insights and Forecast - by End User
- 10.2.1. Residential
- 10.2.2. Commercial
- 10.2.3. Other End Users
- 10.1. Market Analysis, Insights and Forecast - by Application
- 11. Latin America Digital TV SOC Market Analysis, Insights and Forecast, 2020-2032
- 11.1. Market Analysis, Insights and Forecast - by Application
- 11.1.1. LCD
- 11.1.2. LED
- 11.1.3. OLED
- 11.1.4. QLED
- 11.2. Market Analysis, Insights and Forecast - by End User
- 11.2.1. Residential
- 11.2.2. Commercial
- 11.2.3. Other End Users
- 11.1. Market Analysis, Insights and Forecast - by Application
- 12. Middle East and Africa Digital TV SOC Market Analysis, Insights and Forecast, 2020-2032
- 12.1. Market Analysis, Insights and Forecast - by Application
- 12.1.1. LCD
- 12.1.2. LED
- 12.1.3. OLED
- 12.1.4. QLED
- 12.2. Market Analysis, Insights and Forecast - by End User
- 12.2.1. Residential
- 12.2.2. Commercial
- 12.2.3. Other End Users
- 12.1. Market Analysis, Insights and Forecast - by Application
- 13. Competitive Analysis
- 13.1. Company Profiles
- 13.1.1 Broadcom Inc
- 13.1.1.1. Company Overview
- 13.1.1.2. Products
- 13.1.1.3. Company Financials
- 13.1.1.4. SWOT Analysis
- 13.1.2 MediaTek Inc
- 13.1.2.1. Company Overview
- 13.1.2.2. Products
- 13.1.2.3. Company Financials
- 13.1.2.4. SWOT Analysis
- 13.1.3 Intel Corporation
- 13.1.3.1. Company Overview
- 13.1.3.2. Products
- 13.1.3.3. Company Financials
- 13.1.3.4. SWOT Analysis
- 13.1.4 Qualcomm Technologies Inc
- 13.1.4.1. Company Overview
- 13.1.4.2. Products
- 13.1.4.3. Company Financials
- 13.1.4.4. SWOT Analysis
- 13.1.5 Samsung Electronics Co Ltd
- 13.1.5.1. Company Overview
- 13.1.5.2. Products
- 13.1.5.3. Company Financials
- 13.1.5.4. SWOT Analysis
- 13.1.6 STMicroelectronics NV
- 13.1.6.1. Company Overview
- 13.1.6.2. Products
- 13.1.6.3. Company Financials
- 13.1.6.4. SWOT Analysis
- 13.1.7 Novatek Microelectronics Corp
- 13.1.7.1. Company Overview
- 13.1.7.2. Products
- 13.1.7.3. Company Financials
- 13.1.7.4. SWOT Analysis
- 13.1.8 MStar Semiconductor Inc
- 13.1.8.1. Company Overview
- 13.1.8.2. Products
- 13.1.8.3. Company Financials
- 13.1.8.4. SWOT Analysis
- 13.1.9 LG Electronics Inc
- 13.1.9.1. Company Overview
- 13.1.9.2. Products
- 13.1.9.3. Company Financials
- 13.1.9.4. SWOT Analysis
- 13.1.10 HiSilicon
- 13.1.10.1. Company Overview
- 13.1.10.2. Products
- 13.1.10.3. Company Financials
- 13.1.10.4. SWOT Analysis
- 13.1.11 NXP Semiconductors*List Not Exhaustive
- 13.1.11.1. Company Overview
- 13.1.11.2. Products
- 13.1.11.3. Company Financials
- 13.1.11.4. SWOT Analysis
- 13.1.1 Broadcom Inc
- 13.2. Market Entropy
- 13.2.1 Company's Key Areas Served
- 13.2.2 Recent Developments
- 13.3. Company Market Share Analysis 2025
- 13.3.1 Top 5 Companies Market Share Analysis
- 13.3.2 Top 3 Companies Market Share Analysis
- 13.4. List of Potential Customers
- 14. Research Methodology
List of Figures
- Figure 1: Global Digital TV SOC Market Revenue Breakdown (Million, %) by Region 2025 & 2033
- Figure 2: Global Digital TV SOC Market Volume Breakdown (Billion, %) by Region 2025 & 2033
- Figure 3: North America Digital TV SOC Market Revenue (Million), by Application 2025 & 2033
- Figure 4: North America Digital TV SOC Market Volume (Billion), by Application 2025 & 2033
- Figure 5: North America Digital TV SOC Market Revenue Share (%), by Application 2025 & 2033
- Figure 6: North America Digital TV SOC Market Volume Share (%), by Application 2025 & 2033
- Figure 7: North America Digital TV SOC Market Revenue (Million), by End User 2025 & 2033
- Figure 8: North America Digital TV SOC Market Volume (Billion), by End User 2025 & 2033
- Figure 9: North America Digital TV SOC Market Revenue Share (%), by End User 2025 & 2033
- Figure 10: North America Digital TV SOC Market Volume Share (%), by End User 2025 & 2033
- Figure 11: North America Digital TV SOC Market Revenue (Million), by Country 2025 & 2033
- Figure 12: North America Digital TV SOC Market Volume (Billion), by Country 2025 & 2033
- Figure 13: North America Digital TV SOC Market Revenue Share (%), by Country 2025 & 2033
- Figure 14: North America Digital TV SOC Market Volume Share (%), by Country 2025 & 2033
- Figure 15: Europe Digital TV SOC Market Revenue (Million), by Application 2025 & 2033
- Figure 16: Europe Digital TV SOC Market Volume (Billion), by Application 2025 & 2033
- Figure 17: Europe Digital TV SOC Market Revenue Share (%), by Application 2025 & 2033
- Figure 18: Europe Digital TV SOC Market Volume Share (%), by Application 2025 & 2033
- Figure 19: Europe Digital TV SOC Market Revenue (Million), by End User 2025 & 2033
- Figure 20: Europe Digital TV SOC Market Volume (Billion), by End User 2025 & 2033
- Figure 21: Europe Digital TV SOC Market Revenue Share (%), by End User 2025 & 2033
- Figure 22: Europe Digital TV SOC Market Volume Share (%), by End User 2025 & 2033
- Figure 23: Europe Digital TV SOC Market Revenue (Million), by Country 2025 & 2033
- Figure 24: Europe Digital TV SOC Market Volume (Billion), by Country 2025 & 2033
- Figure 25: Europe Digital TV SOC Market Revenue Share (%), by Country 2025 & 2033
- Figure 26: Europe Digital TV SOC Market Volume Share (%), by Country 2025 & 2033
- Figure 27: Asia Digital TV SOC Market Revenue (Million), by Application 2025 & 2033
- Figure 28: Asia Digital TV SOC Market Volume (Billion), by Application 2025 & 2033
- Figure 29: Asia Digital TV SOC Market Revenue Share (%), by Application 2025 & 2033
- Figure 30: Asia Digital TV SOC Market Volume Share (%), by Application 2025 & 2033
- Figure 31: Asia Digital TV SOC Market Revenue (Million), by End User 2025 & 2033
- Figure 32: Asia Digital TV SOC Market Volume (Billion), by End User 2025 & 2033
- Figure 33: Asia Digital TV SOC Market Revenue Share (%), by End User 2025 & 2033
- Figure 34: Asia Digital TV SOC Market Volume Share (%), by End User 2025 & 2033
- Figure 35: Asia Digital TV SOC Market Revenue (Million), by Country 2025 & 2033
- Figure 36: Asia Digital TV SOC Market Volume (Billion), by Country 2025 & 2033
- Figure 37: Asia Digital TV SOC Market Revenue Share (%), by Country 2025 & 2033
- Figure 38: Asia Digital TV SOC Market Volume Share (%), by Country 2025 & 2033
- Figure 39: Australia and New Zealand Digital TV SOC Market Revenue (Million), by Application 2025 & 2033
- Figure 40: Australia and New Zealand Digital TV SOC Market Volume (Billion), by Application 2025 & 2033
- Figure 41: Australia and New Zealand Digital TV SOC Market Revenue Share (%), by Application 2025 & 2033
- Figure 42: Australia and New Zealand Digital TV SOC Market Volume Share (%), by Application 2025 & 2033
- Figure 43: Australia and New Zealand Digital TV SOC Market Revenue (Million), by End User 2025 & 2033
- Figure 44: Australia and New Zealand Digital TV SOC Market Volume (Billion), by End User 2025 & 2033
- Figure 45: Australia and New Zealand Digital TV SOC Market Revenue Share (%), by End User 2025 & 2033
- Figure 46: Australia and New Zealand Digital TV SOC Market Volume Share (%), by End User 2025 & 2033
- Figure 47: Australia and New Zealand Digital TV SOC Market Revenue (Million), by Country 2025 & 2033
- Figure 48: Australia and New Zealand Digital TV SOC Market Volume (Billion), by Country 2025 & 2033
- Figure 49: Australia and New Zealand Digital TV SOC Market Revenue Share (%), by Country 2025 & 2033
- Figure 50: Australia and New Zealand Digital TV SOC Market Volume Share (%), by Country 2025 & 2033
- Figure 51: Latin America Digital TV SOC Market Revenue (Million), by Application 2025 & 2033
- Figure 52: Latin America Digital TV SOC Market Volume (Billion), by Application 2025 & 2033
- Figure 53: Latin America Digital TV SOC Market Revenue Share (%), by Application 2025 & 2033
- Figure 54: Latin America Digital TV SOC Market Volume Share (%), by Application 2025 & 2033
- Figure 55: Latin America Digital TV SOC Market Revenue (Million), by End User 2025 & 2033
- Figure 56: Latin America Digital TV SOC Market Volume (Billion), by End User 2025 & 2033
- Figure 57: Latin America Digital TV SOC Market Revenue Share (%), by End User 2025 & 2033
- Figure 58: Latin America Digital TV SOC Market Volume Share (%), by End User 2025 & 2033
- Figure 59: Latin America Digital TV SOC Market Revenue (Million), by Country 2025 & 2033
- Figure 60: Latin America Digital TV SOC Market Volume (Billion), by Country 2025 & 2033
- Figure 61: Latin America Digital TV SOC Market Revenue Share (%), by Country 2025 & 2033
- Figure 62: Latin America Digital TV SOC Market Volume Share (%), by Country 2025 & 2033
- Figure 63: Middle East and Africa Digital TV SOC Market Revenue (Million), by Application 2025 & 2033
- Figure 64: Middle East and Africa Digital TV SOC Market Volume (Billion), by Application 2025 & 2033
- Figure 65: Middle East and Africa Digital TV SOC Market Revenue Share (%), by Application 2025 & 2033
- Figure 66: Middle East and Africa Digital TV SOC Market Volume Share (%), by Application 2025 & 2033
- Figure 67: Middle East and Africa Digital TV SOC Market Revenue (Million), by End User 2025 & 2033
- Figure 68: Middle East and Africa Digital TV SOC Market Volume (Billion), by End User 2025 & 2033
- Figure 69: Middle East and Africa Digital TV SOC Market Revenue Share (%), by End User 2025 & 2033
- Figure 70: Middle East and Africa Digital TV SOC Market Volume Share (%), by End User 2025 & 2033
- Figure 71: Middle East and Africa Digital TV SOC Market Revenue (Million), by Country 2025 & 2033
- Figure 72: Middle East and Africa Digital TV SOC Market Volume (Billion), by Country 2025 & 2033
- Figure 73: Middle East and Africa Digital TV SOC Market Revenue Share (%), by Country 2025 & 2033
- Figure 74: Middle East and Africa Digital TV SOC Market Volume Share (%), by Country 2025 & 2033
List of Tables
- Table 1: Global Digital TV SOC Market Revenue Million Forecast, by Application 2020 & 2033
- Table 2: Global Digital TV SOC Market Volume Billion Forecast, by Application 2020 & 2033
- Table 3: Global Digital TV SOC Market Revenue Million Forecast, by End User 2020 & 2033
- Table 4: Global Digital TV SOC Market Volume Billion Forecast, by End User 2020 & 2033
- Table 5: Global Digital TV SOC Market Revenue Million Forecast, by Region 2020 & 2033
- Table 6: Global Digital TV SOC Market Volume Billion Forecast, by Region 2020 & 2033
- Table 7: Global Digital TV SOC Market Revenue Million Forecast, by Application 2020 & 2033
- Table 8: Global Digital TV SOC Market Volume Billion Forecast, by Application 2020 & 2033
- Table 9: Global Digital TV SOC Market Revenue Million Forecast, by End User 2020 & 2033
- Table 10: Global Digital TV SOC Market Volume Billion Forecast, by End User 2020 & 2033
- Table 11: Global Digital TV SOC Market Revenue Million Forecast, by Country 2020 & 2033
- Table 12: Global Digital TV SOC Market Volume Billion Forecast, by Country 2020 & 2033
- Table 13: Global Digital TV SOC Market Revenue Million Forecast, by Application 2020 & 2033
- Table 14: Global Digital TV SOC Market Volume Billion Forecast, by Application 2020 & 2033
- Table 15: Global Digital TV SOC Market Revenue Million Forecast, by End User 2020 & 2033
- Table 16: Global Digital TV SOC Market Volume Billion Forecast, by End User 2020 & 2033
- Table 17: Global Digital TV SOC Market Revenue Million Forecast, by Country 2020 & 2033
- Table 18: Global Digital TV SOC Market Volume Billion Forecast, by Country 2020 & 2033
- Table 19: Global Digital TV SOC Market Revenue Million Forecast, by Application 2020 & 2033
- Table 20: Global Digital TV SOC Market Volume Billion Forecast, by Application 2020 & 2033
- Table 21: Global Digital TV SOC Market Revenue Million Forecast, by End User 2020 & 2033
- Table 22: Global Digital TV SOC Market Volume Billion Forecast, by End User 2020 & 2033
- Table 23: Global Digital TV SOC Market Revenue Million Forecast, by Country 2020 & 2033
- Table 24: Global Digital TV SOC Market Volume Billion Forecast, by Country 2020 & 2033
- Table 25: Global Digital TV SOC Market Revenue Million Forecast, by Application 2020 & 2033
- Table 26: Global Digital TV SOC Market Volume Billion Forecast, by Application 2020 & 2033
- Table 27: Global Digital TV SOC Market Revenue Million Forecast, by End User 2020 & 2033
- Table 28: Global Digital TV SOC Market Volume Billion Forecast, by End User 2020 & 2033
- Table 29: Global Digital TV SOC Market Revenue Million Forecast, by Country 2020 & 2033
- Table 30: Global Digital TV SOC Market Volume Billion Forecast, by Country 2020 & 2033
- Table 31: Global Digital TV SOC Market Revenue Million Forecast, by Application 2020 & 2033
- Table 32: Global Digital TV SOC Market Volume Billion Forecast, by Application 2020 & 2033
- Table 33: Global Digital TV SOC Market Revenue Million Forecast, by End User 2020 & 2033
- Table 34: Global Digital TV SOC Market Volume Billion Forecast, by End User 2020 & 2033
- Table 35: Global Digital TV SOC Market Revenue Million Forecast, by Country 2020 & 2033
- Table 36: Global Digital TV SOC Market Volume Billion Forecast, by Country 2020 & 2033
- Table 37: Global Digital TV SOC Market Revenue Million Forecast, by Application 2020 & 2033
- Table 38: Global Digital TV SOC Market Volume Billion Forecast, by Application 2020 & 2033
- Table 39: Global Digital TV SOC Market Revenue Million Forecast, by End User 2020 & 2033
- Table 40: Global Digital TV SOC Market Volume Billion Forecast, by End User 2020 & 2033
- Table 41: Global Digital TV SOC Market Revenue Million Forecast, by Country 2020 & 2033
- Table 42: Global Digital TV SOC Market Volume Billion Forecast, by Country 2020 & 2033
Frequently Asked Questions
1. What is the projected Compound Annual Growth Rate (CAGR) of the Digital TV SOC Market?
The projected CAGR is approximately 12.90%.
2. Which companies are prominent players in the Digital TV SOC Market?
Key companies in the market include Broadcom Inc, MediaTek Inc, Intel Corporation, Qualcomm Technologies Inc, Samsung Electronics Co Ltd, STMicroelectronics NV, Novatek Microelectronics Corp, MStar Semiconductor Inc, LG Electronics Inc, HiSilicon, NXP Semiconductors*List Not Exhaustive.
3. What are the main segments of the Digital TV SOC Market?
The market segments include Application, End User.
4. Can you provide details about the market size?
The market size is estimated to be USD 11.13 Million as of 2022.
5. What are some drivers contributing to market growth?
Increasing Demand for Smart TVs Will Drive the Market Growth; Rising Consumer Demand for High-definition and Ultra-high-definition (UHD) Content.
6. What are the notable trends driving market growth?
The Commercial Segment is Expected to Hold a Significant Market Share.
7. Are there any restraints impacting market growth?
Increasing Demand for Smart TVs Will Drive the Market Growth; Rising Consumer Demand for High-definition and Ultra-high-definition (UHD) Content.
8. Can you provide examples of recent developments in the market?
May 2024: MediaTek announced its Dimensity 9300+ system-on-chip (SoC), representing the company's newest advancement in processors designed for premium mobile applications. This chipset is equipped with 18 MB of L3 cache and system-level cache (SLC), and it is compatible with the latest LPDDR5T memory, achieving speeds of up to 9,600 Mbps, as well as UFS 4.0 storage. These capabilities enable the device to execute high-speed operations and multitask efficiently without sacrificing performance.January 2024: Videocon d2h, a direct-to-home (DTH) service provider, partnered with MStar Semiconductor. Under this collaboration, MStar Semiconductor is expected to supply its high-efficiency video codec (HEVC) H.265 system-on-chip (SoC) for Videocon's high-definition set-top boxes (STBs). MStar Semiconductor effectively integrated HEVC technology into its HD solutions, significantly optimizing bandwidth usage while delivering superior picture quality. This partnership enables operators and STB original equipment manufacturers (OEMs) to lower their development expenses and accelerate their time to market, thereby addressing the demands of the Indian market with the MStar HEVC-capable set-top box SoC solution.
9. What pricing options are available for accessing the report?
Pricing options include single-user, multi-user, and enterprise licenses priced at USD 4750, USD 5250, and USD 8750 respectively.
10. Is the market size provided in terms of value or volume?
The market size is provided in terms of value, measured in Million and volume, measured in Billion.
11. Are there any specific market keywords associated with the report?
Yes, the market keyword associated with the report is "Digital TV SOC Market," which aids in identifying and referencing the specific market segment covered.
12. How do I determine which pricing option suits my needs best?
The pricing options vary based on user requirements and access needs. Individual users may opt for single-user licenses, while businesses requiring broader access may choose multi-user or enterprise licenses for cost-effective access to the report.
13. Are there any additional resources or data provided in the Digital TV SOC Market report?
While the report offers comprehensive insights, it's advisable to review the specific contents or supplementary materials provided to ascertain if additional resources or data are available.
14. How can I stay updated on further developments or reports in the Digital TV SOC Market?
To stay informed about further developments, trends, and reports in the Digital TV SOC Market, consider subscribing to industry newsletters, following relevant companies and organizations, or regularly checking reputable industry news sources and publications.
Methodology
Step 1 - Identification of Relevant Samples Size from Population Database


Step 2 - Approaches for Defining Global Market Size (Value, Volume* & Price*)

Note*: In applicable scenarios
Step 3 - Data Sources
Primary Research
- Web Analytics
- Survey Reports
- Research Institute
- Latest Research Reports
- Opinion Leaders
Secondary Research
- Annual Reports
- White Paper
- Latest Press Release
- Industry Association
- Paid Database
- Investor Presentations

Step 4 - Data Triangulation
Involves using different sources of information in order to increase the validity of a study
These sources are likely to be stakeholders in a program - participants, other researchers, program staff, other community members, and so on.
Then we put all data in single framework & apply various statistical tools to find out the dynamic on the market.
During the analysis stage, feedback from the stakeholder groups would be compared to determine areas of agreement as well as areas of divergence