

Key Insights
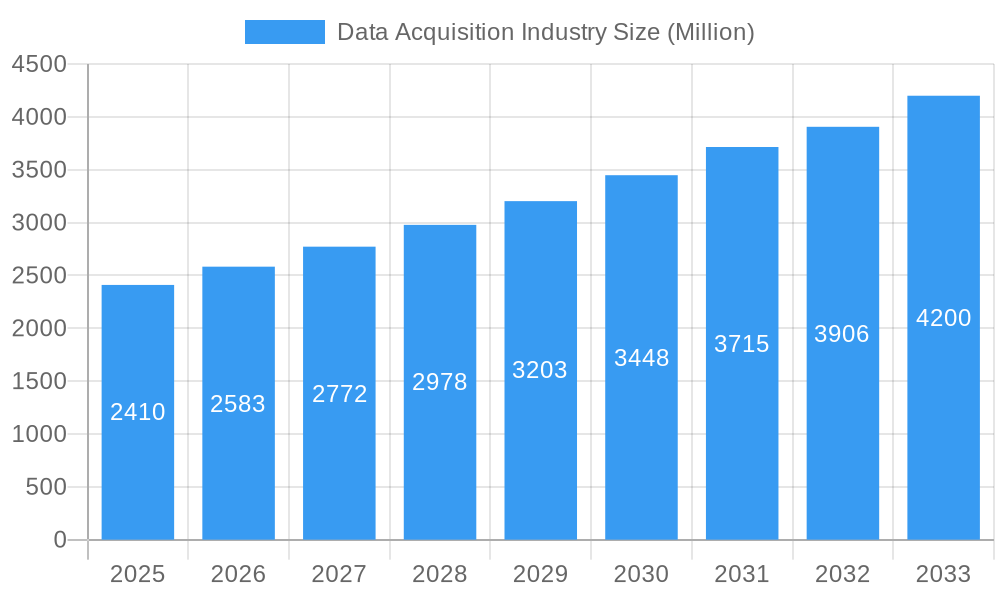
The Data Acquisition (DAQ) industry, valued at $2.41 billion in 2025, is experiencing robust growth, projected to expand at a Compound Annual Growth Rate (CAGR) of 7.10% from 2025 to 2033. This growth is fueled by several key drivers. The increasing adoption of automation and Industry 4.0 initiatives across various sectors, including manufacturing, automotive, and energy, is significantly boosting demand for DAQ systems. Furthermore, the rising need for real-time data analysis and predictive maintenance is propelling the market forward. Advancements in sensor technology, offering higher accuracy and improved data transmission capabilities, are also contributing to market expansion. The software segment within DAQ is expected to witness faster growth compared to the hardware segment due to increasing demand for sophisticated data analysis and visualization tools. Geographically, North America currently holds a significant market share, driven by strong technological advancements and the presence of major industry players. However, the Asia-Pacific region is expected to witness the fastest growth in the coming years, propelled by rapid industrialization and infrastructure development in countries like China and India.
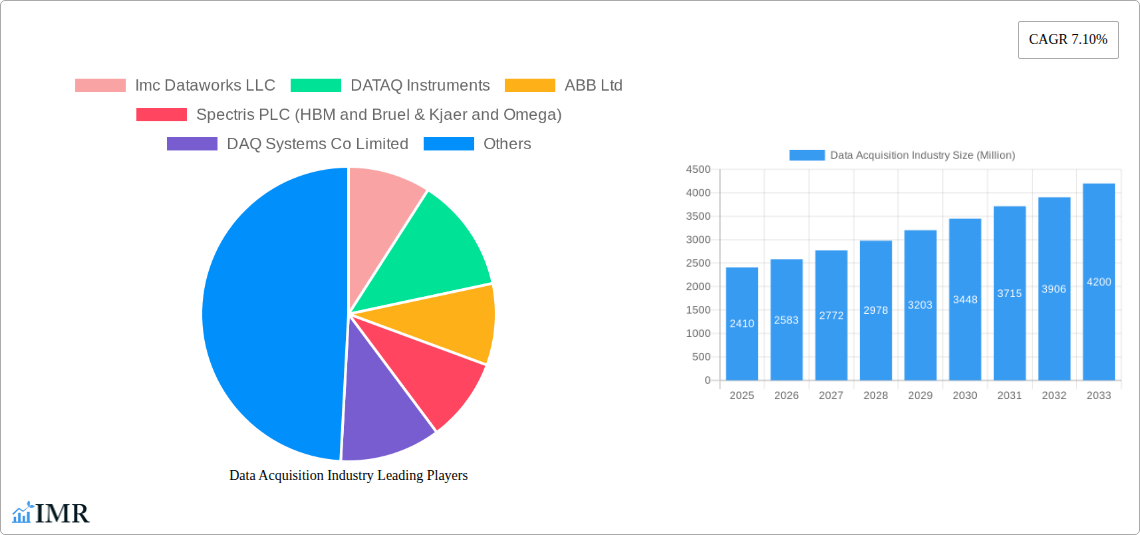
Data Acquisition Industry Market Size (In Billion)
Despite the positive outlook, the DAQ market faces certain challenges. High initial investment costs for advanced DAQ systems can act as a restraint, particularly for small and medium-sized enterprises (SMEs). The complexity of integrating DAQ systems with existing infrastructure and the need for specialized expertise can also hinder broader adoption. However, the increasing availability of user-friendly software and cloud-based solutions is expected to mitigate these challenges partially. The competitive landscape is characterized by a mix of established players like National Instruments, Keysight Technologies, and Siemens, alongside emerging technology providers, leading to continuous innovation and improved product offerings. The market segmentation, encompassing various channels (e.g., direct sales, distributors), hardware/software types, and end-user verticals (e.g., automotive, energy, healthcare), presents significant opportunities for targeted growth strategies. The forecast period of 2025-2033 promises continued expansion, driven by technological advancements, increasing data demands, and the pervasive adoption of automation across multiple industries.
Data Acquisition Industry Company Market Share
Data Acquisition Industry Market Report: 2019-2033
This comprehensive report provides a detailed analysis of the Data Acquisition (DAQ) industry, encompassing market dynamics, growth trends, regional dominance, product landscape, key players, and future outlook. The study period covers 2019-2033, with a base year of 2025 and a forecast period of 2025-2033. The report is essential for industry professionals, investors, and anyone seeking a deep understanding of this rapidly evolving sector. The total market size in 2025 is estimated at xx Million units.
Data Acquisition Industry Market Dynamics & Structure
The Data Acquisition industry is characterized by a moderately concentrated market structure, with several large multinational corporations and numerous smaller specialized firms competing. Technological innovation, driven by the Internet of Things (IoT) and Industry 4.0, is a key driver, fostering the development of high-speed, high-channel-count, and increasingly intelligent DAQ systems. Regulatory frameworks, particularly concerning data security and privacy, are evolving and impacting market dynamics. Competitive product substitutes, such as cloud-based data acquisition platforms, are emerging, challenging traditional hardware-centric solutions. The end-user demographics are diverse, spanning various sectors with varying levels of DAQ system adoption. M&A activity in the sector has been moderate, with larger companies strategically acquiring smaller firms to enhance their product portfolios and expand their market reach.
- Market Concentration: Moderately concentrated, with a top 5 market share of approximately xx%.
- Technological Innovation: Strong emphasis on miniaturization, wireless connectivity, increased channel counts, and AI integration.
- Regulatory Landscape: Increasingly stringent regulations related to data security and industrial safety.
- Competitive Substitutes: Cloud-based DAQ platforms and software-defined solutions are gaining traction.
- M&A Activity: Moderate activity, with strategic acquisitions focused on technology and market expansion. Approximately xx M&A deals occurred between 2019 and 2024.
Data Acquisition Industry Growth Trends & Insights
The Data Acquisition market exhibits robust growth, driven by increasing automation across various industries and the growing demand for real-time data analytics. The market size experienced significant growth during the historical period (2019-2024), with a compound annual growth rate (CAGR) of xx%. This trend is projected to continue throughout the forecast period (2025-2033), with a forecasted CAGR of xx%. This growth is fueled by the adoption of advanced technologies like machine learning and artificial intelligence in DAQ systems, leading to improved data processing and analysis capabilities. The increased demand for data-driven decision-making across various sectors is further augmenting the adoption rate of DAQ systems. Consumer behavior shifts towards greater reliance on data analytics are also shaping the demand for sophisticated DAQ solutions. Market penetration is expected to reach xx% by 2033, driven by the integration of DAQ systems into various smart technologies and devices.
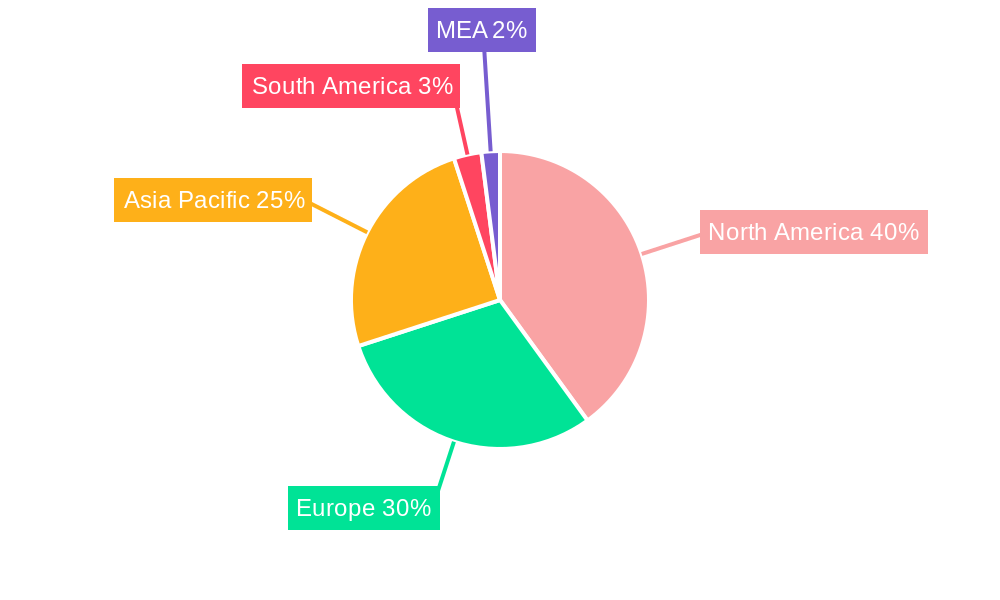
Dominant Regions, Countries, or Segments in Data Acquisition Industry
North America currently holds the largest market share in the Data Acquisition industry, followed by Europe and Asia Pacific. The strong presence of major technology companies and significant investments in automation and digitization in these regions contribute to this dominance. Within the segments, the Hardware segment dominates the market, accounting for approximately xx% of the total revenue in 2025, driven by the need for high-performance data acquisition systems in various industrial applications. In terms of channels, the Greater than 32-channel segment exhibits the highest growth rate, fueled by the growing need for high-throughput data acquisition in applications like smart grids and advanced manufacturing. The Power & Energy and Automotive end-user verticals are key growth drivers, with their increasing reliance on sophisticated data acquisition for efficient operations and performance optimization.
- Key Regional Drivers: Strong technological infrastructure, government initiatives to support automation, and established industrial bases.
- Segment Drivers: Hardware segment driven by robust demand for high-performance systems. Greater than 32-channel segment exhibiting high growth due to the increasing complexity of applications.
- End-User Vertical Drivers: Power & Energy, and Automotive sectors are driving substantial growth due to their high reliance on real-time data analysis for efficiency and optimization.
Data Acquisition Industry Product Landscape
The Data Acquisition industry offers a diverse range of products, including modular and standalone data acquisition systems, software packages for data analysis and visualization, and various accessories like sensors and signal conditioning units. Recent innovations focus on miniaturization, enhanced signal processing capabilities, and seamless integration with cloud platforms. Products are differentiated based on their channel count, sampling rates, precision, and communication interfaces. Key selling propositions include ease of use, compatibility with various software platforms, and robust performance in demanding environments. Technological advancements involve the integration of AI and machine learning for improved data analysis and predictive maintenance capabilities.
Key Drivers, Barriers & Challenges in Data Acquisition Industry
Key Drivers:
- Increased adoption of automation and IoT across industries.
- Growing demand for real-time data analytics and predictive maintenance.
- Technological advancements leading to improved performance and functionality.
- Government regulations promoting digital transformation and energy efficiency.
Key Barriers and Challenges:
- High initial investment costs for advanced DAQ systems.
- Complexity of integration with existing systems in some applications.
- Cybersecurity concerns related to data security and system integrity.
- Potential skill gaps in operating and maintaining complex DAQ systems. This leads to a xx% increase in support costs.
Emerging Opportunities in Data Acquisition Industry
- Expansion into untapped markets, such as smart agriculture and smart cities.
- Development of specialized DAQ solutions for niche applications like medical devices and environmental monitoring.
- Leveraging AI and machine learning for advanced data analysis and predictive capabilities.
- Creating more user-friendly interfaces and intuitive software for improved accessibility.
Growth Accelerators in the Data Acquisition Industry
Technological advancements, particularly in areas like high-speed data acquisition, wireless communication, and AI-powered analytics, are major growth accelerators. Strategic partnerships between DAQ manufacturers and system integrators are crucial for expanding market reach and providing comprehensive solutions to end-users. Market expansion strategies, including entering new geographical regions and targeting specific end-user verticals, will further contribute to the industry's growth.
Key Players Shaping the Data Acquisition Industry Market
- Imc Dataworks LLC
- DATAQ Instruments
- ABB Ltd
- Spectris PLC (HBM and Bruel & Kjaer and Omega)
- DAQ Systems Co Limited
- Keysight Technologies
- National Instruments Corporation
- Yokogawa Electric Co
- Emerson Electric Co
- Siemens AG
- Schneider Electric SE
- Omron Corporation
- General Electric Ltd
- Honeywell International
- Beijing GEMOTECH Intelligent Technology
- ADLINK Technology Inc
- Advantech Co Ltd
- Rockwell Automation Inc
- Curtiss-Wright Corporation
- Tektronix
- Bustec
- AMETEK (VTI Instruments)
Notable Milestones in Data Acquisition Industry Sector
- December 2021: ABB India partnered with Indore smart city development to deploy digital technology, enhancing power supply reliability using SCADA solutions.
- June 2022: Advantech launched the iDAQ series of modular DAQ modules and chassis, expanding its product portfolio.
In-Depth Data Acquisition Industry Market Outlook
The Data Acquisition industry is poised for sustained growth, driven by the increasing adoption of advanced technologies and expanding applications across diverse sectors. Strategic partnerships, technological breakthroughs in areas like AI-powered data analytics, and expansion into new geographical markets and vertical applications present substantial opportunities. The market's future potential is significant, with the continued demand for real-time data insights across various industries fueling its expansion. Companies that strategically invest in research and development, prioritize innovation, and effectively address the challenges related to data security and system integration are well-positioned to capitalize on the long-term growth prospects of this dynamic market.
Data Acquisition Industry Segmentation
-
1. Channel
- 1.1. Less than 32
- 1.2. 32-128
- 1.3. Greater than 128
-
2. Type
- 2.1. Hardware
- 2.2. Software
-
3. End-User Vertical
- 3.1. Water and Waste Treatment
- 3.2. Power & Energy
- 3.3. Automotive
- 3.4. Education and Research
- 3.5. Aerospace & Defense
- 3.6. Paper and Pulp
- 3.7. Chemicals
- 3.8. Other End-Users
Data Acquisition Industry Segmentation By Geography
- 1. North America
- 2. Europe
- 3. Asia Pacific
- 4. Rest of the World
Data Acquisition Industry Regional Market Share
Geographic Coverage of Data Acquisition Industry
Data Acquisition Industry REPORT HIGHLIGHTS
| Aspects | Details |
|---|---|
| Study Period | 2020-2034 |
| Base Year | 2025 |
| Estimated Year | 2026 |
| Forecast Period | 2026-2034 |
| Historical Period | 2020-2025 |
| Growth Rate | CAGR of 7.10% from 2020-2034 |
| Segmentation |
|
Table of Contents
- 1. Introduction
- 1.1. Research Scope
- 1.2. Market Segmentation
- 1.3. Research Objective
- 1.4. Definitions and Assumptions
- 2. Executive Summary
- 2.1. Market Snapshot
- 3. Market Dynamics
- 3.1. Market Drivers
- 3.2. Market Restrains
- 3.3. Market Trends
- 3.4. Market Opportunities
- 4. Market Factor Analysis
- 4.1. Porters Five Forces
- 4.1.1. Bargaining Power of Suppliers
- 4.1.2. Bargaining Power of Buyers
- 4.1.3. Threat of New Entrants
- 4.1.4. Threat of Substitutes
- 4.1.5. Competitive Rivalry
- 4.2. PESTEL analysis
- 4.3. BCG Analysis
- 4.3.1. Stars (High Growth, High Market Share)
- 4.3.2. Cash Cows (Low Growth, High Market Share)
- 4.3.3. Question Mark (High Growth, Low Market Share)
- 4.3.4. Dogs (Low Growth, Low Market Share)
- 4.4. Ansoff Matrix Analysis
- 4.5. Supply Chain Analysis
- 4.6. Regulatory Landscape
- 4.7. Current Market Potential and Opportunity Assessment (TAM–SAM–SOM Framework)
- 4.8. IMR Analyst Note
- 4.1. Porters Five Forces
- 5. Market Analysis, Insights and Forecast 2021-2033
- 5.1. Market Analysis, Insights and Forecast - by Channel
- 5.1.1. Less than 32
- 5.1.2. 32-128
- 5.1.3. Greater than 128
- 5.2. Market Analysis, Insights and Forecast - by Type
- 5.2.1. Hardware
- 5.2.2. Software
- 5.3. Market Analysis, Insights and Forecast - by End-User Vertical
- 5.3.1. Water and Waste Treatment
- 5.3.2. Power & Energy
- 5.3.3. Automotive
- 5.3.4. Education and Research
- 5.3.5. Aerospace & Defense
- 5.3.6. Paper and Pulp
- 5.3.7. Chemicals
- 5.3.8. Other End-Users
- 5.4. Market Analysis, Insights and Forecast - by Region
- 5.4.1. North America
- 5.4.2. Europe
- 5.4.3. Asia Pacific
- 5.4.4. Rest of the World
- 5.1. Market Analysis, Insights and Forecast - by Channel
- 6. Global Data Acquisition Industry Analysis, Insights and Forecast, 2021-2033
- 6.1. Market Analysis, Insights and Forecast - by Channel
- 6.1.1. Less than 32
- 6.1.2. 32-128
- 6.1.3. Greater than 128
- 6.2. Market Analysis, Insights and Forecast - by Type
- 6.2.1. Hardware
- 6.2.2. Software
- 6.3. Market Analysis, Insights and Forecast - by End-User Vertical
- 6.3.1. Water and Waste Treatment
- 6.3.2. Power & Energy
- 6.3.3. Automotive
- 6.3.4. Education and Research
- 6.3.5. Aerospace & Defense
- 6.3.6. Paper and Pulp
- 6.3.7. Chemicals
- 6.3.8. Other End-Users
- 6.1. Market Analysis, Insights and Forecast - by Channel
- 7. North America Data Acquisition Industry Analysis, Insights and Forecast, 2020-2032
- 7.1. Market Analysis, Insights and Forecast - by Channel
- 7.1.1. Less than 32
- 7.1.2. 32-128
- 7.1.3. Greater than 128
- 7.2. Market Analysis, Insights and Forecast - by Type
- 7.2.1. Hardware
- 7.2.2. Software
- 7.3. Market Analysis, Insights and Forecast - by End-User Vertical
- 7.3.1. Water and Waste Treatment
- 7.3.2. Power & Energy
- 7.3.3. Automotive
- 7.3.4. Education and Research
- 7.3.5. Aerospace & Defense
- 7.3.6. Paper and Pulp
- 7.3.7. Chemicals
- 7.3.8. Other End-Users
- 7.1. Market Analysis, Insights and Forecast - by Channel
- 8. Europe Data Acquisition Industry Analysis, Insights and Forecast, 2020-2032
- 8.1. Market Analysis, Insights and Forecast - by Channel
- 8.1.1. Less than 32
- 8.1.2. 32-128
- 8.1.3. Greater than 128
- 8.2. Market Analysis, Insights and Forecast - by Type
- 8.2.1. Hardware
- 8.2.2. Software
- 8.3. Market Analysis, Insights and Forecast - by End-User Vertical
- 8.3.1. Water and Waste Treatment
- 8.3.2. Power & Energy
- 8.3.3. Automotive
- 8.3.4. Education and Research
- 8.3.5. Aerospace & Defense
- 8.3.6. Paper and Pulp
- 8.3.7. Chemicals
- 8.3.8. Other End-Users
- 8.1. Market Analysis, Insights and Forecast - by Channel
- 9. Asia Pacific Data Acquisition Industry Analysis, Insights and Forecast, 2020-2032
- 9.1. Market Analysis, Insights and Forecast - by Channel
- 9.1.1. Less than 32
- 9.1.2. 32-128
- 9.1.3. Greater than 128
- 9.2. Market Analysis, Insights and Forecast - by Type
- 9.2.1. Hardware
- 9.2.2. Software
- 9.3. Market Analysis, Insights and Forecast - by End-User Vertical
- 9.3.1. Water and Waste Treatment
- 9.3.2. Power & Energy
- 9.3.3. Automotive
- 9.3.4. Education and Research
- 9.3.5. Aerospace & Defense
- 9.3.6. Paper and Pulp
- 9.3.7. Chemicals
- 9.3.8. Other End-Users
- 9.1. Market Analysis, Insights and Forecast - by Channel
- 10. Rest of the World Data Acquisition Industry Analysis, Insights and Forecast, 2020-2032
- 10.1. Market Analysis, Insights and Forecast - by Channel
- 10.1.1. Less than 32
- 10.1.2. 32-128
- 10.1.3. Greater than 128
- 10.2. Market Analysis, Insights and Forecast - by Type
- 10.2.1. Hardware
- 10.2.2. Software
- 10.3. Market Analysis, Insights and Forecast - by End-User Vertical
- 10.3.1. Water and Waste Treatment
- 10.3.2. Power & Energy
- 10.3.3. Automotive
- 10.3.4. Education and Research
- 10.3.5. Aerospace & Defense
- 10.3.6. Paper and Pulp
- 10.3.7. Chemicals
- 10.3.8. Other End-Users
- 10.1. Market Analysis, Insights and Forecast - by Channel
- 11. Competitive Analysis
- 11.1. Company Profiles
- 11.1.1 Imc Dataworks LLC
- 11.1.1.1. Company Overview
- 11.1.1.2. Products
- 11.1.1.3. Company Financials
- 11.1.1.4. SWOT Analysis
- 11.1.2 DATAQ Instruments
- 11.1.2.1. Company Overview
- 11.1.2.2. Products
- 11.1.2.3. Company Financials
- 11.1.2.4. SWOT Analysis
- 11.1.3 ABB Ltd
- 11.1.3.1. Company Overview
- 11.1.3.2. Products
- 11.1.3.3. Company Financials
- 11.1.3.4. SWOT Analysis
- 11.1.4 Spectris PLC (HBM and Bruel & Kjaer and Omega)
- 11.1.4.1. Company Overview
- 11.1.4.2. Products
- 11.1.4.3. Company Financials
- 11.1.4.4. SWOT Analysis
- 11.1.5 DAQ Systems Co Limited
- 11.1.5.1. Company Overview
- 11.1.5.2. Products
- 11.1.5.3. Company Financials
- 11.1.5.4. SWOT Analysis
- 11.1.6 Keysight Technologies
- 11.1.6.1. Company Overview
- 11.1.6.2. Products
- 11.1.6.3. Company Financials
- 11.1.6.4. SWOT Analysis
- 11.1.7 National Instruments Corporation
- 11.1.7.1. Company Overview
- 11.1.7.2. Products
- 11.1.7.3. Company Financials
- 11.1.7.4. SWOT Analysis
- 11.1.8 Yokogawa Electric Co
- 11.1.8.1. Company Overview
- 11.1.8.2. Products
- 11.1.8.3. Company Financials
- 11.1.8.4. SWOT Analysis
- 11.1.9 Emerson Electric Co
- 11.1.9.1. Company Overview
- 11.1.9.2. Products
- 11.1.9.3. Company Financials
- 11.1.9.4. SWOT Analysis
- 11.1.10 Siemens AG
- 11.1.10.1. Company Overview
- 11.1.10.2. Products
- 11.1.10.3. Company Financials
- 11.1.10.4. SWOT Analysis
- 11.1.11 Schneider Electric SE
- 11.1.11.1. Company Overview
- 11.1.11.2. Products
- 11.1.11.3. Company Financials
- 11.1.11.4. SWOT Analysis
- 11.1.12 Omron Corporation
- 11.1.12.1. Company Overview
- 11.1.12.2. Products
- 11.1.12.3. Company Financials
- 11.1.12.4. SWOT Analysis
- 11.1.13 General Electric Ltd
- 11.1.13.1. Company Overview
- 11.1.13.2. Products
- 11.1.13.3. Company Financials
- 11.1.13.4. SWOT Analysis
- 11.1.14 Honeywell International
- 11.1.14.1. Company Overview
- 11.1.14.2. Products
- 11.1.14.3. Company Financials
- 11.1.14.4. SWOT Analysis
- 11.1.15 Beijing GEMOTECH Intelligent Technology
- 11.1.15.1. Company Overview
- 11.1.15.2. Products
- 11.1.15.3. Company Financials
- 11.1.15.4. SWOT Analysis
- 11.1.16 ADLINK Technology Inc
- 11.1.16.1. Company Overview
- 11.1.16.2. Products
- 11.1.16.3. Company Financials
- 11.1.16.4. SWOT Analysis
- 11.1.17 Advantech Co Ltd
- 11.1.17.1. Company Overview
- 11.1.17.2. Products
- 11.1.17.3. Company Financials
- 11.1.17.4. SWOT Analysis
- 11.1.18 Rockwell Automation Inc
- 11.1.18.1. Company Overview
- 11.1.18.2. Products
- 11.1.18.3. Company Financials
- 11.1.18.4. SWOT Analysis
- 11.1.19 Curtiss-Wright Corporation
- 11.1.19.1. Company Overview
- 11.1.19.2. Products
- 11.1.19.3. Company Financials
- 11.1.19.4. SWOT Analysis
- 11.1.20 Tektronix
- 11.1.20.1. Company Overview
- 11.1.20.2. Products
- 11.1.20.3. Company Financials
- 11.1.20.4. SWOT Analysis
- 11.1.21 Bustec
- 11.1.21.1. Company Overview
- 11.1.21.2. Products
- 11.1.21.3. Company Financials
- 11.1.21.4. SWOT Analysis
- 11.1.22 AMETEK (VTI Instruments)
- 11.1.22.1. Company Overview
- 11.1.22.2. Products
- 11.1.22.3. Company Financials
- 11.1.22.4. SWOT Analysis
- 11.1.1 Imc Dataworks LLC
- 11.2. Market Entropy
- 11.2.1 Company's Key Areas Served
- 11.2.2 Recent Developments
- 11.3. Company Market Share Analysis 2025
- 11.3.1 Top 5 Companies Market Share Analysis
- 11.3.2 Top 3 Companies Market Share Analysis
- 11.4. List of Potential Customers
- 12. Research Methodology
List of Figures
- Figure 1: Global Data Acquisition Industry Revenue Breakdown (Million, %) by Region 2025 & 2033
- Figure 2: Global Data Acquisition Industry Volume Breakdown (K Unit, %) by Region 2025 & 2033
- Figure 3: North America Data Acquisition Industry Revenue (Million), by Channel 2025 & 2033
- Figure 4: North America Data Acquisition Industry Volume (K Unit), by Channel 2025 & 2033
- Figure 5: North America Data Acquisition Industry Revenue Share (%), by Channel 2025 & 2033
- Figure 6: North America Data Acquisition Industry Volume Share (%), by Channel 2025 & 2033
- Figure 7: North America Data Acquisition Industry Revenue (Million), by Type 2025 & 2033
- Figure 8: North America Data Acquisition Industry Volume (K Unit), by Type 2025 & 2033
- Figure 9: North America Data Acquisition Industry Revenue Share (%), by Type 2025 & 2033
- Figure 10: North America Data Acquisition Industry Volume Share (%), by Type 2025 & 2033
- Figure 11: North America Data Acquisition Industry Revenue (Million), by End-User Vertical 2025 & 2033
- Figure 12: North America Data Acquisition Industry Volume (K Unit), by End-User Vertical 2025 & 2033
- Figure 13: North America Data Acquisition Industry Revenue Share (%), by End-User Vertical 2025 & 2033
- Figure 14: North America Data Acquisition Industry Volume Share (%), by End-User Vertical 2025 & 2033
- Figure 15: North America Data Acquisition Industry Revenue (Million), by Country 2025 & 2033
- Figure 16: North America Data Acquisition Industry Volume (K Unit), by Country 2025 & 2033
- Figure 17: North America Data Acquisition Industry Revenue Share (%), by Country 2025 & 2033
- Figure 18: North America Data Acquisition Industry Volume Share (%), by Country 2025 & 2033
- Figure 19: Europe Data Acquisition Industry Revenue (Million), by Channel 2025 & 2033
- Figure 20: Europe Data Acquisition Industry Volume (K Unit), by Channel 2025 & 2033
- Figure 21: Europe Data Acquisition Industry Revenue Share (%), by Channel 2025 & 2033
- Figure 22: Europe Data Acquisition Industry Volume Share (%), by Channel 2025 & 2033
- Figure 23: Europe Data Acquisition Industry Revenue (Million), by Type 2025 & 2033
- Figure 24: Europe Data Acquisition Industry Volume (K Unit), by Type 2025 & 2033
- Figure 25: Europe Data Acquisition Industry Revenue Share (%), by Type 2025 & 2033
- Figure 26: Europe Data Acquisition Industry Volume Share (%), by Type 2025 & 2033
- Figure 27: Europe Data Acquisition Industry Revenue (Million), by End-User Vertical 2025 & 2033
- Figure 28: Europe Data Acquisition Industry Volume (K Unit), by End-User Vertical 2025 & 2033
- Figure 29: Europe Data Acquisition Industry Revenue Share (%), by End-User Vertical 2025 & 2033
- Figure 30: Europe Data Acquisition Industry Volume Share (%), by End-User Vertical 2025 & 2033
- Figure 31: Europe Data Acquisition Industry Revenue (Million), by Country 2025 & 2033
- Figure 32: Europe Data Acquisition Industry Volume (K Unit), by Country 2025 & 2033
- Figure 33: Europe Data Acquisition Industry Revenue Share (%), by Country 2025 & 2033
- Figure 34: Europe Data Acquisition Industry Volume Share (%), by Country 2025 & 2033
- Figure 35: Asia Pacific Data Acquisition Industry Revenue (Million), by Channel 2025 & 2033
- Figure 36: Asia Pacific Data Acquisition Industry Volume (K Unit), by Channel 2025 & 2033
- Figure 37: Asia Pacific Data Acquisition Industry Revenue Share (%), by Channel 2025 & 2033
- Figure 38: Asia Pacific Data Acquisition Industry Volume Share (%), by Channel 2025 & 2033
- Figure 39: Asia Pacific Data Acquisition Industry Revenue (Million), by Type 2025 & 2033
- Figure 40: Asia Pacific Data Acquisition Industry Volume (K Unit), by Type 2025 & 2033
- Figure 41: Asia Pacific Data Acquisition Industry Revenue Share (%), by Type 2025 & 2033
- Figure 42: Asia Pacific Data Acquisition Industry Volume Share (%), by Type 2025 & 2033
- Figure 43: Asia Pacific Data Acquisition Industry Revenue (Million), by End-User Vertical 2025 & 2033
- Figure 44: Asia Pacific Data Acquisition Industry Volume (K Unit), by End-User Vertical 2025 & 2033
- Figure 45: Asia Pacific Data Acquisition Industry Revenue Share (%), by End-User Vertical 2025 & 2033
- Figure 46: Asia Pacific Data Acquisition Industry Volume Share (%), by End-User Vertical 2025 & 2033
- Figure 47: Asia Pacific Data Acquisition Industry Revenue (Million), by Country 2025 & 2033
- Figure 48: Asia Pacific Data Acquisition Industry Volume (K Unit), by Country 2025 & 2033
- Figure 49: Asia Pacific Data Acquisition Industry Revenue Share (%), by Country 2025 & 2033
- Figure 50: Asia Pacific Data Acquisition Industry Volume Share (%), by Country 2025 & 2033
- Figure 51: Rest of the World Data Acquisition Industry Revenue (Million), by Channel 2025 & 2033
- Figure 52: Rest of the World Data Acquisition Industry Volume (K Unit), by Channel 2025 & 2033
- Figure 53: Rest of the World Data Acquisition Industry Revenue Share (%), by Channel 2025 & 2033
- Figure 54: Rest of the World Data Acquisition Industry Volume Share (%), by Channel 2025 & 2033
- Figure 55: Rest of the World Data Acquisition Industry Revenue (Million), by Type 2025 & 2033
- Figure 56: Rest of the World Data Acquisition Industry Volume (K Unit), by Type 2025 & 2033
- Figure 57: Rest of the World Data Acquisition Industry Revenue Share (%), by Type 2025 & 2033
- Figure 58: Rest of the World Data Acquisition Industry Volume Share (%), by Type 2025 & 2033
- Figure 59: Rest of the World Data Acquisition Industry Revenue (Million), by End-User Vertical 2025 & 2033
- Figure 60: Rest of the World Data Acquisition Industry Volume (K Unit), by End-User Vertical 2025 & 2033
- Figure 61: Rest of the World Data Acquisition Industry Revenue Share (%), by End-User Vertical 2025 & 2033
- Figure 62: Rest of the World Data Acquisition Industry Volume Share (%), by End-User Vertical 2025 & 2033
- Figure 63: Rest of the World Data Acquisition Industry Revenue (Million), by Country 2025 & 2033
- Figure 64: Rest of the World Data Acquisition Industry Volume (K Unit), by Country 2025 & 2033
- Figure 65: Rest of the World Data Acquisition Industry Revenue Share (%), by Country 2025 & 2033
- Figure 66: Rest of the World Data Acquisition Industry Volume Share (%), by Country 2025 & 2033
List of Tables
- Table 1: Global Data Acquisition Industry Revenue Million Forecast, by Channel 2020 & 2033
- Table 2: Global Data Acquisition Industry Volume K Unit Forecast, by Channel 2020 & 2033
- Table 3: Global Data Acquisition Industry Revenue Million Forecast, by Type 2020 & 2033
- Table 4: Global Data Acquisition Industry Volume K Unit Forecast, by Type 2020 & 2033
- Table 5: Global Data Acquisition Industry Revenue Million Forecast, by End-User Vertical 2020 & 2033
- Table 6: Global Data Acquisition Industry Volume K Unit Forecast, by End-User Vertical 2020 & 2033
- Table 7: Global Data Acquisition Industry Revenue Million Forecast, by Region 2020 & 2033
- Table 8: Global Data Acquisition Industry Volume K Unit Forecast, by Region 2020 & 2033
- Table 9: Global Data Acquisition Industry Revenue Million Forecast, by Channel 2020 & 2033
- Table 10: Global Data Acquisition Industry Volume K Unit Forecast, by Channel 2020 & 2033
- Table 11: Global Data Acquisition Industry Revenue Million Forecast, by Type 2020 & 2033
- Table 12: Global Data Acquisition Industry Volume K Unit Forecast, by Type 2020 & 2033
- Table 13: Global Data Acquisition Industry Revenue Million Forecast, by End-User Vertical 2020 & 2033
- Table 14: Global Data Acquisition Industry Volume K Unit Forecast, by End-User Vertical 2020 & 2033
- Table 15: Global Data Acquisition Industry Revenue Million Forecast, by Country 2020 & 2033
- Table 16: Global Data Acquisition Industry Volume K Unit Forecast, by Country 2020 & 2033
- Table 17: Global Data Acquisition Industry Revenue Million Forecast, by Channel 2020 & 2033
- Table 18: Global Data Acquisition Industry Volume K Unit Forecast, by Channel 2020 & 2033
- Table 19: Global Data Acquisition Industry Revenue Million Forecast, by Type 2020 & 2033
- Table 20: Global Data Acquisition Industry Volume K Unit Forecast, by Type 2020 & 2033
- Table 21: Global Data Acquisition Industry Revenue Million Forecast, by End-User Vertical 2020 & 2033
- Table 22: Global Data Acquisition Industry Volume K Unit Forecast, by End-User Vertical 2020 & 2033
- Table 23: Global Data Acquisition Industry Revenue Million Forecast, by Country 2020 & 2033
- Table 24: Global Data Acquisition Industry Volume K Unit Forecast, by Country 2020 & 2033
- Table 25: Global Data Acquisition Industry Revenue Million Forecast, by Channel 2020 & 2033
- Table 26: Global Data Acquisition Industry Volume K Unit Forecast, by Channel 2020 & 2033
- Table 27: Global Data Acquisition Industry Revenue Million Forecast, by Type 2020 & 2033
- Table 28: Global Data Acquisition Industry Volume K Unit Forecast, by Type 2020 & 2033
- Table 29: Global Data Acquisition Industry Revenue Million Forecast, by End-User Vertical 2020 & 2033
- Table 30: Global Data Acquisition Industry Volume K Unit Forecast, by End-User Vertical 2020 & 2033
- Table 31: Global Data Acquisition Industry Revenue Million Forecast, by Country 2020 & 2033
- Table 32: Global Data Acquisition Industry Volume K Unit Forecast, by Country 2020 & 2033
- Table 33: Global Data Acquisition Industry Revenue Million Forecast, by Channel 2020 & 2033
- Table 34: Global Data Acquisition Industry Volume K Unit Forecast, by Channel 2020 & 2033
- Table 35: Global Data Acquisition Industry Revenue Million Forecast, by Type 2020 & 2033
- Table 36: Global Data Acquisition Industry Volume K Unit Forecast, by Type 2020 & 2033
- Table 37: Global Data Acquisition Industry Revenue Million Forecast, by End-User Vertical 2020 & 2033
- Table 38: Global Data Acquisition Industry Volume K Unit Forecast, by End-User Vertical 2020 & 2033
- Table 39: Global Data Acquisition Industry Revenue Million Forecast, by Country 2020 & 2033
- Table 40: Global Data Acquisition Industry Volume K Unit Forecast, by Country 2020 & 2033
Frequently Asked Questions
1. What is the projected Compound Annual Growth Rate (CAGR) of the Data Acquisition Industry?
The projected CAGR is approximately 7.10%.
2. Which companies are prominent players in the Data Acquisition Industry?
Key companies in the market include Imc Dataworks LLC, DATAQ Instruments, ABB Ltd, Spectris PLC (HBM and Bruel & Kjaer and Omega), DAQ Systems Co Limited, Keysight Technologies, National Instruments Corporation, Yokogawa Electric Co, Emerson Electric Co, Siemens AG, Schneider Electric SE, Omron Corporation, General Electric Ltd, Honeywell International, Beijing GEMOTECH Intelligent Technology, ADLINK Technology Inc, Advantech Co Ltd, Rockwell Automation Inc, Curtiss-Wright Corporation, Tektronix, Bustec, AMETEK (VTI Instruments).
3. What are the main segments of the Data Acquisition Industry?
The market segments include Channel, Type, End-User Vertical.
4. Can you provide details about the market size?
The market size is estimated to be USD 2.41 Million as of 2022.
5. What are some drivers contributing to market growth?
Growing Adoption of Industrial Ethernet Solutions; Increasing Complexity in Manufacturing Establishments is Driving Operators Towards Adoption of DAQ for Design Validation and Testing; Technological Advancements Such as Edge Computing and TSN.
6. What are the notable trends driving market growth?
Aerospace and Defense Accounts for Significant Share in the Market.
7. Are there any restraints impacting market growth?
Cost Implications and Saturation in Key Markets Could Hinder Growth Over the Forecast Period.
8. Can you provide examples of recent developments in the market?
June 2022 - Advantech announced the launch of a new series of data acquisition modules - iDAQ series. The iDAQ series is a new series of modular DAQ modules and chassis, including the iDAQ-900 series chassis and iDAQ-700 and 800 series DAQ modules.
9. What pricing options are available for accessing the report?
Pricing options include single-user, multi-user, and enterprise licenses priced at USD 4750, USD 5250, and USD 8750 respectively.
10. Is the market size provided in terms of value or volume?
The market size is provided in terms of value, measured in Million and volume, measured in K Unit.
11. Are there any specific market keywords associated with the report?
Yes, the market keyword associated with the report is "Data Acquisition Industry," which aids in identifying and referencing the specific market segment covered.
12. How do I determine which pricing option suits my needs best?
The pricing options vary based on user requirements and access needs. Individual users may opt for single-user licenses, while businesses requiring broader access may choose multi-user or enterprise licenses for cost-effective access to the report.
13. Are there any additional resources or data provided in the Data Acquisition Industry report?
While the report offers comprehensive insights, it's advisable to review the specific contents or supplementary materials provided to ascertain if additional resources or data are available.
14. How can I stay updated on further developments or reports in the Data Acquisition Industry?
To stay informed about further developments, trends, and reports in the Data Acquisition Industry, consider subscribing to industry newsletters, following relevant companies and organizations, or regularly checking reputable industry news sources and publications.
Methodology
Step 1 - Identification of Relevant Samples Size from Population Database


Step 2 - Approaches for Defining Global Market Size (Value, Volume* & Price*)

Note*: In applicable scenarios
Step 3 - Data Sources
Primary Research
- Web Analytics
- Survey Reports
- Research Institute
- Latest Research Reports
- Opinion Leaders
Secondary Research
- Annual Reports
- White Paper
- Latest Press Release
- Industry Association
- Paid Database
- Investor Presentations

Step 4 - Data Triangulation
Involves using different sources of information in order to increase the validity of a study
These sources are likely to be stakeholders in a program - participants, other researchers, program staff, other community members, and so on.
Then we put all data in single framework & apply various statistical tools to find out the dynamic on the market.
During the analysis stage, feedback from the stakeholder groups would be compared to determine areas of agreement as well as areas of divergence