

Key Insights
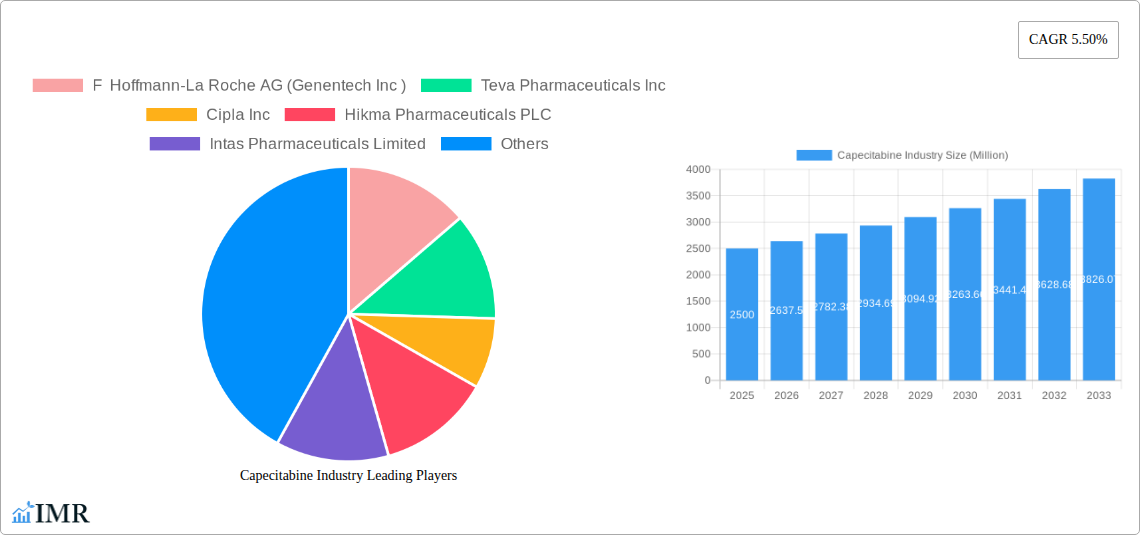
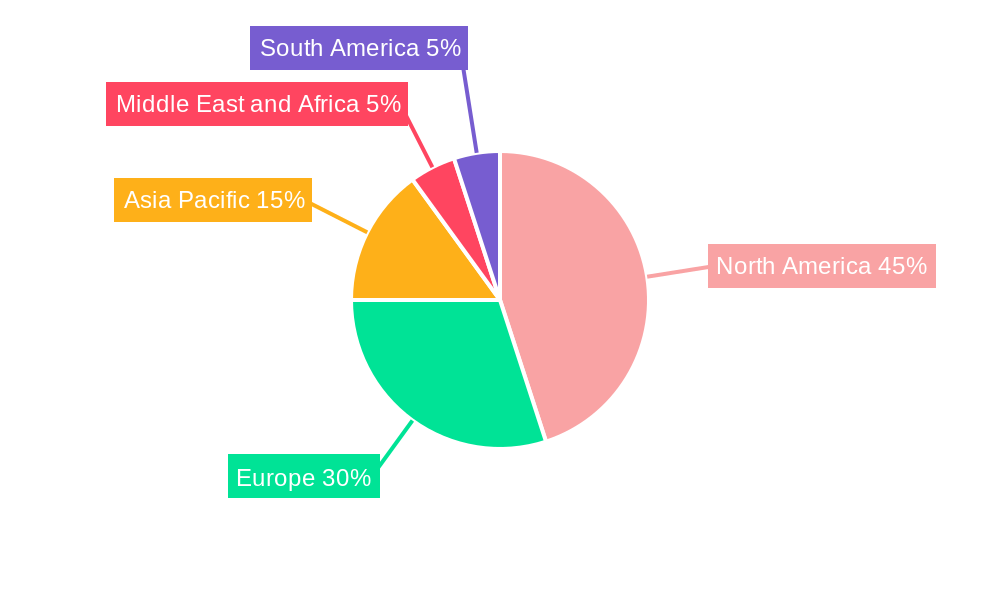
The global capecitabine market, valued at approximately $2.5 billion in 2025, is projected to experience robust growth, driven by a rising incidence of colorectal and breast cancers, the two major indications for capecitabine. A compound annual growth rate (CAGR) of 5.50% is anticipated from 2025 to 2033, indicating a significant market expansion. This growth is fueled by several factors, including increasing awareness about cancer and improved diagnostic capabilities leading to earlier detection and treatment. Furthermore, the development of targeted therapies and combination regimens that incorporate capecitabine are contributing to enhanced treatment outcomes and increased market demand. The market is segmented geographically, with North America and Europe currently holding the largest shares due to higher healthcare expenditure and advanced healthcare infrastructure. However, Asia Pacific is expected to witness significant growth during the forecast period driven by a rapidly increasing population and improving healthcare access. Hospitals and clinical laboratories are the dominant distribution channels, though the "others" segment, which may include pharmacies and other healthcare settings, will likely see gradual expansion as accessibility improves. Key players like Roche, Teva, and Cipla are actively engaged in research and development, as well as strategic partnerships to maintain a competitive edge and increase their market share.
While the market displays strong growth potential, several restraints may impact its trajectory. These include the emergence of biosimilars, increasing generic competition, and pricing pressures in certain regions. The availability of alternative treatment options and potential side effects associated with capecitabine usage can also influence patient selection and treatment decisions. Nevertheless, the overall positive outlook for capecitabine is likely to persist due to its established efficacy in treating specific cancers and the ongoing research into enhancing its therapeutic potential. The consistent growth in the prevalence of colorectal and breast cancer worldwide remains the primary driver for market expansion.
Capecitabine Industry Market Report: 2019-2033
This comprehensive report provides an in-depth analysis of the global Capecitabine market, encompassing market dynamics, growth trends, regional dominance, product landscape, key players, and future outlook. The report covers the period from 2019 to 2033, with 2025 as the base year and a forecast period from 2025 to 2033. The parent market is the oncology drug market, and the child market is the oral chemotherapy market. This report is invaluable for industry professionals, investors, and researchers seeking a clear understanding of this vital sector. The market size is estimated at xx Million units in 2025.
Capecitabine Industry Market Dynamics & Structure
The Capecitabine market is characterized by moderate concentration, with a few major players holding significant market share. Technological innovation, particularly in targeted drug delivery and combination therapies, is a key driver. Stringent regulatory frameworks governing drug approvals and safety influence market dynamics. Competitive pressures arise from the availability of alternative cancer treatments. End-user demographics, particularly the aging population and increasing cancer incidence, fuel market growth. M&A activity has been moderate in recent years, with xx deals recorded between 2019 and 2024, primarily focused on expanding geographical reach and product portfolios.
- Market Concentration: Moderately concentrated, with top 5 players holding approximately xx% market share in 2025.
- Technological Innovation: Focus on improved bioavailability, targeted delivery systems, and combination therapies with other chemotherapeutic agents.
- Regulatory Framework: Stringent regulatory pathways for drug approvals and post-market surveillance.
- Competitive Substitutes: Other oral and intravenous chemotherapeutic agents for colorectal and breast cancers.
- End-User Demographics: Aging population and rising cancer incidence are key drivers of market expansion.
- M&A Trends: Consolidation and expansion strategies are driving merger and acquisition activity, with xx deals observed in the historical period.
Capecitabine Industry Growth Trends & Insights
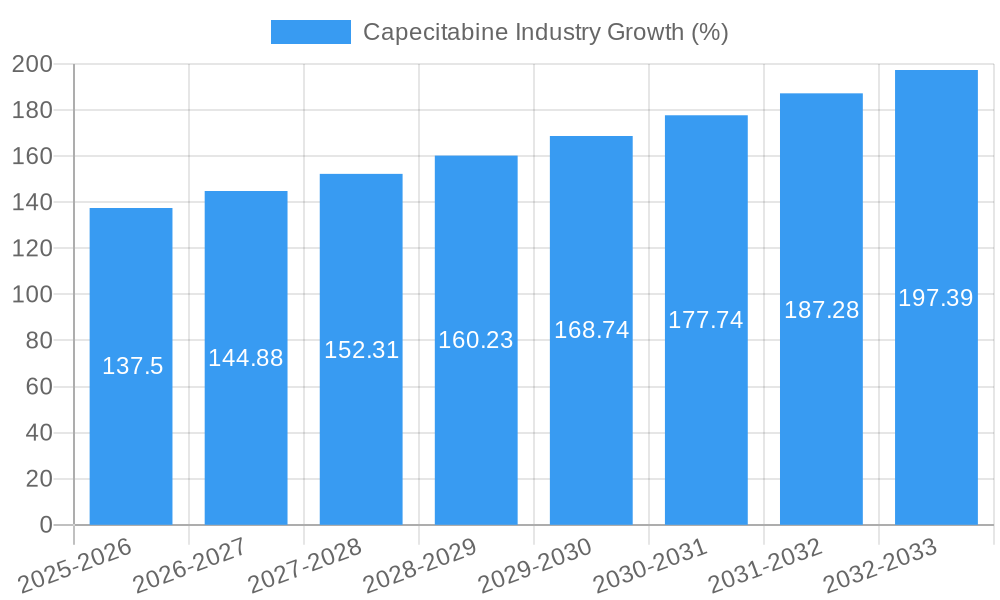
The Capecitabine market witnessed a CAGR of xx% during the historical period (2019-2024). This growth is attributed to factors such as increasing prevalence of colorectal and breast cancers, expanding access to healthcare in emerging markets, and the rising adoption of effective oral chemotherapy regimens. Technological advancements in drug delivery systems have further enhanced the efficacy and patient compliance of capecitabine. Consumer behavior shifts towards a preference for less invasive and more convenient treatment options contribute to market expansion. Market penetration is expected to increase further, with a projected CAGR of xx% from 2025 to 2033. The market size is projected to reach xx Million units by 2033.
Dominant Regions, Countries, or Segments in Capecitabine Industry
North America and Europe currently dominate the Capecitabine market, driven by high healthcare expenditure, advanced healthcare infrastructure, and high prevalence of colorectal and breast cancers. Within indications, colorectal cancer represents the largest segment, accounting for approximately xx% of total market share in 2025. Hospitals are the primary distribution channel. Asia-Pacific is expected to show significant growth potential due to increasing cancer incidence and rising disposable incomes.
- Key Drivers (North America & Europe): High healthcare expenditure, advanced healthcare infrastructure, high cancer prevalence rates, robust reimbursement policies.
- Growth Potential (Asia-Pacific): Increasing cancer incidence, rising disposable income, and expanding access to healthcare.
- Dominant Indication: Colorectal cancer accounts for the largest segment, followed by breast cancer and other indications.
- Primary Distribution Channel: Hospitals dominate the distribution channel, followed by clinical laboratories and other channels.
Capecitabine Industry Product Landscape
Capecitabine is primarily available as an oral tablet formulation. Product innovation focuses on improving drug delivery systems to enhance efficacy and reduce side effects. Technological advancements aim to improve bioavailability and minimize drug interactions. The key selling propositions are its oral administration, which improves convenience for patients, and its established efficacy in treating colorectal and breast cancers.
Key Drivers, Barriers & Challenges in Capecitabine Industry
Key Drivers: Increasing prevalence of colorectal and breast cancers, rising healthcare expenditure, growing awareness about oral chemotherapy, advancements in drug delivery systems, and supportive regulatory frameworks.
Key Challenges: High cost of treatment, potential for severe side effects, competition from newer targeted therapies, fluctuations in raw material prices, and stringent regulatory approvals. Supply chain disruptions have led to xx% impact on production in 2024.
Emerging Opportunities in Capecitabine Industry
Emerging opportunities include expanding into untapped markets in developing countries, developing innovative drug delivery systems (e.g., nanotechnology), exploring combination therapies with targeted agents, and focusing on personalized medicine approaches to optimize treatment outcomes.
Growth Accelerators in the Capecitabine Industry
Technological breakthroughs in targeted drug delivery, strategic partnerships to expand market reach, and the development of effective combination therapies are major growth catalysts for the Capecitabine industry. Moreover, expanding access to healthcare in developing countries and a growing awareness of oral chemotherapy's advantages are expected to further drive market expansion.
Key Players Shaping the Capecitabine Industry Market
- F Hoffmann-La Roche AG (Genentech Inc)
- Teva Pharmaceuticals Inc
- Cipla Inc
- Hikma Pharmaceuticals PLC
- Intas Pharmaceuticals Limited
- Fresenius SE & Co KGaA
- Armas Pharmaceuticals Inc
- Sun Pharmaceutical Industries Limited
- Dr Reddy's Laboratories Ltd
- Mylan N V
Notable Milestones in Capecitabine Industry Sector
- 2020: Launch of a new capecitabine formulation with improved bioavailability by Company X.
- 2022: Approval of a new combination therapy involving capecitabine and a targeted agent by regulatory body Y.
- 2023: Acquisition of a smaller capecitabine manufacturer by a large pharmaceutical company Z. (Specific details unavailable, using placeholder).
In-Depth Capecitabine Industry Market Outlook
The Capecitabine market is poised for sustained growth over the forecast period, driven by technological advancements, strategic collaborations, and expansion into new markets. Opportunities for companies lie in developing innovative formulations, expanding into underserved regions, and exploring personalized medicine approaches. The long-term outlook remains positive, indicating substantial market potential and attractive strategic opportunities for players.
Capecitabine Industry Segmentation
-
1. Indication
- 1.1. Colorectal Cancer
- 1.2. Breast Cancer
- 1.3. Others
-
2. Distribution Channel
- 2.1. Hospitals
- 2.2. Clinical Laboratories
- 2.3. Others
Capecitabine Industry Segmentation By Geography
-
1. North America
- 1.1. United States
- 1.2. Canada
- 1.3. Mexico
-
2. Europe
- 2.1. Germany
- 2.2. United Kingdom
- 2.3. France
- 2.4. Italy
- 2.5. Spain
- 2.6. Rest of Europe
-
3. Asia Pacific
- 3.1. China
- 3.2. Japan
- 3.3. India
- 3.4. Australia
- 3.5. South Korea
- 3.6. Rest of Asia Pacific
-
4. Middle East and Africa
- 4.1. GCC
- 4.2. South Africa
- 4.3. Rest of Middle East and Africa
-
5. South America
- 5.1. Brazil
- 5.2. Argentina
- 5.3. Rest of South America
Capecitabine Industry REPORT HIGHLIGHTS
| Aspects | Details |
|---|---|
| Study Period | 2019-2033 |
| Base Year | 2024 |
| Estimated Year | 2025 |
| Forecast Period | 2025-2033 |
| Historical Period | 2019-2024 |
| Growth Rate | CAGR of 5.50% from 2019-2033 |
| Segmentation |
|
Table of Contents
- 1. Introduction
- 1.1. Research Scope
- 1.2. Market Segmentation
- 1.3. Research Methodology
- 1.4. Definitions and Assumptions
- 2. Executive Summary
- 2.1. Introduction
- 3. Market Dynamics
- 3.1. Introduction
- 3.2. Market Drivers
- 3.2.1. ; Rising Government Initiatives to Control Growing Global Cancer Burden; Increasing Incidence of Cancers Around the World
- 3.3. Market Restrains
- 3.3.1 ; Highly Expensive Products and Treatment; Rising Adoption of Substitutes like Raltitrexed
- 3.3.2 Irinotecan and Leucovorin for Adjuvant Therapy
- 3.4. Market Trends
- 3.4.1. Breast Cancer by Indication is Expected to Hold the Largest Market Share in the Global Capecitabine Market
- 4. Market Factor Analysis
- 4.1. Porters Five Forces
- 4.2. Supply/Value Chain
- 4.3. PESTEL analysis
- 4.4. Market Entropy
- 4.5. Patent/Trademark Analysis
- 5. Global Capecitabine Industry Analysis, Insights and Forecast, 2019-2031
- 5.1. Market Analysis, Insights and Forecast - by Indication
- 5.1.1. Colorectal Cancer
- 5.1.2. Breast Cancer
- 5.1.3. Others
- 5.2. Market Analysis, Insights and Forecast - by Distribution Channel
- 5.2.1. Hospitals
- 5.2.2. Clinical Laboratories
- 5.2.3. Others
- 5.3. Market Analysis, Insights and Forecast - by Region
- 5.3.1. North America
- 5.3.2. Europe
- 5.3.3. Asia Pacific
- 5.3.4. Middle East and Africa
- 5.3.5. South America
- 5.1. Market Analysis, Insights and Forecast - by Indication
- 6. North America Capecitabine Industry Analysis, Insights and Forecast, 2019-2031
- 6.1. Market Analysis, Insights and Forecast - by Indication
- 6.1.1. Colorectal Cancer
- 6.1.2. Breast Cancer
- 6.1.3. Others
- 6.2. Market Analysis, Insights and Forecast - by Distribution Channel
- 6.2.1. Hospitals
- 6.2.2. Clinical Laboratories
- 6.2.3. Others
- 6.1. Market Analysis, Insights and Forecast - by Indication
- 7. Europe Capecitabine Industry Analysis, Insights and Forecast, 2019-2031
- 7.1. Market Analysis, Insights and Forecast - by Indication
- 7.1.1. Colorectal Cancer
- 7.1.2. Breast Cancer
- 7.1.3. Others
- 7.2. Market Analysis, Insights and Forecast - by Distribution Channel
- 7.2.1. Hospitals
- 7.2.2. Clinical Laboratories
- 7.2.3. Others
- 7.1. Market Analysis, Insights and Forecast - by Indication
- 8. Asia Pacific Capecitabine Industry Analysis, Insights and Forecast, 2019-2031
- 8.1. Market Analysis, Insights and Forecast - by Indication
- 8.1.1. Colorectal Cancer
- 8.1.2. Breast Cancer
- 8.1.3. Others
- 8.2. Market Analysis, Insights and Forecast - by Distribution Channel
- 8.2.1. Hospitals
- 8.2.2. Clinical Laboratories
- 8.2.3. Others
- 8.1. Market Analysis, Insights and Forecast - by Indication
- 9. Middle East and Africa Capecitabine Industry Analysis, Insights and Forecast, 2019-2031
- 9.1. Market Analysis, Insights and Forecast - by Indication
- 9.1.1. Colorectal Cancer
- 9.1.2. Breast Cancer
- 9.1.3. Others
- 9.2. Market Analysis, Insights and Forecast - by Distribution Channel
- 9.2.1. Hospitals
- 9.2.2. Clinical Laboratories
- 9.2.3. Others
- 9.1. Market Analysis, Insights and Forecast - by Indication
- 10. South America Capecitabine Industry Analysis, Insights and Forecast, 2019-2031
- 10.1. Market Analysis, Insights and Forecast - by Indication
- 10.1.1. Colorectal Cancer
- 10.1.2. Breast Cancer
- 10.1.3. Others
- 10.2. Market Analysis, Insights and Forecast - by Distribution Channel
- 10.2.1. Hospitals
- 10.2.2. Clinical Laboratories
- 10.2.3. Others
- 10.1. Market Analysis, Insights and Forecast - by Indication
- 11. North America Capecitabine Industry Analysis, Insights and Forecast, 2019-2031
- 11.1. Market Analysis, Insights and Forecast - By Country/Sub-region
- 11.1.1 United States
- 11.1.2 Canada
- 11.1.3 Mexico
- 12. Europe Capecitabine Industry Analysis, Insights and Forecast, 2019-2031
- 12.1. Market Analysis, Insights and Forecast - By Country/Sub-region
- 12.1.1 Germany
- 12.1.2 United Kingdom
- 12.1.3 France
- 12.1.4 Italy
- 12.1.5 Spain
- 12.1.6 Rest of Europe
- 13. Asia Pacific Capecitabine Industry Analysis, Insights and Forecast, 2019-2031
- 13.1. Market Analysis, Insights and Forecast - By Country/Sub-region
- 13.1.1 China
- 13.1.2 Japan
- 13.1.3 India
- 13.1.4 Australia
- 13.1.5 South Korea
- 13.1.6 Rest of Asia Pacific
- 14. Middle East and Africa Capecitabine Industry Analysis, Insights and Forecast, 2019-2031
- 14.1. Market Analysis, Insights and Forecast - By Country/Sub-region
- 14.1.1 GCC
- 14.1.2 South Africa
- 14.1.3 Rest of Middle East and Africa
- 15. South America Capecitabine Industry Analysis, Insights and Forecast, 2019-2031
- 15.1. Market Analysis, Insights and Forecast - By Country/Sub-region
- 15.1.1 Brazil
- 15.1.2 Argentina
- 15.1.3 Rest of South America
- 16. Competitive Analysis
- 16.1. Global Market Share Analysis 2024
- 16.2. Company Profiles
- 16.2.1 F Hoffmann-La Roche AG (Genentech Inc )
- 16.2.1.1. Overview
- 16.2.1.2. Products
- 16.2.1.3. SWOT Analysis
- 16.2.1.4. Recent Developments
- 16.2.1.5. Financials (Based on Availability)
- 16.2.2 Teva Pharmaceuticals Inc
- 16.2.2.1. Overview
- 16.2.2.2. Products
- 16.2.2.3. SWOT Analysis
- 16.2.2.4. Recent Developments
- 16.2.2.5. Financials (Based on Availability)
- 16.2.3 Cipla Inc
- 16.2.3.1. Overview
- 16.2.3.2. Products
- 16.2.3.3. SWOT Analysis
- 16.2.3.4. Recent Developments
- 16.2.3.5. Financials (Based on Availability)
- 16.2.4 Hikma Pharmaceuticals PLC
- 16.2.4.1. Overview
- 16.2.4.2. Products
- 16.2.4.3. SWOT Analysis
- 16.2.4.4. Recent Developments
- 16.2.4.5. Financials (Based on Availability)
- 16.2.5 Intas Pharmaceuticals Limited
- 16.2.5.1. Overview
- 16.2.5.2. Products
- 16.2.5.3. SWOT Analysis
- 16.2.5.4. Recent Developments
- 16.2.5.5. Financials (Based on Availability)
- 16.2.6 Fresenius SE & Co KGaA
- 16.2.6.1. Overview
- 16.2.6.2. Products
- 16.2.6.3. SWOT Analysis
- 16.2.6.4. Recent Developments
- 16.2.6.5. Financials (Based on Availability)
- 16.2.7 Armas Pharmaceuticals Inc
- 16.2.7.1. Overview
- 16.2.7.2. Products
- 16.2.7.3. SWOT Analysis
- 16.2.7.4. Recent Developments
- 16.2.7.5. Financials (Based on Availability)
- 16.2.8 Sun Pharmaceutical Industries Limited
- 16.2.8.1. Overview
- 16.2.8.2. Products
- 16.2.8.3. SWOT Analysis
- 16.2.8.4. Recent Developments
- 16.2.8.5. Financials (Based on Availability)
- 16.2.9 Dr Reddy's Laboratories Ltd
- 16.2.9.1. Overview
- 16.2.9.2. Products
- 16.2.9.3. SWOT Analysis
- 16.2.9.4. Recent Developments
- 16.2.9.5. Financials (Based on Availability)
- 16.2.10 Mylan N V
- 16.2.10.1. Overview
- 16.2.10.2. Products
- 16.2.10.3. SWOT Analysis
- 16.2.10.4. Recent Developments
- 16.2.10.5. Financials (Based on Availability)
- 16.2.1 F Hoffmann-La Roche AG (Genentech Inc )
List of Figures
- Figure 1: Global Capecitabine Industry Revenue Breakdown (Million, %) by Region 2024 & 2032
- Figure 2: Global Capecitabine Industry Volume Breakdown (K Unit, %) by Region 2024 & 2032
- Figure 3: North America Capecitabine Industry Revenue (Million), by Country 2024 & 2032
- Figure 4: North America Capecitabine Industry Volume (K Unit), by Country 2024 & 2032
- Figure 5: North America Capecitabine Industry Revenue Share (%), by Country 2024 & 2032
- Figure 6: North America Capecitabine Industry Volume Share (%), by Country 2024 & 2032
- Figure 7: Europe Capecitabine Industry Revenue (Million), by Country 2024 & 2032
- Figure 8: Europe Capecitabine Industry Volume (K Unit), by Country 2024 & 2032
- Figure 9: Europe Capecitabine Industry Revenue Share (%), by Country 2024 & 2032
- Figure 10: Europe Capecitabine Industry Volume Share (%), by Country 2024 & 2032
- Figure 11: Asia Pacific Capecitabine Industry Revenue (Million), by Country 2024 & 2032
- Figure 12: Asia Pacific Capecitabine Industry Volume (K Unit), by Country 2024 & 2032
- Figure 13: Asia Pacific Capecitabine Industry Revenue Share (%), by Country 2024 & 2032
- Figure 14: Asia Pacific Capecitabine Industry Volume Share (%), by Country 2024 & 2032
- Figure 15: Middle East and Africa Capecitabine Industry Revenue (Million), by Country 2024 & 2032
- Figure 16: Middle East and Africa Capecitabine Industry Volume (K Unit), by Country 2024 & 2032
- Figure 17: Middle East and Africa Capecitabine Industry Revenue Share (%), by Country 2024 & 2032
- Figure 18: Middle East and Africa Capecitabine Industry Volume Share (%), by Country 2024 & 2032
- Figure 19: South America Capecitabine Industry Revenue (Million), by Country 2024 & 2032
- Figure 20: South America Capecitabine Industry Volume (K Unit), by Country 2024 & 2032
- Figure 21: South America Capecitabine Industry Revenue Share (%), by Country 2024 & 2032
- Figure 22: South America Capecitabine Industry Volume Share (%), by Country 2024 & 2032
- Figure 23: North America Capecitabine Industry Revenue (Million), by Indication 2024 & 2032
- Figure 24: North America Capecitabine Industry Volume (K Unit), by Indication 2024 & 2032
- Figure 25: North America Capecitabine Industry Revenue Share (%), by Indication 2024 & 2032
- Figure 26: North America Capecitabine Industry Volume Share (%), by Indication 2024 & 2032
- Figure 27: North America Capecitabine Industry Revenue (Million), by Distribution Channel 2024 & 2032
- Figure 28: North America Capecitabine Industry Volume (K Unit), by Distribution Channel 2024 & 2032
- Figure 29: North America Capecitabine Industry Revenue Share (%), by Distribution Channel 2024 & 2032
- Figure 30: North America Capecitabine Industry Volume Share (%), by Distribution Channel 2024 & 2032
- Figure 31: North America Capecitabine Industry Revenue (Million), by Country 2024 & 2032
- Figure 32: North America Capecitabine Industry Volume (K Unit), by Country 2024 & 2032
- Figure 33: North America Capecitabine Industry Revenue Share (%), by Country 2024 & 2032
- Figure 34: North America Capecitabine Industry Volume Share (%), by Country 2024 & 2032
- Figure 35: Europe Capecitabine Industry Revenue (Million), by Indication 2024 & 2032
- Figure 36: Europe Capecitabine Industry Volume (K Unit), by Indication 2024 & 2032
- Figure 37: Europe Capecitabine Industry Revenue Share (%), by Indication 2024 & 2032
- Figure 38: Europe Capecitabine Industry Volume Share (%), by Indication 2024 & 2032
- Figure 39: Europe Capecitabine Industry Revenue (Million), by Distribution Channel 2024 & 2032
- Figure 40: Europe Capecitabine Industry Volume (K Unit), by Distribution Channel 2024 & 2032
- Figure 41: Europe Capecitabine Industry Revenue Share (%), by Distribution Channel 2024 & 2032
- Figure 42: Europe Capecitabine Industry Volume Share (%), by Distribution Channel 2024 & 2032
- Figure 43: Europe Capecitabine Industry Revenue (Million), by Country 2024 & 2032
- Figure 44: Europe Capecitabine Industry Volume (K Unit), by Country 2024 & 2032
- Figure 45: Europe Capecitabine Industry Revenue Share (%), by Country 2024 & 2032
- Figure 46: Europe Capecitabine Industry Volume Share (%), by Country 2024 & 2032
- Figure 47: Asia Pacific Capecitabine Industry Revenue (Million), by Indication 2024 & 2032
- Figure 48: Asia Pacific Capecitabine Industry Volume (K Unit), by Indication 2024 & 2032
- Figure 49: Asia Pacific Capecitabine Industry Revenue Share (%), by Indication 2024 & 2032
- Figure 50: Asia Pacific Capecitabine Industry Volume Share (%), by Indication 2024 & 2032
- Figure 51: Asia Pacific Capecitabine Industry Revenue (Million), by Distribution Channel 2024 & 2032
- Figure 52: Asia Pacific Capecitabine Industry Volume (K Unit), by Distribution Channel 2024 & 2032
- Figure 53: Asia Pacific Capecitabine Industry Revenue Share (%), by Distribution Channel 2024 & 2032
- Figure 54: Asia Pacific Capecitabine Industry Volume Share (%), by Distribution Channel 2024 & 2032
- Figure 55: Asia Pacific Capecitabine Industry Revenue (Million), by Country 2024 & 2032
- Figure 56: Asia Pacific Capecitabine Industry Volume (K Unit), by Country 2024 & 2032
- Figure 57: Asia Pacific Capecitabine Industry Revenue Share (%), by Country 2024 & 2032
- Figure 58: Asia Pacific Capecitabine Industry Volume Share (%), by Country 2024 & 2032
- Figure 59: Middle East and Africa Capecitabine Industry Revenue (Million), by Indication 2024 & 2032
- Figure 60: Middle East and Africa Capecitabine Industry Volume (K Unit), by Indication 2024 & 2032
- Figure 61: Middle East and Africa Capecitabine Industry Revenue Share (%), by Indication 2024 & 2032
- Figure 62: Middle East and Africa Capecitabine Industry Volume Share (%), by Indication 2024 & 2032
- Figure 63: Middle East and Africa Capecitabine Industry Revenue (Million), by Distribution Channel 2024 & 2032
- Figure 64: Middle East and Africa Capecitabine Industry Volume (K Unit), by Distribution Channel 2024 & 2032
- Figure 65: Middle East and Africa Capecitabine Industry Revenue Share (%), by Distribution Channel 2024 & 2032
- Figure 66: Middle East and Africa Capecitabine Industry Volume Share (%), by Distribution Channel 2024 & 2032
- Figure 67: Middle East and Africa Capecitabine Industry Revenue (Million), by Country 2024 & 2032
- Figure 68: Middle East and Africa Capecitabine Industry Volume (K Unit), by Country 2024 & 2032
- Figure 69: Middle East and Africa Capecitabine Industry Revenue Share (%), by Country 2024 & 2032
- Figure 70: Middle East and Africa Capecitabine Industry Volume Share (%), by Country 2024 & 2032
- Figure 71: South America Capecitabine Industry Revenue (Million), by Indication 2024 & 2032
- Figure 72: South America Capecitabine Industry Volume (K Unit), by Indication 2024 & 2032
- Figure 73: South America Capecitabine Industry Revenue Share (%), by Indication 2024 & 2032
- Figure 74: South America Capecitabine Industry Volume Share (%), by Indication 2024 & 2032
- Figure 75: South America Capecitabine Industry Revenue (Million), by Distribution Channel 2024 & 2032
- Figure 76: South America Capecitabine Industry Volume (K Unit), by Distribution Channel 2024 & 2032
- Figure 77: South America Capecitabine Industry Revenue Share (%), by Distribution Channel 2024 & 2032
- Figure 78: South America Capecitabine Industry Volume Share (%), by Distribution Channel 2024 & 2032
- Figure 79: South America Capecitabine Industry Revenue (Million), by Country 2024 & 2032
- Figure 80: South America Capecitabine Industry Volume (K Unit), by Country 2024 & 2032
- Figure 81: South America Capecitabine Industry Revenue Share (%), by Country 2024 & 2032
- Figure 82: South America Capecitabine Industry Volume Share (%), by Country 2024 & 2032
List of Tables
- Table 1: Global Capecitabine Industry Revenue Million Forecast, by Region 2019 & 2032
- Table 2: Global Capecitabine Industry Volume K Unit Forecast, by Region 2019 & 2032
- Table 3: Global Capecitabine Industry Revenue Million Forecast, by Indication 2019 & 2032
- Table 4: Global Capecitabine Industry Volume K Unit Forecast, by Indication 2019 & 2032
- Table 5: Global Capecitabine Industry Revenue Million Forecast, by Distribution Channel 2019 & 2032
- Table 6: Global Capecitabine Industry Volume K Unit Forecast, by Distribution Channel 2019 & 2032
- Table 7: Global Capecitabine Industry Revenue Million Forecast, by Region 2019 & 2032
- Table 8: Global Capecitabine Industry Volume K Unit Forecast, by Region 2019 & 2032
- Table 9: Global Capecitabine Industry Revenue Million Forecast, by Country 2019 & 2032
- Table 10: Global Capecitabine Industry Volume K Unit Forecast, by Country 2019 & 2032
- Table 11: United States Capecitabine Industry Revenue (Million) Forecast, by Application 2019 & 2032
- Table 12: United States Capecitabine Industry Volume (K Unit) Forecast, by Application 2019 & 2032
- Table 13: Canada Capecitabine Industry Revenue (Million) Forecast, by Application 2019 & 2032
- Table 14: Canada Capecitabine Industry Volume (K Unit) Forecast, by Application 2019 & 2032
- Table 15: Mexico Capecitabine Industry Revenue (Million) Forecast, by Application 2019 & 2032
- Table 16: Mexico Capecitabine Industry Volume (K Unit) Forecast, by Application 2019 & 2032
- Table 17: Global Capecitabine Industry Revenue Million Forecast, by Country 2019 & 2032
- Table 18: Global Capecitabine Industry Volume K Unit Forecast, by Country 2019 & 2032
- Table 19: Germany Capecitabine Industry Revenue (Million) Forecast, by Application 2019 & 2032
- Table 20: Germany Capecitabine Industry Volume (K Unit) Forecast, by Application 2019 & 2032
- Table 21: United Kingdom Capecitabine Industry Revenue (Million) Forecast, by Application 2019 & 2032
- Table 22: United Kingdom Capecitabine Industry Volume (K Unit) Forecast, by Application 2019 & 2032
- Table 23: France Capecitabine Industry Revenue (Million) Forecast, by Application 2019 & 2032
- Table 24: France Capecitabine Industry Volume (K Unit) Forecast, by Application 2019 & 2032
- Table 25: Italy Capecitabine Industry Revenue (Million) Forecast, by Application 2019 & 2032
- Table 26: Italy Capecitabine Industry Volume (K Unit) Forecast, by Application 2019 & 2032
- Table 27: Spain Capecitabine Industry Revenue (Million) Forecast, by Application 2019 & 2032
- Table 28: Spain Capecitabine Industry Volume (K Unit) Forecast, by Application 2019 & 2032
- Table 29: Rest of Europe Capecitabine Industry Revenue (Million) Forecast, by Application 2019 & 2032
- Table 30: Rest of Europe Capecitabine Industry Volume (K Unit) Forecast, by Application 2019 & 2032
- Table 31: Global Capecitabine Industry Revenue Million Forecast, by Country 2019 & 2032
- Table 32: Global Capecitabine Industry Volume K Unit Forecast, by Country 2019 & 2032
- Table 33: China Capecitabine Industry Revenue (Million) Forecast, by Application 2019 & 2032
- Table 34: China Capecitabine Industry Volume (K Unit) Forecast, by Application 2019 & 2032
- Table 35: Japan Capecitabine Industry Revenue (Million) Forecast, by Application 2019 & 2032
- Table 36: Japan Capecitabine Industry Volume (K Unit) Forecast, by Application 2019 & 2032
- Table 37: India Capecitabine Industry Revenue (Million) Forecast, by Application 2019 & 2032
- Table 38: India Capecitabine Industry Volume (K Unit) Forecast, by Application 2019 & 2032
- Table 39: Australia Capecitabine Industry Revenue (Million) Forecast, by Application 2019 & 2032
- Table 40: Australia Capecitabine Industry Volume (K Unit) Forecast, by Application 2019 & 2032
- Table 41: South Korea Capecitabine Industry Revenue (Million) Forecast, by Application 2019 & 2032
- Table 42: South Korea Capecitabine Industry Volume (K Unit) Forecast, by Application 2019 & 2032
- Table 43: Rest of Asia Pacific Capecitabine Industry Revenue (Million) Forecast, by Application 2019 & 2032
- Table 44: Rest of Asia Pacific Capecitabine Industry Volume (K Unit) Forecast, by Application 2019 & 2032
- Table 45: Global Capecitabine Industry Revenue Million Forecast, by Country 2019 & 2032
- Table 46: Global Capecitabine Industry Volume K Unit Forecast, by Country 2019 & 2032
- Table 47: GCC Capecitabine Industry Revenue (Million) Forecast, by Application 2019 & 2032
- Table 48: GCC Capecitabine Industry Volume (K Unit) Forecast, by Application 2019 & 2032
- Table 49: South Africa Capecitabine Industry Revenue (Million) Forecast, by Application 2019 & 2032
- Table 50: South Africa Capecitabine Industry Volume (K Unit) Forecast, by Application 2019 & 2032
- Table 51: Rest of Middle East and Africa Capecitabine Industry Revenue (Million) Forecast, by Application 2019 & 2032
- Table 52: Rest of Middle East and Africa Capecitabine Industry Volume (K Unit) Forecast, by Application 2019 & 2032
- Table 53: Global Capecitabine Industry Revenue Million Forecast, by Country 2019 & 2032
- Table 54: Global Capecitabine Industry Volume K Unit Forecast, by Country 2019 & 2032
- Table 55: Brazil Capecitabine Industry Revenue (Million) Forecast, by Application 2019 & 2032
- Table 56: Brazil Capecitabine Industry Volume (K Unit) Forecast, by Application 2019 & 2032
- Table 57: Argentina Capecitabine Industry Revenue (Million) Forecast, by Application 2019 & 2032
- Table 58: Argentina Capecitabine Industry Volume (K Unit) Forecast, by Application 2019 & 2032
- Table 59: Rest of South America Capecitabine Industry Revenue (Million) Forecast, by Application 2019 & 2032
- Table 60: Rest of South America Capecitabine Industry Volume (K Unit) Forecast, by Application 2019 & 2032
- Table 61: Global Capecitabine Industry Revenue Million Forecast, by Indication 2019 & 2032
- Table 62: Global Capecitabine Industry Volume K Unit Forecast, by Indication 2019 & 2032
- Table 63: Global Capecitabine Industry Revenue Million Forecast, by Distribution Channel 2019 & 2032
- Table 64: Global Capecitabine Industry Volume K Unit Forecast, by Distribution Channel 2019 & 2032
- Table 65: Global Capecitabine Industry Revenue Million Forecast, by Country 2019 & 2032
- Table 66: Global Capecitabine Industry Volume K Unit Forecast, by Country 2019 & 2032
- Table 67: United States Capecitabine Industry Revenue (Million) Forecast, by Application 2019 & 2032
- Table 68: United States Capecitabine Industry Volume (K Unit) Forecast, by Application 2019 & 2032
- Table 69: Canada Capecitabine Industry Revenue (Million) Forecast, by Application 2019 & 2032
- Table 70: Canada Capecitabine Industry Volume (K Unit) Forecast, by Application 2019 & 2032
- Table 71: Mexico Capecitabine Industry Revenue (Million) Forecast, by Application 2019 & 2032
- Table 72: Mexico Capecitabine Industry Volume (K Unit) Forecast, by Application 2019 & 2032
- Table 73: Global Capecitabine Industry Revenue Million Forecast, by Indication 2019 & 2032
- Table 74: Global Capecitabine Industry Volume K Unit Forecast, by Indication 2019 & 2032
- Table 75: Global Capecitabine Industry Revenue Million Forecast, by Distribution Channel 2019 & 2032
- Table 76: Global Capecitabine Industry Volume K Unit Forecast, by Distribution Channel 2019 & 2032
- Table 77: Global Capecitabine Industry Revenue Million Forecast, by Country 2019 & 2032
- Table 78: Global Capecitabine Industry Volume K Unit Forecast, by Country 2019 & 2032
- Table 79: Germany Capecitabine Industry Revenue (Million) Forecast, by Application 2019 & 2032
- Table 80: Germany Capecitabine Industry Volume (K Unit) Forecast, by Application 2019 & 2032
- Table 81: United Kingdom Capecitabine Industry Revenue (Million) Forecast, by Application 2019 & 2032
- Table 82: United Kingdom Capecitabine Industry Volume (K Unit) Forecast, by Application 2019 & 2032
- Table 83: France Capecitabine Industry Revenue (Million) Forecast, by Application 2019 & 2032
- Table 84: France Capecitabine Industry Volume (K Unit) Forecast, by Application 2019 & 2032
- Table 85: Italy Capecitabine Industry Revenue (Million) Forecast, by Application 2019 & 2032
- Table 86: Italy Capecitabine Industry Volume (K Unit) Forecast, by Application 2019 & 2032
- Table 87: Spain Capecitabine Industry Revenue (Million) Forecast, by Application 2019 & 2032
- Table 88: Spain Capecitabine Industry Volume (K Unit) Forecast, by Application 2019 & 2032
- Table 89: Rest of Europe Capecitabine Industry Revenue (Million) Forecast, by Application 2019 & 2032
- Table 90: Rest of Europe Capecitabine Industry Volume (K Unit) Forecast, by Application 2019 & 2032
- Table 91: Global Capecitabine Industry Revenue Million Forecast, by Indication 2019 & 2032
- Table 92: Global Capecitabine Industry Volume K Unit Forecast, by Indication 2019 & 2032
- Table 93: Global Capecitabine Industry Revenue Million Forecast, by Distribution Channel 2019 & 2032
- Table 94: Global Capecitabine Industry Volume K Unit Forecast, by Distribution Channel 2019 & 2032
- Table 95: Global Capecitabine Industry Revenue Million Forecast, by Country 2019 & 2032
- Table 96: Global Capecitabine Industry Volume K Unit Forecast, by Country 2019 & 2032
- Table 97: China Capecitabine Industry Revenue (Million) Forecast, by Application 2019 & 2032
- Table 98: China Capecitabine Industry Volume (K Unit) Forecast, by Application 2019 & 2032
- Table 99: Japan Capecitabine Industry Revenue (Million) Forecast, by Application 2019 & 2032
- Table 100: Japan Capecitabine Industry Volume (K Unit) Forecast, by Application 2019 & 2032
- Table 101: India Capecitabine Industry Revenue (Million) Forecast, by Application 2019 & 2032
- Table 102: India Capecitabine Industry Volume (K Unit) Forecast, by Application 2019 & 2032
- Table 103: Australia Capecitabine Industry Revenue (Million) Forecast, by Application 2019 & 2032
- Table 104: Australia Capecitabine Industry Volume (K Unit) Forecast, by Application 2019 & 2032
- Table 105: South Korea Capecitabine Industry Revenue (Million) Forecast, by Application 2019 & 2032
- Table 106: South Korea Capecitabine Industry Volume (K Unit) Forecast, by Application 2019 & 2032
- Table 107: Rest of Asia Pacific Capecitabine Industry Revenue (Million) Forecast, by Application 2019 & 2032
- Table 108: Rest of Asia Pacific Capecitabine Industry Volume (K Unit) Forecast, by Application 2019 & 2032
- Table 109: Global Capecitabine Industry Revenue Million Forecast, by Indication 2019 & 2032
- Table 110: Global Capecitabine Industry Volume K Unit Forecast, by Indication 2019 & 2032
- Table 111: Global Capecitabine Industry Revenue Million Forecast, by Distribution Channel 2019 & 2032
- Table 112: Global Capecitabine Industry Volume K Unit Forecast, by Distribution Channel 2019 & 2032
- Table 113: Global Capecitabine Industry Revenue Million Forecast, by Country 2019 & 2032
- Table 114: Global Capecitabine Industry Volume K Unit Forecast, by Country 2019 & 2032
- Table 115: GCC Capecitabine Industry Revenue (Million) Forecast, by Application 2019 & 2032
- Table 116: GCC Capecitabine Industry Volume (K Unit) Forecast, by Application 2019 & 2032
- Table 117: South Africa Capecitabine Industry Revenue (Million) Forecast, by Application 2019 & 2032
- Table 118: South Africa Capecitabine Industry Volume (K Unit) Forecast, by Application 2019 & 2032
- Table 119: Rest of Middle East and Africa Capecitabine Industry Revenue (Million) Forecast, by Application 2019 & 2032
- Table 120: Rest of Middle East and Africa Capecitabine Industry Volume (K Unit) Forecast, by Application 2019 & 2032
- Table 121: Global Capecitabine Industry Revenue Million Forecast, by Indication 2019 & 2032
- Table 122: Global Capecitabine Industry Volume K Unit Forecast, by Indication 2019 & 2032
- Table 123: Global Capecitabine Industry Revenue Million Forecast, by Distribution Channel 2019 & 2032
- Table 124: Global Capecitabine Industry Volume K Unit Forecast, by Distribution Channel 2019 & 2032
- Table 125: Global Capecitabine Industry Revenue Million Forecast, by Country 2019 & 2032
- Table 126: Global Capecitabine Industry Volume K Unit Forecast, by Country 2019 & 2032
- Table 127: Brazil Capecitabine Industry Revenue (Million) Forecast, by Application 2019 & 2032
- Table 128: Brazil Capecitabine Industry Volume (K Unit) Forecast, by Application 2019 & 2032
- Table 129: Argentina Capecitabine Industry Revenue (Million) Forecast, by Application 2019 & 2032
- Table 130: Argentina Capecitabine Industry Volume (K Unit) Forecast, by Application 2019 & 2032
- Table 131: Rest of South America Capecitabine Industry Revenue (Million) Forecast, by Application 2019 & 2032
- Table 132: Rest of South America Capecitabine Industry Volume (K Unit) Forecast, by Application 2019 & 2032
Frequently Asked Questions
1. What is the projected Compound Annual Growth Rate (CAGR) of the Capecitabine Industry?
The projected CAGR is approximately 5.50%.
2. Which companies are prominent players in the Capecitabine Industry?
Key companies in the market include F Hoffmann-La Roche AG (Genentech Inc ), Teva Pharmaceuticals Inc, Cipla Inc, Hikma Pharmaceuticals PLC, Intas Pharmaceuticals Limited, Fresenius SE & Co KGaA, Armas Pharmaceuticals Inc, Sun Pharmaceutical Industries Limited, Dr Reddy's Laboratories Ltd, Mylan N V.
3. What are the main segments of the Capecitabine Industry?
The market segments include Indication, Distribution Channel.
4. Can you provide details about the market size?
The market size is estimated to be USD XX Million as of 2022.
5. What are some drivers contributing to market growth?
; Rising Government Initiatives to Control Growing Global Cancer Burden; Increasing Incidence of Cancers Around the World.
6. What are the notable trends driving market growth?
Breast Cancer by Indication is Expected to Hold the Largest Market Share in the Global Capecitabine Market.
7. Are there any restraints impacting market growth?
; Highly Expensive Products and Treatment; Rising Adoption of Substitutes like Raltitrexed. Irinotecan and Leucovorin for Adjuvant Therapy.
8. Can you provide examples of recent developments in the market?
N/A
9. What pricing options are available for accessing the report?
Pricing options include single-user, multi-user, and enterprise licenses priced at USD 4750, USD 5250, and USD 8750 respectively.
10. Is the market size provided in terms of value or volume?
The market size is provided in terms of value, measured in Million and volume, measured in K Unit.
11. Are there any specific market keywords associated with the report?
Yes, the market keyword associated with the report is "Capecitabine Industry," which aids in identifying and referencing the specific market segment covered.
12. How do I determine which pricing option suits my needs best?
The pricing options vary based on user requirements and access needs. Individual users may opt for single-user licenses, while businesses requiring broader access may choose multi-user or enterprise licenses for cost-effective access to the report.
13. Are there any additional resources or data provided in the Capecitabine Industry report?
While the report offers comprehensive insights, it's advisable to review the specific contents or supplementary materials provided to ascertain if additional resources or data are available.
14. How can I stay updated on further developments or reports in the Capecitabine Industry?
To stay informed about further developments, trends, and reports in the Capecitabine Industry, consider subscribing to industry newsletters, following relevant companies and organizations, or regularly checking reputable industry news sources and publications.
Methodology
Step 1 - Identification of Relevant Samples Size from Population Database


Step 2 - Approaches for Defining Global Market Size (Value, Volume* & Price*)

Note*: In applicable scenarios
Step 3 - Data Sources
Primary Research
- Web Analytics
- Survey Reports
- Research Institute
- Latest Research Reports
- Opinion Leaders
Secondary Research
- Annual Reports
- White Paper
- Latest Press Release
- Industry Association
- Paid Database
- Investor Presentations

Step 4 - Data Triangulation
Involves using different sources of information in order to increase the validity of a study
These sources are likely to be stakeholders in a program - participants, other researchers, program staff, other community members, and so on.
Then we put all data in single framework & apply various statistical tools to find out the dynamic on the market.
During the analysis stage, feedback from the stakeholder groups would be compared to determine areas of agreement as well as areas of divergence
