

Key Insights
The CBRNe (Chemical, Biological, Radiological, Nuclear, and Explosive) defense industry is experiencing robust growth, driven by escalating geopolitical instability, increasing terrorist threats, and the rising awareness of potential pandemics. A 6.90% CAGR indicates a significant market expansion, projected to reach substantial value by 2033. The market is segmented by purpose (detection, protection, decontamination, simulation & training) and application (military, civil, and law enforcement), reflecting diverse needs across various sectors. The military segment currently holds a dominant market share, fueled by substantial defense budgets and technological advancements in CBRNe countermeasures. However, the civil and law enforcement segments are experiencing accelerated growth, driven by increasing urban vulnerability to CBRNe threats and the need for robust emergency response capabilities. Key growth drivers include the development of sophisticated detection technologies, advancements in personal protective equipment (PPE), and the increasing demand for effective decontamination solutions. While regulatory hurdles and high initial investment costs pose some restraints, the overall market outlook remains positive, with technological innovation and government investment continuing to fuel expansion.
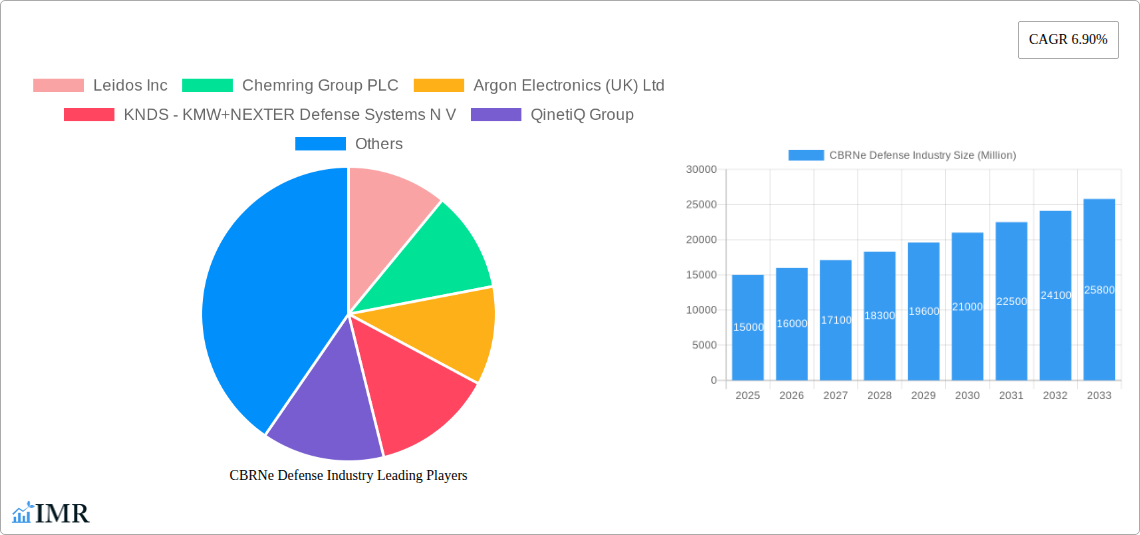
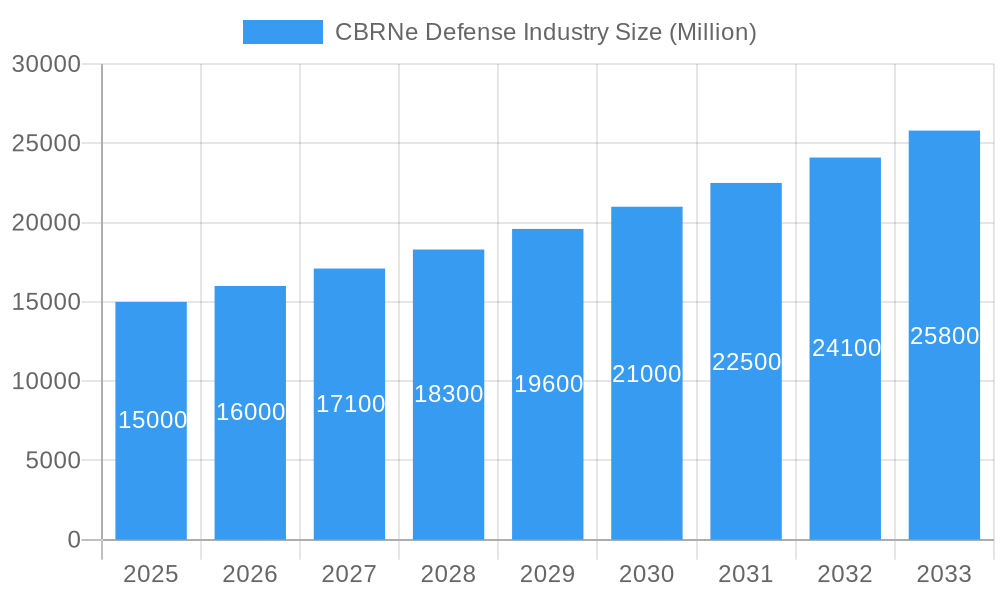
CBRNe Defense Industry Market Size (In Billion)
Technological advancements, such as the development of portable and highly sensitive detection devices, autonomous decontamination systems, and advanced simulation tools for training purposes, are further accelerating market growth. The integration of artificial intelligence (AI) and machine learning (ML) in CBRNe systems promises to enhance detection accuracy, speed up response times, and optimize resource allocation. Furthermore, increasing collaboration between government agencies, private companies, and research institutions is leading to the development of more efficient and effective CBRNe defense solutions. Regional variations exist, with North America and Europe currently holding significant market shares due to established infrastructure and higher defense spending. However, the Asia-Pacific region is projected to witness the fastest growth in the coming years, driven by rising defense budgets and increasing awareness of CBRNe risks in rapidly developing economies. The competitive landscape is characterized by a mix of large multinational corporations and specialized smaller companies, each contributing to the diverse offerings available in the market.
CBRNe Defense Industry Company Market Share
CBRNe Defense Industry Market Report: 2019-2033
This comprehensive report provides a detailed analysis of the CBRNe defense industry, encompassing market dynamics, growth trends, regional segmentation, product landscape, and key players. With a study period spanning 2019-2033, a base year of 2025, and a forecast period of 2025-2033, this report offers invaluable insights for industry professionals, investors, and strategic decision-makers. The report analyzes the parent market of Defense and the child market of CBRNe Defense, offering a granular understanding of market segments including Detection, Protection, Decontamination, and Simulation & Training across Military, Civil, and Law Enforcement applications.
Expected Market Size (USD Million):
- 2019: xx
- 2024: xx
- 2025 (Base Year): 25000
- 2033 (Estimated): 40000
CBRNe Defense Industry Market Dynamics & Structure
The CBRNe defense market is characterized by moderate concentration, with several major players holding significant market share. Technological innovation, driven by advancements in sensor technology, AI, and unmanned systems, is a key driver. Stringent regulatory frameworks governing the development, deployment, and use of CBRNe defense technologies influence market growth. The market also faces competition from substitute technologies and products, and M&A activities are shaping the industry landscape.
- Market Concentration: Moderately concentrated, with top 5 players holding approximately xx% of market share in 2024.
- Technological Innovation: Significant advancements in miniaturization, AI-powered threat detection, and drone integration are accelerating market growth.
- Regulatory Framework: Stringent regulations regarding the handling and disposal of hazardous materials and export controls impact market dynamics.
- Competitive Substitutes: Alternative technologies and approaches (e.g., advanced filtration systems) compete for market share.
- End-User Demographics: Primarily driven by military and government agencies, with growing demand from civil and law enforcement sectors.
- M&A Trends: Consolidation through mergers and acquisitions is anticipated to continue, driven by the need for technological synergy and expanded market reach. The number of M&A deals in 2024 was approximately xx.
CBRNe Defense Industry Growth Trends & Insights
The CBRNe defense market experienced significant growth between 2019 and 2024, driven by increasing global geopolitical instability, heightened awareness of CBRNe threats, and substantial investments in defense spending. Adoption rates of advanced CBRNe detection and protection technologies are steadily increasing, propelled by technological disruptions such as AI-powered threat assessment and autonomous reconnaissance systems. This growth is further supported by changing consumer behavior, particularly among governments prioritizing homeland security and national defense.
- Market Size Evolution: The market exhibited a CAGR of xx% during 2019-2024 and is projected to grow at a CAGR of xx% from 2025 to 2033.
- Adoption Rates: The adoption of advanced CBRNe technologies is increasing at a rate of xx% annually.
- Technological Disruptions: AI-powered solutions and autonomous systems are revolutionizing CBRNe defense capabilities.
- Consumer Behavior Shifts: Governments and organizations are increasingly prioritizing comprehensive CBRNe protection strategies.
Dominant Regions, Countries, or Segments in CBRNe Defense Industry
North America (primarily the US) currently dominates the CBRNe defense market, owing to substantial defense spending, robust technological infrastructure, and a high level of awareness regarding CBRNe threats. The Military segment is the largest, driven by high demand for advanced detection and protection systems. However, significant growth is anticipated in the civil and law enforcement segments, particularly in regions experiencing rapid urbanization and rising security concerns.
- Key Drivers:
- North America: High defense budgets, advanced technological capabilities, and strong government support.
- Europe: Growing concerns about terrorism and chemical weapons proliferation.
- Asia-Pacific: Rising defense expenditure and the need to protect critical infrastructure.
- Dominant Segments:
- Military: Largest segment due to high demand for advanced CBRNe defense systems.
- Detection: Highest growth segment, driven by demand for sensitive and accurate detection technologies.
CBRNe Defense Industry Product Landscape
The CBRNe defense product landscape encompasses a wide range of technologies, including advanced sensors, personal protective equipment (PPE), decontamination systems, and simulation and training tools. These products are characterized by high levels of sophistication, incorporating miniaturization, portability, and ease of use. Unique selling propositions (USPs) often involve advanced detection capabilities, enhanced safety features, and improved user interfaces. Technological advancements are focused on improving the sensitivity, speed, and reliability of CBRNe detection, as well as developing more effective and user-friendly decontamination systems.
Key Drivers, Barriers & Challenges in CBRNe Defense Industry
Key Drivers:
- Increased global geopolitical instability and terrorist threats.
- Rising defense budgets worldwide.
- Technological advancements in sensor technology, AI, and unmanned systems.
- Growing demand for improved CBRNe protection from civil and law enforcement agencies.
Challenges and Restraints:
- High cost of advanced CBRNe technologies.
- Stringent regulatory approvals and testing requirements.
- Complex supply chains and potential disruptions.
- The need for continuous technological upgrades to counter emerging threats.
Emerging Opportunities in CBRNe Defense Industry
- Expanding into emerging markets: Significant untapped potential exists in developing countries.
- Development of AI-powered solutions: Artificial intelligence and machine learning offer opportunities for improved threat detection and response.
- Integration of drones and unmanned systems: Autonomous reconnaissance and decontamination capabilities are highly sought after.
Growth Accelerators in the CBRNe Defense Industry
Technological breakthroughs, especially in AI and sensor technologies, are driving rapid innovation and improved capabilities in the CBRNe defense industry. Strategic partnerships between defense contractors, research institutions, and government agencies are crucial for developing and deploying advanced systems. Expansion into new markets, both geographically and application-wise (e.g., industrial security), offers significant growth opportunities.
Key Players Shaping the CBRNe Defense Market
- Leidos Inc
- Chemring Group PLC
- Argon Electronics (UK) Ltd
- KNDS - KMW+NEXTER Defense Systems N V
- QinetiQ Group
- Smiths Group plc
- National Technology and Engineering Solutions of Sandia LLC
- Battelle
- Avon Polymer Products Limited
- OSI Systems Inc
- Saab AB
- Karcher Futuretech GmbH
- Teledyne FLIR LLC
Notable Milestones in CBRNe Defense Industry Sector
- April 2022: Kromek awarded a GBP 1.7 million (USD 2.23 million) contract for CBRN detection services and products.
- February 2023: Teledyne FLIR awarded a USD 13.3 million contract to expand the CBRN reconnaissance capabilities of its R80D SkyRaider UAS.
In-Depth CBRNe Defense Industry Market Outlook
The CBRNe defense market is poised for continued robust growth, driven by persistent global security concerns and the ongoing development of more sophisticated and effective CBRNe defense technologies. Strategic partnerships and investments in R&D will be critical in shaping the future landscape. The market presents significant opportunities for companies that can develop innovative solutions, adapt to evolving threats, and meet the growing demand for advanced CBRNe protection across diverse applications.
CBRNe Defense Industry Segmentation
- 1. Production Analysis
- 2. Consumption Analysis
- 3. Import Market Analysis (Value & Volume)
- 4. Export Market Analysis (Value & Volume)
- 5. Price Trend Analysis
CBRNe Defense Industry Segmentation By Geography
-
1. North America
- 1.1. United States
- 1.2. Canada
- 1.3. Mexico
-
2. South America
- 2.1. Brazil
- 2.2. Argentina
- 2.3. Rest of South America
-
3. Europe
- 3.1. United Kingdom
- 3.2. Germany
- 3.3. France
- 3.4. Italy
- 3.5. Spain
- 3.6. Russia
- 3.7. Benelux
- 3.8. Nordics
- 3.9. Rest of Europe
-
4. Middle East & Africa
- 4.1. Turkey
- 4.2. Israel
- 4.3. GCC
- 4.4. North Africa
- 4.5. South Africa
- 4.6. Rest of Middle East & Africa
-
5. Asia Pacific
- 5.1. China
- 5.2. India
- 5.3. Japan
- 5.4. South Korea
- 5.5. ASEAN
- 5.6. Oceania
- 5.7. Rest of Asia Pacific
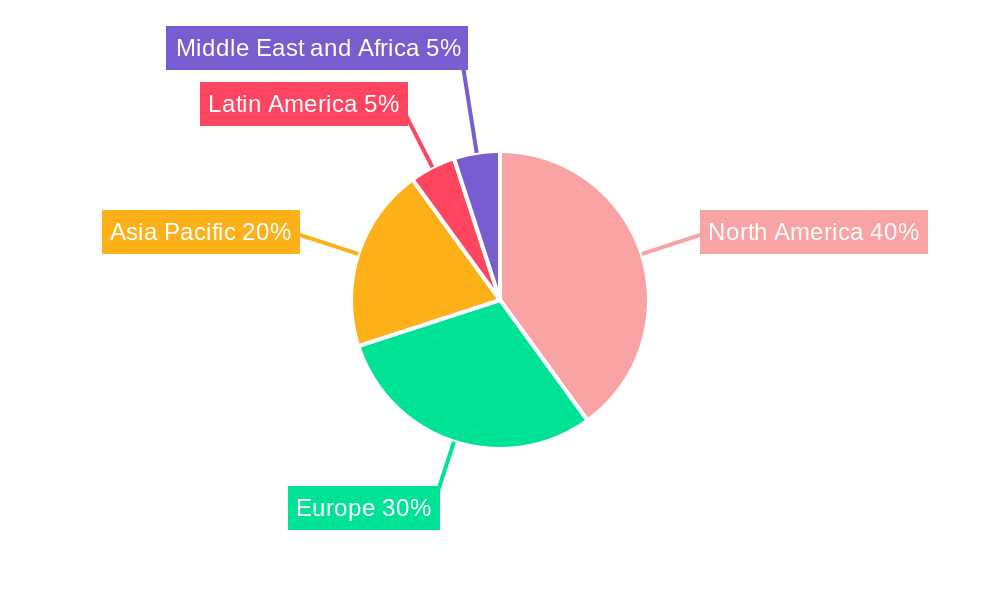
CBRNe Defense Industry Regional Market Share
Geographic Coverage of CBRNe Defense Industry
CBRNe Defense Industry REPORT HIGHLIGHTS
| Aspects | Details |
|---|---|
| Study Period | 2020-2034 |
| Base Year | 2025 |
| Estimated Year | 2026 |
| Forecast Period | 2026-2034 |
| Historical Period | 2020-2025 |
| Growth Rate | CAGR of 5.92% from 2020-2034 |
| Segmentation |
|
Table of Contents
- 1. Introduction
- 1.1. Research Scope
- 1.2. Market Segmentation
- 1.3. Research Methodology
- 1.4. Definitions and Assumptions
- 2. Executive Summary
- 2.1. Introduction
- 3. Market Dynamics
- 3.1. Introduction
- 3.2. Market Drivers
- 3.3. Market Restrains
- 3.4. Market Trends
- 3.4.1. The Military Segment Accounted for Largest Market Share
- 4. Market Factor Analysis
- 4.1. Porters Five Forces
- 4.2. Supply/Value Chain
- 4.3. PESTEL analysis
- 4.4. Market Entropy
- 4.5. Patent/Trademark Analysis
- 5. Global CBRNe Defense Industry Analysis, Insights and Forecast, 2020-2032
- 5.1. Market Analysis, Insights and Forecast - by Production Analysis
- 5.2. Market Analysis, Insights and Forecast - by Consumption Analysis
- 5.3. Market Analysis, Insights and Forecast - by Import Market Analysis (Value & Volume)
- 5.4. Market Analysis, Insights and Forecast - by Export Market Analysis (Value & Volume)
- 5.5. Market Analysis, Insights and Forecast - by Price Trend Analysis
- 5.6. Market Analysis, Insights and Forecast - by Region
- 5.6.1. North America
- 5.6.2. South America
- 5.6.3. Europe
- 5.6.4. Middle East & Africa
- 5.6.5. Asia Pacific
- 5.1. Market Analysis, Insights and Forecast - by Production Analysis
- 6. North America CBRNe Defense Industry Analysis, Insights and Forecast, 2020-2032
- 6.1. Market Analysis, Insights and Forecast - by Production Analysis
- 6.2. Market Analysis, Insights and Forecast - by Consumption Analysis
- 6.3. Market Analysis, Insights and Forecast - by Import Market Analysis (Value & Volume)
- 6.4. Market Analysis, Insights and Forecast - by Export Market Analysis (Value & Volume)
- 6.5. Market Analysis, Insights and Forecast - by Price Trend Analysis
- 6.1. Market Analysis, Insights and Forecast - by Production Analysis
- 7. South America CBRNe Defense Industry Analysis, Insights and Forecast, 2020-2032
- 7.1. Market Analysis, Insights and Forecast - by Production Analysis
- 7.2. Market Analysis, Insights and Forecast - by Consumption Analysis
- 7.3. Market Analysis, Insights and Forecast - by Import Market Analysis (Value & Volume)
- 7.4. Market Analysis, Insights and Forecast - by Export Market Analysis (Value & Volume)
- 7.5. Market Analysis, Insights and Forecast - by Price Trend Analysis
- 7.1. Market Analysis, Insights and Forecast - by Production Analysis
- 8. Europe CBRNe Defense Industry Analysis, Insights and Forecast, 2020-2032
- 8.1. Market Analysis, Insights and Forecast - by Production Analysis
- 8.2. Market Analysis, Insights and Forecast - by Consumption Analysis
- 8.3. Market Analysis, Insights and Forecast - by Import Market Analysis (Value & Volume)
- 8.4. Market Analysis, Insights and Forecast - by Export Market Analysis (Value & Volume)
- 8.5. Market Analysis, Insights and Forecast - by Price Trend Analysis
- 8.1. Market Analysis, Insights and Forecast - by Production Analysis
- 9. Middle East & Africa CBRNe Defense Industry Analysis, Insights and Forecast, 2020-2032
- 9.1. Market Analysis, Insights and Forecast - by Production Analysis
- 9.2. Market Analysis, Insights and Forecast - by Consumption Analysis
- 9.3. Market Analysis, Insights and Forecast - by Import Market Analysis (Value & Volume)
- 9.4. Market Analysis, Insights and Forecast - by Export Market Analysis (Value & Volume)
- 9.5. Market Analysis, Insights and Forecast - by Price Trend Analysis
- 9.1. Market Analysis, Insights and Forecast - by Production Analysis
- 10. Asia Pacific CBRNe Defense Industry Analysis, Insights and Forecast, 2020-2032
- 10.1. Market Analysis, Insights and Forecast - by Production Analysis
- 10.2. Market Analysis, Insights and Forecast - by Consumption Analysis
- 10.3. Market Analysis, Insights and Forecast - by Import Market Analysis (Value & Volume)
- 10.4. Market Analysis, Insights and Forecast - by Export Market Analysis (Value & Volume)
- 10.5. Market Analysis, Insights and Forecast - by Price Trend Analysis
- 10.1. Market Analysis, Insights and Forecast - by Production Analysis
- 11. Competitive Analysis
- 11.1. Global Market Share Analysis 2025
- 11.2. Company Profiles
- 11.2.1 Leidos Inc
- 11.2.1.1. Overview
- 11.2.1.2. Products
- 11.2.1.3. SWOT Analysis
- 11.2.1.4. Recent Developments
- 11.2.1.5. Financials (Based on Availability)
- 11.2.2 Chemring Group PLC
- 11.2.2.1. Overview
- 11.2.2.2. Products
- 11.2.2.3. SWOT Analysis
- 11.2.2.4. Recent Developments
- 11.2.2.5. Financials (Based on Availability)
- 11.2.3 Argon Electronics (UK) Ltd
- 11.2.3.1. Overview
- 11.2.3.2. Products
- 11.2.3.3. SWOT Analysis
- 11.2.3.4. Recent Developments
- 11.2.3.5. Financials (Based on Availability)
- 11.2.4 KNDS - KMW+NEXTER Defense Systems N V
- 11.2.4.1. Overview
- 11.2.4.2. Products
- 11.2.4.3. SWOT Analysis
- 11.2.4.4. Recent Developments
- 11.2.4.5. Financials (Based on Availability)
- 11.2.5 QinetiQ Group
- 11.2.5.1. Overview
- 11.2.5.2. Products
- 11.2.5.3. SWOT Analysis
- 11.2.5.4. Recent Developments
- 11.2.5.5. Financials (Based on Availability)
- 11.2.6 Smiths Group plc
- 11.2.6.1. Overview
- 11.2.6.2. Products
- 11.2.6.3. SWOT Analysis
- 11.2.6.4. Recent Developments
- 11.2.6.5. Financials (Based on Availability)
- 11.2.7 National Technology and Engineering Solutions of Sandia LLC
- 11.2.7.1. Overview
- 11.2.7.2. Products
- 11.2.7.3. SWOT Analysis
- 11.2.7.4. Recent Developments
- 11.2.7.5. Financials (Based on Availability)
- 11.2.8 Battelle
- 11.2.8.1. Overview
- 11.2.8.2. Products
- 11.2.8.3. SWOT Analysis
- 11.2.8.4. Recent Developments
- 11.2.8.5. Financials (Based on Availability)
- 11.2.9 Avon Polymer Products Limited
- 11.2.9.1. Overview
- 11.2.9.2. Products
- 11.2.9.3. SWOT Analysis
- 11.2.9.4. Recent Developments
- 11.2.9.5. Financials (Based on Availability)
- 11.2.10 OSI Systems Inc
- 11.2.10.1. Overview
- 11.2.10.2. Products
- 11.2.10.3. SWOT Analysis
- 11.2.10.4. Recent Developments
- 11.2.10.5. Financials (Based on Availability)
- 11.2.11 Saab AB
- 11.2.11.1. Overview
- 11.2.11.2. Products
- 11.2.11.3. SWOT Analysis
- 11.2.11.4. Recent Developments
- 11.2.11.5. Financials (Based on Availability)
- 11.2.12 Karcher Futuretech GmbH
- 11.2.12.1. Overview
- 11.2.12.2. Products
- 11.2.12.3. SWOT Analysis
- 11.2.12.4. Recent Developments
- 11.2.12.5. Financials (Based on Availability)
- 11.2.13 Teledyne FLIR LLC
- 11.2.13.1. Overview
- 11.2.13.2. Products
- 11.2.13.3. SWOT Analysis
- 11.2.13.4. Recent Developments
- 11.2.13.5. Financials (Based on Availability)
- 11.2.1 Leidos Inc
List of Figures
- Figure 1: Global CBRNe Defense Industry Revenue Breakdown (undefined, %) by Region 2025 & 2033
- Figure 2: North America CBRNe Defense Industry Revenue (undefined), by Production Analysis 2025 & 2033
- Figure 3: North America CBRNe Defense Industry Revenue Share (%), by Production Analysis 2025 & 2033
- Figure 4: North America CBRNe Defense Industry Revenue (undefined), by Consumption Analysis 2025 & 2033
- Figure 5: North America CBRNe Defense Industry Revenue Share (%), by Consumption Analysis 2025 & 2033
- Figure 6: North America CBRNe Defense Industry Revenue (undefined), by Import Market Analysis (Value & Volume) 2025 & 2033
- Figure 7: North America CBRNe Defense Industry Revenue Share (%), by Import Market Analysis (Value & Volume) 2025 & 2033
- Figure 8: North America CBRNe Defense Industry Revenue (undefined), by Export Market Analysis (Value & Volume) 2025 & 2033
- Figure 9: North America CBRNe Defense Industry Revenue Share (%), by Export Market Analysis (Value & Volume) 2025 & 2033
- Figure 10: North America CBRNe Defense Industry Revenue (undefined), by Price Trend Analysis 2025 & 2033
- Figure 11: North America CBRNe Defense Industry Revenue Share (%), by Price Trend Analysis 2025 & 2033
- Figure 12: North America CBRNe Defense Industry Revenue (undefined), by Country 2025 & 2033
- Figure 13: North America CBRNe Defense Industry Revenue Share (%), by Country 2025 & 2033
- Figure 14: South America CBRNe Defense Industry Revenue (undefined), by Production Analysis 2025 & 2033
- Figure 15: South America CBRNe Defense Industry Revenue Share (%), by Production Analysis 2025 & 2033
- Figure 16: South America CBRNe Defense Industry Revenue (undefined), by Consumption Analysis 2025 & 2033
- Figure 17: South America CBRNe Defense Industry Revenue Share (%), by Consumption Analysis 2025 & 2033
- Figure 18: South America CBRNe Defense Industry Revenue (undefined), by Import Market Analysis (Value & Volume) 2025 & 2033
- Figure 19: South America CBRNe Defense Industry Revenue Share (%), by Import Market Analysis (Value & Volume) 2025 & 2033
- Figure 20: South America CBRNe Defense Industry Revenue (undefined), by Export Market Analysis (Value & Volume) 2025 & 2033
- Figure 21: South America CBRNe Defense Industry Revenue Share (%), by Export Market Analysis (Value & Volume) 2025 & 2033
- Figure 22: South America CBRNe Defense Industry Revenue (undefined), by Price Trend Analysis 2025 & 2033
- Figure 23: South America CBRNe Defense Industry Revenue Share (%), by Price Trend Analysis 2025 & 2033
- Figure 24: South America CBRNe Defense Industry Revenue (undefined), by Country 2025 & 2033
- Figure 25: South America CBRNe Defense Industry Revenue Share (%), by Country 2025 & 2033
- Figure 26: Europe CBRNe Defense Industry Revenue (undefined), by Production Analysis 2025 & 2033
- Figure 27: Europe CBRNe Defense Industry Revenue Share (%), by Production Analysis 2025 & 2033
- Figure 28: Europe CBRNe Defense Industry Revenue (undefined), by Consumption Analysis 2025 & 2033
- Figure 29: Europe CBRNe Defense Industry Revenue Share (%), by Consumption Analysis 2025 & 2033
- Figure 30: Europe CBRNe Defense Industry Revenue (undefined), by Import Market Analysis (Value & Volume) 2025 & 2033
- Figure 31: Europe CBRNe Defense Industry Revenue Share (%), by Import Market Analysis (Value & Volume) 2025 & 2033
- Figure 32: Europe CBRNe Defense Industry Revenue (undefined), by Export Market Analysis (Value & Volume) 2025 & 2033
- Figure 33: Europe CBRNe Defense Industry Revenue Share (%), by Export Market Analysis (Value & Volume) 2025 & 2033
- Figure 34: Europe CBRNe Defense Industry Revenue (undefined), by Price Trend Analysis 2025 & 2033
- Figure 35: Europe CBRNe Defense Industry Revenue Share (%), by Price Trend Analysis 2025 & 2033
- Figure 36: Europe CBRNe Defense Industry Revenue (undefined), by Country 2025 & 2033
- Figure 37: Europe CBRNe Defense Industry Revenue Share (%), by Country 2025 & 2033
- Figure 38: Middle East & Africa CBRNe Defense Industry Revenue (undefined), by Production Analysis 2025 & 2033
- Figure 39: Middle East & Africa CBRNe Defense Industry Revenue Share (%), by Production Analysis 2025 & 2033
- Figure 40: Middle East & Africa CBRNe Defense Industry Revenue (undefined), by Consumption Analysis 2025 & 2033
- Figure 41: Middle East & Africa CBRNe Defense Industry Revenue Share (%), by Consumption Analysis 2025 & 2033
- Figure 42: Middle East & Africa CBRNe Defense Industry Revenue (undefined), by Import Market Analysis (Value & Volume) 2025 & 2033
- Figure 43: Middle East & Africa CBRNe Defense Industry Revenue Share (%), by Import Market Analysis (Value & Volume) 2025 & 2033
- Figure 44: Middle East & Africa CBRNe Defense Industry Revenue (undefined), by Export Market Analysis (Value & Volume) 2025 & 2033
- Figure 45: Middle East & Africa CBRNe Defense Industry Revenue Share (%), by Export Market Analysis (Value & Volume) 2025 & 2033
- Figure 46: Middle East & Africa CBRNe Defense Industry Revenue (undefined), by Price Trend Analysis 2025 & 2033
- Figure 47: Middle East & Africa CBRNe Defense Industry Revenue Share (%), by Price Trend Analysis 2025 & 2033
- Figure 48: Middle East & Africa CBRNe Defense Industry Revenue (undefined), by Country 2025 & 2033
- Figure 49: Middle East & Africa CBRNe Defense Industry Revenue Share (%), by Country 2025 & 2033
- Figure 50: Asia Pacific CBRNe Defense Industry Revenue (undefined), by Production Analysis 2025 & 2033
- Figure 51: Asia Pacific CBRNe Defense Industry Revenue Share (%), by Production Analysis 2025 & 2033
- Figure 52: Asia Pacific CBRNe Defense Industry Revenue (undefined), by Consumption Analysis 2025 & 2033
- Figure 53: Asia Pacific CBRNe Defense Industry Revenue Share (%), by Consumption Analysis 2025 & 2033
- Figure 54: Asia Pacific CBRNe Defense Industry Revenue (undefined), by Import Market Analysis (Value & Volume) 2025 & 2033
- Figure 55: Asia Pacific CBRNe Defense Industry Revenue Share (%), by Import Market Analysis (Value & Volume) 2025 & 2033
- Figure 56: Asia Pacific CBRNe Defense Industry Revenue (undefined), by Export Market Analysis (Value & Volume) 2025 & 2033
- Figure 57: Asia Pacific CBRNe Defense Industry Revenue Share (%), by Export Market Analysis (Value & Volume) 2025 & 2033
- Figure 58: Asia Pacific CBRNe Defense Industry Revenue (undefined), by Price Trend Analysis 2025 & 2033
- Figure 59: Asia Pacific CBRNe Defense Industry Revenue Share (%), by Price Trend Analysis 2025 & 2033
- Figure 60: Asia Pacific CBRNe Defense Industry Revenue (undefined), by Country 2025 & 2033
- Figure 61: Asia Pacific CBRNe Defense Industry Revenue Share (%), by Country 2025 & 2033
List of Tables
- Table 1: Global CBRNe Defense Industry Revenue undefined Forecast, by Production Analysis 2020 & 2033
- Table 2: Global CBRNe Defense Industry Revenue undefined Forecast, by Consumption Analysis 2020 & 2033
- Table 3: Global CBRNe Defense Industry Revenue undefined Forecast, by Import Market Analysis (Value & Volume) 2020 & 2033
- Table 4: Global CBRNe Defense Industry Revenue undefined Forecast, by Export Market Analysis (Value & Volume) 2020 & 2033
- Table 5: Global CBRNe Defense Industry Revenue undefined Forecast, by Price Trend Analysis 2020 & 2033
- Table 6: Global CBRNe Defense Industry Revenue undefined Forecast, by Region 2020 & 2033
- Table 7: Global CBRNe Defense Industry Revenue undefined Forecast, by Production Analysis 2020 & 2033
- Table 8: Global CBRNe Defense Industry Revenue undefined Forecast, by Consumption Analysis 2020 & 2033
- Table 9: Global CBRNe Defense Industry Revenue undefined Forecast, by Import Market Analysis (Value & Volume) 2020 & 2033
- Table 10: Global CBRNe Defense Industry Revenue undefined Forecast, by Export Market Analysis (Value & Volume) 2020 & 2033
- Table 11: Global CBRNe Defense Industry Revenue undefined Forecast, by Price Trend Analysis 2020 & 2033
- Table 12: Global CBRNe Defense Industry Revenue undefined Forecast, by Country 2020 & 2033
- Table 13: United States CBRNe Defense Industry Revenue (undefined) Forecast, by Application 2020 & 2033
- Table 14: Canada CBRNe Defense Industry Revenue (undefined) Forecast, by Application 2020 & 2033
- Table 15: Mexico CBRNe Defense Industry Revenue (undefined) Forecast, by Application 2020 & 2033
- Table 16: Global CBRNe Defense Industry Revenue undefined Forecast, by Production Analysis 2020 & 2033
- Table 17: Global CBRNe Defense Industry Revenue undefined Forecast, by Consumption Analysis 2020 & 2033
- Table 18: Global CBRNe Defense Industry Revenue undefined Forecast, by Import Market Analysis (Value & Volume) 2020 & 2033
- Table 19: Global CBRNe Defense Industry Revenue undefined Forecast, by Export Market Analysis (Value & Volume) 2020 & 2033
- Table 20: Global CBRNe Defense Industry Revenue undefined Forecast, by Price Trend Analysis 2020 & 2033
- Table 21: Global CBRNe Defense Industry Revenue undefined Forecast, by Country 2020 & 2033
- Table 22: Brazil CBRNe Defense Industry Revenue (undefined) Forecast, by Application 2020 & 2033
- Table 23: Argentina CBRNe Defense Industry Revenue (undefined) Forecast, by Application 2020 & 2033
- Table 24: Rest of South America CBRNe Defense Industry Revenue (undefined) Forecast, by Application 2020 & 2033
- Table 25: Global CBRNe Defense Industry Revenue undefined Forecast, by Production Analysis 2020 & 2033
- Table 26: Global CBRNe Defense Industry Revenue undefined Forecast, by Consumption Analysis 2020 & 2033
- Table 27: Global CBRNe Defense Industry Revenue undefined Forecast, by Import Market Analysis (Value & Volume) 2020 & 2033
- Table 28: Global CBRNe Defense Industry Revenue undefined Forecast, by Export Market Analysis (Value & Volume) 2020 & 2033
- Table 29: Global CBRNe Defense Industry Revenue undefined Forecast, by Price Trend Analysis 2020 & 2033
- Table 30: Global CBRNe Defense Industry Revenue undefined Forecast, by Country 2020 & 2033
- Table 31: United Kingdom CBRNe Defense Industry Revenue (undefined) Forecast, by Application 2020 & 2033
- Table 32: Germany CBRNe Defense Industry Revenue (undefined) Forecast, by Application 2020 & 2033
- Table 33: France CBRNe Defense Industry Revenue (undefined) Forecast, by Application 2020 & 2033
- Table 34: Italy CBRNe Defense Industry Revenue (undefined) Forecast, by Application 2020 & 2033
- Table 35: Spain CBRNe Defense Industry Revenue (undefined) Forecast, by Application 2020 & 2033
- Table 36: Russia CBRNe Defense Industry Revenue (undefined) Forecast, by Application 2020 & 2033
- Table 37: Benelux CBRNe Defense Industry Revenue (undefined) Forecast, by Application 2020 & 2033
- Table 38: Nordics CBRNe Defense Industry Revenue (undefined) Forecast, by Application 2020 & 2033
- Table 39: Rest of Europe CBRNe Defense Industry Revenue (undefined) Forecast, by Application 2020 & 2033
- Table 40: Global CBRNe Defense Industry Revenue undefined Forecast, by Production Analysis 2020 & 2033
- Table 41: Global CBRNe Defense Industry Revenue undefined Forecast, by Consumption Analysis 2020 & 2033
- Table 42: Global CBRNe Defense Industry Revenue undefined Forecast, by Import Market Analysis (Value & Volume) 2020 & 2033
- Table 43: Global CBRNe Defense Industry Revenue undefined Forecast, by Export Market Analysis (Value & Volume) 2020 & 2033
- Table 44: Global CBRNe Defense Industry Revenue undefined Forecast, by Price Trend Analysis 2020 & 2033
- Table 45: Global CBRNe Defense Industry Revenue undefined Forecast, by Country 2020 & 2033
- Table 46: Turkey CBRNe Defense Industry Revenue (undefined) Forecast, by Application 2020 & 2033
- Table 47: Israel CBRNe Defense Industry Revenue (undefined) Forecast, by Application 2020 & 2033
- Table 48: GCC CBRNe Defense Industry Revenue (undefined) Forecast, by Application 2020 & 2033
- Table 49: North Africa CBRNe Defense Industry Revenue (undefined) Forecast, by Application 2020 & 2033
- Table 50: South Africa CBRNe Defense Industry Revenue (undefined) Forecast, by Application 2020 & 2033
- Table 51: Rest of Middle East & Africa CBRNe Defense Industry Revenue (undefined) Forecast, by Application 2020 & 2033
- Table 52: Global CBRNe Defense Industry Revenue undefined Forecast, by Production Analysis 2020 & 2033
- Table 53: Global CBRNe Defense Industry Revenue undefined Forecast, by Consumption Analysis 2020 & 2033
- Table 54: Global CBRNe Defense Industry Revenue undefined Forecast, by Import Market Analysis (Value & Volume) 2020 & 2033
- Table 55: Global CBRNe Defense Industry Revenue undefined Forecast, by Export Market Analysis (Value & Volume) 2020 & 2033
- Table 56: Global CBRNe Defense Industry Revenue undefined Forecast, by Price Trend Analysis 2020 & 2033
- Table 57: Global CBRNe Defense Industry Revenue undefined Forecast, by Country 2020 & 2033
- Table 58: China CBRNe Defense Industry Revenue (undefined) Forecast, by Application 2020 & 2033
- Table 59: India CBRNe Defense Industry Revenue (undefined) Forecast, by Application 2020 & 2033
- Table 60: Japan CBRNe Defense Industry Revenue (undefined) Forecast, by Application 2020 & 2033
- Table 61: South Korea CBRNe Defense Industry Revenue (undefined) Forecast, by Application 2020 & 2033
- Table 62: ASEAN CBRNe Defense Industry Revenue (undefined) Forecast, by Application 2020 & 2033
- Table 63: Oceania CBRNe Defense Industry Revenue (undefined) Forecast, by Application 2020 & 2033
- Table 64: Rest of Asia Pacific CBRNe Defense Industry Revenue (undefined) Forecast, by Application 2020 & 2033
Frequently Asked Questions
1. What is the projected Compound Annual Growth Rate (CAGR) of the CBRNe Defense Industry?
The projected CAGR is approximately 5.92%.
2. Which companies are prominent players in the CBRNe Defense Industry?
Key companies in the market include Leidos Inc, Chemring Group PLC, Argon Electronics (UK) Ltd, KNDS - KMW+NEXTER Defense Systems N V, QinetiQ Group, Smiths Group plc, National Technology and Engineering Solutions of Sandia LLC, Battelle, Avon Polymer Products Limited, OSI Systems Inc, Saab AB, Karcher Futuretech GmbH, Teledyne FLIR LLC.
3. What are the main segments of the CBRNe Defense Industry?
The market segments include Production Analysis, Consumption Analysis, Import Market Analysis (Value & Volume), Export Market Analysis (Value & Volume), Price Trend Analysis.
4. Can you provide details about the market size?
The market size is estimated to be USD XXX N/A as of 2022.
5. What are some drivers contributing to market growth?
N/A
6. What are the notable trends driving market growth?
The Military Segment Accounted for Largest Market Share.
7. Are there any restraints impacting market growth?
N/A
8. Can you provide examples of recent developments in the market?
April 2022: Kromek was awarded a contract worth GBP 1.7 million (USD 2.23 million) from an existing UK government-related customer to deliver CBRN (chemical, biological, radiological, and nuclear) detection services and products. The delivery of CBRN products is scheduled to be delivered through 2026.
9. What pricing options are available for accessing the report?
Pricing options include single-user, multi-user, and enterprise licenses priced at USD 4750, USD 5250, and USD 8750 respectively.
10. Is the market size provided in terms of value or volume?
The market size is provided in terms of value, measured in N/A.
11. Are there any specific market keywords associated with the report?
Yes, the market keyword associated with the report is "CBRNe Defense Industry," which aids in identifying and referencing the specific market segment covered.
12. How do I determine which pricing option suits my needs best?
The pricing options vary based on user requirements and access needs. Individual users may opt for single-user licenses, while businesses requiring broader access may choose multi-user or enterprise licenses for cost-effective access to the report.
13. Are there any additional resources or data provided in the CBRNe Defense Industry report?
While the report offers comprehensive insights, it's advisable to review the specific contents or supplementary materials provided to ascertain if additional resources or data are available.
14. How can I stay updated on further developments or reports in the CBRNe Defense Industry?
To stay informed about further developments, trends, and reports in the CBRNe Defense Industry, consider subscribing to industry newsletters, following relevant companies and organizations, or regularly checking reputable industry news sources and publications.
Methodology
Step 1 - Identification of Relevant Samples Size from Population Database


Step 2 - Approaches for Defining Global Market Size (Value, Volume* & Price*)

Note*: In applicable scenarios
Step 3 - Data Sources
Primary Research
- Web Analytics
- Survey Reports
- Research Institute
- Latest Research Reports
- Opinion Leaders
Secondary Research
- Annual Reports
- White Paper
- Latest Press Release
- Industry Association
- Paid Database
- Investor Presentations

Step 4 - Data Triangulation
Involves using different sources of information in order to increase the validity of a study
These sources are likely to be stakeholders in a program - participants, other researchers, program staff, other community members, and so on.
Then we put all data in single framework & apply various statistical tools to find out the dynamic on the market.
During the analysis stage, feedback from the stakeholder groups would be compared to determine areas of agreement as well as areas of divergence