

Key Insights
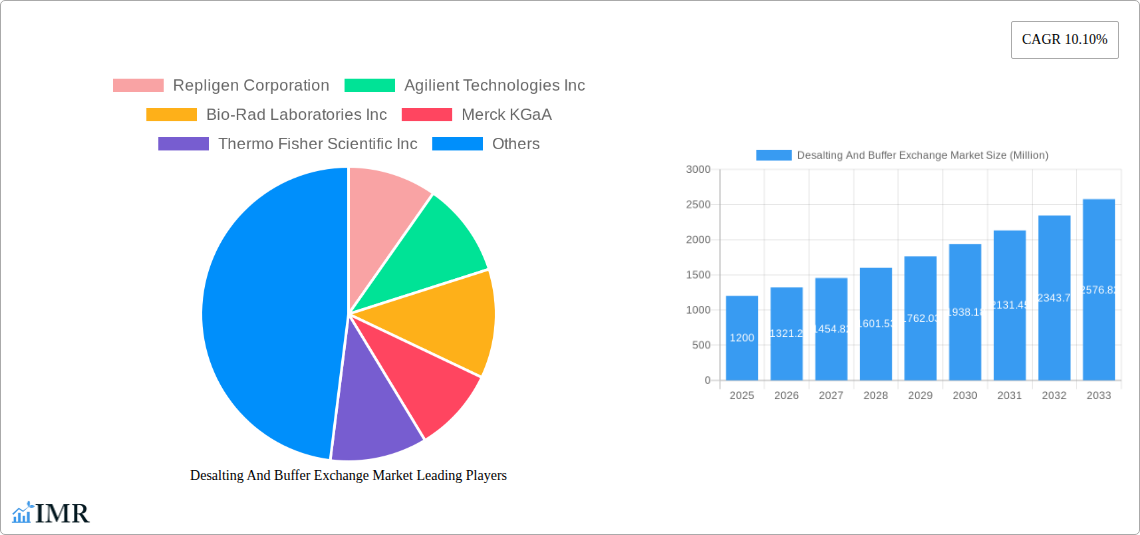
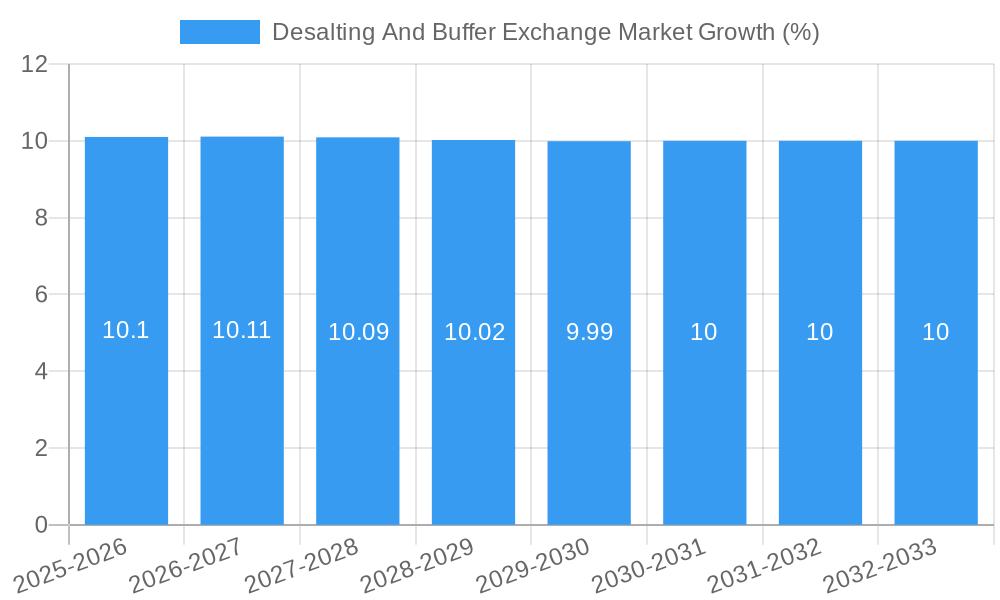
The global Desalting and Buffer Exchange Market is poised for significant expansion, projected to reach a substantial market size of approximately $1.2 billion by 2025, driven by a robust Compound Annual Growth Rate (CAGR) of 10.10%. This growth is primarily fueled by the escalating demand for advanced biopharmaceutical development and diagnostics. Key drivers include the increasing complexity of biological drugs requiring precise buffer conditions for stability and efficacy, alongside the burgeoning need for rapid and accurate diagnostic tests. The pharmaceutical and biotechnology sectors are leading the charge, leveraging these technologies for protein purification, antibody production, and drug formulation. Emerging economies, particularly in the Asia Pacific region, are presenting considerable growth opportunities due to expanding healthcare infrastructure and increased research and development investments. The market's dynamism is further evidenced by ongoing technological advancements in filtration and chromatography techniques, offering enhanced efficiency and scalability.
The market's strong trajectory, however, faces certain restraints. High initial investment costs for sophisticated desalting and buffer exchange equipment can pose a barrier, especially for smaller research institutions and emerging biotechnology firms. Furthermore, the stringent regulatory landscape governing pharmaceutical and diagnostic products necessitates rigorous validation processes, which can prolong product development cycles and increase operational expenses. Despite these challenges, the continuous innovation in product offerings, such as advanced cassette and cartridge designs, alongside integrated kits, is addressing these concerns by offering more user-friendly and cost-effective solutions. The competitive landscape is characterized by the presence of major industry players like Thermo Fisher Scientific, Merck KGaA, and Sartorius AG, who are actively engaged in research, development, and strategic partnerships to maintain market leadership and cater to the evolving needs of the life sciences industry. The forecast period (2025-2033) indicates sustained high growth, underscoring the critical and expanding role of desalting and buffer exchange in modern biological research and healthcare.
This in-depth report provides a detailed analysis of the global Desalting and Buffer Exchange Market, focusing on its current dynamics, growth trajectories, and future potential. Covering the period from 2019 to 2033, with a base year of 2025, this study offers critical insights into market size, segmentation, key players, technological advancements, and emerging opportunities. Leveraging high-traffic keywords such as "protein purification," "bioprocessing," "drug discovery," "diagnostics," and "molecular biology," this report is optimized for maximum search engine visibility and engagement with industry professionals, researchers, and investors. We delve into the parent market's influence and analyze child markets for a comprehensive understanding of market interdependencies and growth drivers within the desalting solutions and buffer exchange chromatography landscape.
Desalting And Buffer Exchange Market Market Dynamics & Structure
The Desalting and Buffer Exchange Market is characterized by a moderate concentration, driven by continuous technological innovation in purification techniques and increasing regulatory stringency for biopharmaceutical products. Major players like Repligen Corporation, Thermo Fisher Scientific Inc., and Merck KGaA are at the forefront of developing advanced solutions, influencing market dynamics through strategic collaborations and product development. The market is influenced by the growing demand for efficient protein purification and sample preparation in pharmaceutical and biotechnology industries. Competitive product substitutes exist, primarily in manual methods, but are increasingly being outpaced by the speed and efficiency of advanced technologies. End-user demographics are shifting towards a greater demand for high-throughput, automated systems, especially within research institutions and contract research organizations (CROs). Merger and acquisition (M&A) trends are also significant, with companies seeking to expand their portfolios and market reach. For example, the acquisition of Novasep's chromatography division by Sartorius highlights a strategic move to consolidate expertise and market share in downstream processing. The global market value for desalting and buffer exchange solutions is projected to reach approximately $1,800 million by 2025, reflecting a robust Compound Annual Growth Rate (CAGR) from the historical period.
- Market Concentration: Moderate, with key players dominating specific product segments.
- Technological Innovation Drivers: Advancements in chromatography resins, membrane filtration, and automated systems for rapid buffer exchange.
- Regulatory Frameworks: Stringent quality control requirements in biopharmaceutical manufacturing drive demand for validated desalting kits.
- Competitive Product Substitutes: Manual dialysis and traditional precipitation methods, though less efficient.
- End-User Demographics: Growing reliance on outsourcing by pharmaceutical and biotech firms, increasing demand from academic research, and a surge in diagnostic assay development.
- M&A Trends: Strategic acquisitions to enhance product portfolios and technological capabilities, indicating a consolidation phase in the market. The overall deal volume in the bioprocessing equipment sector has seen a notable increase.
Desalting And Buffer Exchange Market Growth Trends & Insights
The Desalting and Buffer Exchange Market is poised for substantial growth, projected to expand from an estimated $1,750 million in 2025 to over $2,500 million by 2033, exhibiting a CAGR of approximately 5.5%. This robust expansion is fueled by the escalating demand for purified biomolecules, including recombinant proteins, antibodies, and nucleic acids, essential for therapeutic development and diagnostic applications. The increasing prevalence of chronic diseases and the subsequent rise in biologics research and development activities are major contributors to this trend. Furthermore, the continuous advancements in downstream processing technologies, such as innovative filtration membranes and high-performance chromatography resins, are enhancing the efficiency and scalability of desalting and buffer exchange processes. The adoption rate of automated and semi-automated systems is steadily increasing, driven by the need for reduced manual labor, improved reproducibility, and higher throughput in biopharmaceutical manufacturing.
Consumer behavior shifts are also playing a crucial role, with a growing preference for integrated solutions and single-use technologies that offer convenience and minimize contamination risks. The pharmaceutical and biotechnology industries, being the primary consumers, are investing heavily in research and development, thereby creating a sustained demand for reliable desalting and buffer exchange products. The diagnostic applications segment is also witnessing significant growth, propelled by the development of more sensitive and specific diagnostic assays that require precise sample preparation. The market penetration of advanced desalting and buffer exchange technologies is expected to deepen as their cost-effectiveness and superior performance become more widely recognized.
The market is also influenced by global health initiatives and the increasing focus on personalized medicine, which necessitates smaller batch sizes but with higher purity requirements. This creates a nuanced demand landscape where both high-throughput solutions and specialized, low-volume applications find their niche. The integration of AI and machine learning in process optimization for biologics purification is another emerging trend that will likely accelerate market growth by improving efficiency and reducing costs. The overall market size evolution reflects a healthy trajectory, supported by a confluence of scientific advancements, growing healthcare needs, and strategic investments within the life sciences sector. The market penetration of advanced desalting and buffer exchange technologies is expected to reach approximately 60% by 2033.
Dominant Regions, Countries, or Segments in Desalting And Buffer Exchange Market
The Pharmaceutical and Biotechnology Industries segment is the undisputed dominant force within the Desalting and Buffer Exchange Market, accounting for an estimated 70% of the total market share. This dominance stems from the critical role these solutions play in every stage of biopharmaceutical development, from research and discovery to large-scale manufacturing of therapeutic proteins, vaccines, and gene therapies. The rigorous purification requirements inherent in these processes necessitate efficient and reliable desalting and buffer exchange techniques to remove salts, change buffer compositions, and prepare samples for downstream analysis or formulation. The increasing pipeline of biologic drugs and the growth of the global biopharmaceutical market directly translate into a sustained and escalating demand for these purification tools.
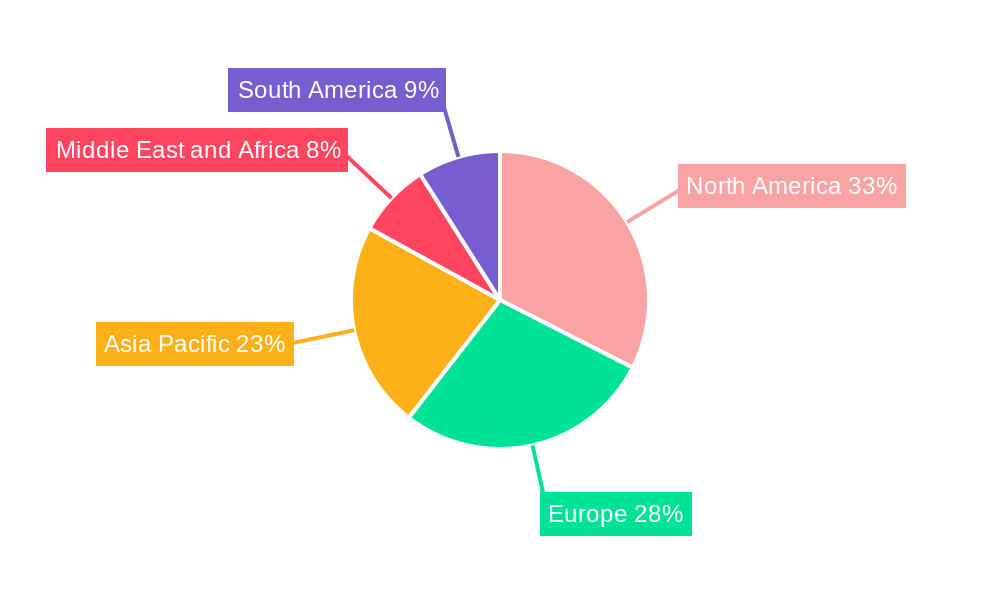
Geographically, North America currently leads the Desalting and Buffer Exchange Market, driven by its robust pharmaceutical and biotechnology ecosystem, extensive research infrastructure, and significant investment in drug discovery and development. The presence of numerous leading biopharmaceutical companies, academic institutions, and government-funded research initiatives fosters a high demand for advanced purification technologies. The region benefits from favorable regulatory frameworks that support innovation and product approvals, further accelerating market adoption. The United States, in particular, represents a substantial portion of the North American market share due to its large biopharmaceutical industry and its role as a global hub for scientific research.
Within the product segmentation, Cassettes and Cartridges represent a significant and growing segment, estimated to capture around 35% of the market share. This growth is attributed to their ease of use, scalability, and suitability for both manual and automated workflows in bioprocessing. They offer a convenient and efficient means for desalting and buffer exchange in various applications, from small-scale research to pilot-scale production.
In terms of techniques, Filtration is the most dominant method, comprising approximately 50% of the market. Techniques like tangential flow filtration (TFF) and ultrafiltration/diafiltration (UF/DF) are widely employed for their efficiency in handling large volumes and their scalability in downstream processing. Chromatography techniques, while crucial, represent a slightly smaller but equally vital segment, particularly for high-resolution purification needs.
- Dominant Segment: Pharmaceutical and Biotechnology Industries (Estimated 70% Market Share).
- Key Drivers: Increasing biologics pipeline, demand for high-purity therapeutics, growth in vaccine development.
- Growth Potential: Sustained, driven by ongoing innovation in drug discovery and manufacturing.
- Dominant Region: North America.
- Key Drivers: Strong biopharmaceutical industry, significant R&D investment, supportive regulatory environment.
- Market Share: Estimated 40% of the global market.
- Leading Product: Cassettes and Cartridges (Estimated 35% Market Share).
- Key Drivers: Ease of use, scalability, compatibility with automated systems.
- Growth Potential: High, due to increasing adoption in various bioprocessing workflows.
- Dominant Technique: Filtration (Estimated 50% Market Share).
- Key Drivers: High throughput, scalability for large-volume processing, versatility.
- Growth Potential: Continuous advancements in membrane technology will further drive adoption.
Desalting And Buffer Exchange Market Product Landscape
The product landscape for desalting and buffer exchange solutions is characterized by innovation and specialization. Key product categories include: Cassettes and Cartridges, offering convenient, single-use solutions for rapid buffer exchange and desalting of protein and nucleic acid samples; Kits, providing pre-packaged reagents and consumables for specific applications, ensuring ease of use and reproducibility in molecular biology research and diagnostics; Filter plates, designed for high-throughput screening and sample preparation in drug discovery and proteomics; and Other Products, encompassing specialized columns, membranes, and equipment for various purification needs. Performance metrics are continuously improving, with advancements in membrane pore sizes for optimal size exclusion, faster flow rates for increased throughput, and enhanced binding capacities for higher recovery of target molecules. Unique selling propositions often revolve around speed, recovery rates, purity achieved, and compatibility with automated liquid handling systems, directly impacting the efficiency of biomolecule purification.
Key Drivers, Barriers & Challenges in Desalting And Buffer Exchange Market
Key Drivers:
- Growing Biopharmaceutical Market: The surging demand for biologics, vaccines, and gene therapies directly fuels the need for efficient protein purification and sample preparation.
- Technological Advancements: Continuous innovation in filtration membranes, chromatography resins, and automated systems enhances the performance and efficiency of desalting and buffer exchange.
- Increasing R&D Investments: Significant investments in drug discovery and development by pharmaceutical and biotechnology companies drive the demand for advanced purification tools.
- Rise of Personalized Medicine: The shift towards personalized therapies necessitates high-purity, small-batch production, increasing reliance on precise purification methods.
- Outsourcing Trends: The growing reliance on contract research and manufacturing organizations (CROs/CMOs) for bioprocessing activities boosts the demand for standardized and scalable desalting solutions.
Barriers & Challenges:
- High Cost of Advanced Technologies: The initial investment in sophisticated desalting and buffer exchange systems can be a significant barrier for smaller research institutions and emerging biotech companies.
- Regulatory Hurdles: Stringent regulatory requirements for biopharmaceutical manufacturing necessitate extensive validation and documentation for purification processes, adding to development timelines and costs.
- Supply Chain Disruptions: Global supply chain vulnerabilities can impact the availability and cost of raw materials and consumables, affecting production and pricing.
- Skilled Workforce Shortage: A lack of skilled personnel with expertise in operating and maintaining advanced purification equipment can hinder adoption and efficiency.
- Competition from Established Methods: While less efficient, traditional methods like dialysis can still be cost-effective for certain low-volume applications, posing a competitive challenge.
Emerging Opportunities in Desalting And Buffer Exchange Market
Emerging opportunities in the Desalting and Buffer Exchange Market are manifold, driven by advancements in life sciences and evolving research needs. The burgeoning field of exosome purification and characterization presents a significant opportunity, as these vesicles are gaining traction as therapeutic delivery vehicles and diagnostic biomarkers. The demand for specialized desalting and buffer exchange solutions tailored for these delicate nanoparticles is expected to rise substantially. Furthermore, the growing focus on gene and cell therapy manufacturing creates a unique demand for highly efficient and sterile purification workflows. The development of novel, single-use, and integrated systems that minimize contamination risks and streamline downstream processing for these complex therapies is a key area for innovation. Additionally, the expansion of diagnostic applications beyond traditional disease markers, into areas like liquid biopsies and point-of-care testing, will necessitate faster, more accurate, and cost-effective sample preparation solutions, including advanced desalting and buffer exchange technologies. The increasing adoption of automation and digitalization in laboratories also opens avenues for smart, connected desalting and buffer exchange devices that can integrate seamlessly into automated workflows.
Growth Accelerators in the Desalting And Buffer Exchange Market Industry
Several catalysts are accelerating the growth of the Desalting and Buffer Exchange Market. Technological breakthroughs in membrane science, leading to membranes with improved selectivity, higher flux rates, and enhanced durability, are pivotal. The development of novel chromatography media offering superior resolution and capacity for challenging biomolecules is also a significant accelerator. Strategic partnerships and collaborations between technology providers, biopharmaceutical companies, and academic institutions are fostering innovation and accelerating product development and market adoption. For instance, collaborations focused on addressing specific purification challenges in emerging therapeutic modalities like AAV vectors and mRNA vaccines are crucial growth drivers. Furthermore, market expansion strategies, including the penetration of emerging economies with growing pharmaceutical and biotechnology sectors, represent significant growth opportunities. Investments in R&D for continuous manufacturing processes in biopharmaceuticals will also necessitate and drive the development of advanced, high-throughput desalting and buffer exchange technologies.
Key Players Shaping the Desalting And Buffer Exchange Market Market
- Repligen Corporation
- Agilent Technologies Inc.
- Bio-Rad Laboratories Inc.
- Merck KGaA
- Thermo Fisher Scientific Inc.
- Danaher Corporation (Cytivia)
- Bio-Works Technologies
- Sartorius AG
- GE HealthCare Technologies Inc.
- Norgen Bioteck Corp
Notable Milestones in Desalting And Buffer Exchange Market Sector
- January 2023: Sartorius extended a strategic collaboration partnership agreement with RoosterBio Inc. to address purification challenges and establish scalable downstream manufacturing processes for exosome-based therapies. The collaboration would strengthen the bioprocessing portfolio of the company.
- June 2022: Global analytical science and device company Trajan Group Holdings Limited signed a binding share purchase agreement and a real estate purchase agreement to acquire 100% of Chromatography Research Supplies, Inc. (CRS), one of the leading global manufacturers of high-quality analytical consumables based in Kentucky, USA.
- February 2022: Sartorius, through its subgroup Sartorius Stedim Biotech, acquired the Novasep chromatography division following approval by the United States Federal Trade Commission.
In-Depth Desalting And Buffer Exchange Market Market Outlook
The future outlook for the Desalting and Buffer Exchange Market is exceptionally bright, driven by a confluence of persistent demand from the expanding biopharmaceutical and diagnostic sectors, coupled with relentless technological innovation. Growth accelerators such as the development of advanced single-use technologies, the increasing complexity of therapeutic molecules requiring precise purification, and the growing emphasis on process intensification and continuous manufacturing will continue to propel the market forward. Strategic initiatives including partnerships for exosome and gene therapy purification, coupled with market expansion into high-growth regions, will unlock further potential. The market is expected to witness continued investment in R&D, leading to the introduction of more efficient, automated, and cost-effective desalting and buffer exchange solutions, solidifying its critical role in advancing life sciences and healthcare.
Desalting And Buffer Exchange Market Segmentation
-
1. Product
- 1.1. Cassettes and Catridges
- 1.2. Kits
- 1.3. Filter plates
- 1.4. Other Products
-
2. Technique
- 2.1. Filtration
- 2.2. Chromatography
- 2.3. Precipitation
-
3. Application
- 3.1. Pharmaceutical and Biotechnology Industries
- 3.2. Diagnostic Applications
- 3.3. Other Applications
Desalting And Buffer Exchange Market Segmentation By Geography
-
1. North America
- 1.1. United States
- 1.2. Canada
- 1.3. Mexico
-
2. Europe
- 2.1. Germany
- 2.2. United Kingdom
- 2.3. France
- 2.4. Italy
- 2.5. Spain
- 2.6. Rest of Europe
-
3. Asia Pacific
- 3.1. China
- 3.2. Japan
- 3.3. India
- 3.4. Australia
- 3.5. South Korea
- 3.6. Rest of Asia Pacific
-
4. Middle East and Africa
- 4.1. GCC
- 4.2. South Africa
- 4.3. Rest of Middle East and Africa
-
5. South America
- 5.1. Brazil
- 5.2. Argentina
- 5.3. Rest of South America
Desalting And Buffer Exchange Market REPORT HIGHLIGHTS
| Aspects | Details |
|---|---|
| Study Period | 2019-2033 |
| Base Year | 2024 |
| Estimated Year | 2025 |
| Forecast Period | 2025-2033 |
| Historical Period | 2019-2024 |
| Growth Rate | CAGR of 10.10% from 2019-2033 |
| Segmentation |
|
Table of Contents
- 1. Introduction
- 1.1. Research Scope
- 1.2. Market Segmentation
- 1.3. Research Methodology
- 1.4. Definitions and Assumptions
- 2. Executive Summary
- 2.1. Introduction
- 3. Market Dynamics
- 3.1. Introduction
- 3.2. Market Drivers
- 3.2.1. Increasing Research and Development by Biopharmaceutical Industries; Rising Focus on the Proteomic and Genomic Research
- 3.3. Market Restrains
- 3.3.1. Lack of Skilled Professionals
- 3.4. Market Trends
- 3.4.1. The Pharmaceutical and Biotechnology Industries Segment is Expected to Witness Significant Growth Over the Forecast Period
- 4. Market Factor Analysis
- 4.1. Porters Five Forces
- 4.2. Supply/Value Chain
- 4.3. PESTEL analysis
- 4.4. Market Entropy
- 4.5. Patent/Trademark Analysis
- 5. Global Desalting And Buffer Exchange Market Analysis, Insights and Forecast, 2019-2031
- 5.1. Market Analysis, Insights and Forecast - by Product
- 5.1.1. Cassettes and Catridges
- 5.1.2. Kits
- 5.1.3. Filter plates
- 5.1.4. Other Products
- 5.2. Market Analysis, Insights and Forecast - by Technique
- 5.2.1. Filtration
- 5.2.2. Chromatography
- 5.2.3. Precipitation
- 5.3. Market Analysis, Insights and Forecast - by Application
- 5.3.1. Pharmaceutical and Biotechnology Industries
- 5.3.2. Diagnostic Applications
- 5.3.3. Other Applications
- 5.4. Market Analysis, Insights and Forecast - by Region
- 5.4.1. North America
- 5.4.2. Europe
- 5.4.3. Asia Pacific
- 5.4.4. Middle East and Africa
- 5.4.5. South America
- 5.1. Market Analysis, Insights and Forecast - by Product
- 6. North America Desalting And Buffer Exchange Market Analysis, Insights and Forecast, 2019-2031
- 6.1. Market Analysis, Insights and Forecast - by Product
- 6.1.1. Cassettes and Catridges
- 6.1.2. Kits
- 6.1.3. Filter plates
- 6.1.4. Other Products
- 6.2. Market Analysis, Insights and Forecast - by Technique
- 6.2.1. Filtration
- 6.2.2. Chromatography
- 6.2.3. Precipitation
- 6.3. Market Analysis, Insights and Forecast - by Application
- 6.3.1. Pharmaceutical and Biotechnology Industries
- 6.3.2. Diagnostic Applications
- 6.3.3. Other Applications
- 6.1. Market Analysis, Insights and Forecast - by Product
- 7. Europe Desalting And Buffer Exchange Market Analysis, Insights and Forecast, 2019-2031
- 7.1. Market Analysis, Insights and Forecast - by Product
- 7.1.1. Cassettes and Catridges
- 7.1.2. Kits
- 7.1.3. Filter plates
- 7.1.4. Other Products
- 7.2. Market Analysis, Insights and Forecast - by Technique
- 7.2.1. Filtration
- 7.2.2. Chromatography
- 7.2.3. Precipitation
- 7.3. Market Analysis, Insights and Forecast - by Application
- 7.3.1. Pharmaceutical and Biotechnology Industries
- 7.3.2. Diagnostic Applications
- 7.3.3. Other Applications
- 7.1. Market Analysis, Insights and Forecast - by Product
- 8. Asia Pacific Desalting And Buffer Exchange Market Analysis, Insights and Forecast, 2019-2031
- 8.1. Market Analysis, Insights and Forecast - by Product
- 8.1.1. Cassettes and Catridges
- 8.1.2. Kits
- 8.1.3. Filter plates
- 8.1.4. Other Products
- 8.2. Market Analysis, Insights and Forecast - by Technique
- 8.2.1. Filtration
- 8.2.2. Chromatography
- 8.2.3. Precipitation
- 8.3. Market Analysis, Insights and Forecast - by Application
- 8.3.1. Pharmaceutical and Biotechnology Industries
- 8.3.2. Diagnostic Applications
- 8.3.3. Other Applications
- 8.1. Market Analysis, Insights and Forecast - by Product
- 9. Middle East and Africa Desalting And Buffer Exchange Market Analysis, Insights and Forecast, 2019-2031
- 9.1. Market Analysis, Insights and Forecast - by Product
- 9.1.1. Cassettes and Catridges
- 9.1.2. Kits
- 9.1.3. Filter plates
- 9.1.4. Other Products
- 9.2. Market Analysis, Insights and Forecast - by Technique
- 9.2.1. Filtration
- 9.2.2. Chromatography
- 9.2.3. Precipitation
- 9.3. Market Analysis, Insights and Forecast - by Application
- 9.3.1. Pharmaceutical and Biotechnology Industries
- 9.3.2. Diagnostic Applications
- 9.3.3. Other Applications
- 9.1. Market Analysis, Insights and Forecast - by Product
- 10. South America Desalting And Buffer Exchange Market Analysis, Insights and Forecast, 2019-2031
- 10.1. Market Analysis, Insights and Forecast - by Product
- 10.1.1. Cassettes and Catridges
- 10.1.2. Kits
- 10.1.3. Filter plates
- 10.1.4. Other Products
- 10.2. Market Analysis, Insights and Forecast - by Technique
- 10.2.1. Filtration
- 10.2.2. Chromatography
- 10.2.3. Precipitation
- 10.3. Market Analysis, Insights and Forecast - by Application
- 10.3.1. Pharmaceutical and Biotechnology Industries
- 10.3.2. Diagnostic Applications
- 10.3.3. Other Applications
- 10.1. Market Analysis, Insights and Forecast - by Product
- 11. North America Desalting And Buffer Exchange Market Analysis, Insights and Forecast, 2019-2031
- 11.1. Market Analysis, Insights and Forecast - By Country/Sub-region
- 11.1.1 United States
- 11.1.2 Canada
- 11.1.3 Mexico
- 12. Europe Desalting And Buffer Exchange Market Analysis, Insights and Forecast, 2019-2031
- 12.1. Market Analysis, Insights and Forecast - By Country/Sub-region
- 12.1.1 Germany
- 12.1.2 United Kingdom
- 12.1.3 France
- 12.1.4 Italy
- 12.1.5 Spain
- 12.1.6 Rest of Europe
- 13. Asia Pacific Desalting And Buffer Exchange Market Analysis, Insights and Forecast, 2019-2031
- 13.1. Market Analysis, Insights and Forecast - By Country/Sub-region
- 13.1.1 China
- 13.1.2 Japan
- 13.1.3 India
- 13.1.4 Australia
- 13.1.5 South Korea
- 13.1.6 Rest of Asia Pacific
- 14. Middle East and Africa Desalting And Buffer Exchange Market Analysis, Insights and Forecast, 2019-2031
- 14.1. Market Analysis, Insights and Forecast - By Country/Sub-region
- 14.1.1 GCC
- 14.1.2 South Africa
- 14.1.3 Rest of Middle East and Africa
- 15. South America Desalting And Buffer Exchange Market Analysis, Insights and Forecast, 2019-2031
- 15.1. Market Analysis, Insights and Forecast - By Country/Sub-region
- 15.1.1 Brazil
- 15.1.2 Argentina
- 15.1.3 Rest of South America
- 16. Competitive Analysis
- 16.1. Global Market Share Analysis 2024
- 16.2. Company Profiles
- 16.2.1 Repligen Corporation
- 16.2.1.1. Overview
- 16.2.1.2. Products
- 16.2.1.3. SWOT Analysis
- 16.2.1.4. Recent Developments
- 16.2.1.5. Financials (Based on Availability)
- 16.2.2 Agilient Technologies Inc
- 16.2.2.1. Overview
- 16.2.2.2. Products
- 16.2.2.3. SWOT Analysis
- 16.2.2.4. Recent Developments
- 16.2.2.5. Financials (Based on Availability)
- 16.2.3 Bio-Rad Laboratories Inc
- 16.2.3.1. Overview
- 16.2.3.2. Products
- 16.2.3.3. SWOT Analysis
- 16.2.3.4. Recent Developments
- 16.2.3.5. Financials (Based on Availability)
- 16.2.4 Merck KGaA
- 16.2.4.1. Overview
- 16.2.4.2. Products
- 16.2.4.3. SWOT Analysis
- 16.2.4.4. Recent Developments
- 16.2.4.5. Financials (Based on Availability)
- 16.2.5 Thermo Fisher Scientific Inc
- 16.2.5.1. Overview
- 16.2.5.2. Products
- 16.2.5.3. SWOT Analysis
- 16.2.5.4. Recent Developments
- 16.2.5.5. Financials (Based on Availability)
- 16.2.6 Danaher Corporation (Cytvia)
- 16.2.6.1. Overview
- 16.2.6.2. Products
- 16.2.6.3. SWOT Analysis
- 16.2.6.4. Recent Developments
- 16.2.6.5. Financials (Based on Availability)
- 16.2.7 Bio-Works Technologies
- 16.2.7.1. Overview
- 16.2.7.2. Products
- 16.2.7.3. SWOT Analysis
- 16.2.7.4. Recent Developments
- 16.2.7.5. Financials (Based on Availability)
- 16.2.8 Sartorius AG
- 16.2.8.1. Overview
- 16.2.8.2. Products
- 16.2.8.3. SWOT Analysis
- 16.2.8.4. Recent Developments
- 16.2.8.5. Financials (Based on Availability)
- 16.2.9 GE HealthCare Technologies Inc
- 16.2.9.1. Overview
- 16.2.9.2. Products
- 16.2.9.3. SWOT Analysis
- 16.2.9.4. Recent Developments
- 16.2.9.5. Financials (Based on Availability)
- 16.2.10 Norgen Bioteck Corp
- 16.2.10.1. Overview
- 16.2.10.2. Products
- 16.2.10.3. SWOT Analysis
- 16.2.10.4. Recent Developments
- 16.2.10.5. Financials (Based on Availability)
- 16.2.1 Repligen Corporation
List of Figures
- Figure 1: Global Desalting And Buffer Exchange Market Revenue Breakdown (Million, %) by Region 2024 & 2032
- Figure 2: Global Desalting And Buffer Exchange Market Volume Breakdown (K Unit, %) by Region 2024 & 2032
- Figure 3: North America Desalting And Buffer Exchange Market Revenue (Million), by Country 2024 & 2032
- Figure 4: North America Desalting And Buffer Exchange Market Volume (K Unit), by Country 2024 & 2032
- Figure 5: North America Desalting And Buffer Exchange Market Revenue Share (%), by Country 2024 & 2032
- Figure 6: North America Desalting And Buffer Exchange Market Volume Share (%), by Country 2024 & 2032
- Figure 7: Europe Desalting And Buffer Exchange Market Revenue (Million), by Country 2024 & 2032
- Figure 8: Europe Desalting And Buffer Exchange Market Volume (K Unit), by Country 2024 & 2032
- Figure 9: Europe Desalting And Buffer Exchange Market Revenue Share (%), by Country 2024 & 2032
- Figure 10: Europe Desalting And Buffer Exchange Market Volume Share (%), by Country 2024 & 2032
- Figure 11: Asia Pacific Desalting And Buffer Exchange Market Revenue (Million), by Country 2024 & 2032
- Figure 12: Asia Pacific Desalting And Buffer Exchange Market Volume (K Unit), by Country 2024 & 2032
- Figure 13: Asia Pacific Desalting And Buffer Exchange Market Revenue Share (%), by Country 2024 & 2032
- Figure 14: Asia Pacific Desalting And Buffer Exchange Market Volume Share (%), by Country 2024 & 2032
- Figure 15: Middle East and Africa Desalting And Buffer Exchange Market Revenue (Million), by Country 2024 & 2032
- Figure 16: Middle East and Africa Desalting And Buffer Exchange Market Volume (K Unit), by Country 2024 & 2032
- Figure 17: Middle East and Africa Desalting And Buffer Exchange Market Revenue Share (%), by Country 2024 & 2032
- Figure 18: Middle East and Africa Desalting And Buffer Exchange Market Volume Share (%), by Country 2024 & 2032
- Figure 19: South America Desalting And Buffer Exchange Market Revenue (Million), by Country 2024 & 2032
- Figure 20: South America Desalting And Buffer Exchange Market Volume (K Unit), by Country 2024 & 2032
- Figure 21: South America Desalting And Buffer Exchange Market Revenue Share (%), by Country 2024 & 2032
- Figure 22: South America Desalting And Buffer Exchange Market Volume Share (%), by Country 2024 & 2032
- Figure 23: North America Desalting And Buffer Exchange Market Revenue (Million), by Product 2024 & 2032
- Figure 24: North America Desalting And Buffer Exchange Market Volume (K Unit), by Product 2024 & 2032
- Figure 25: North America Desalting And Buffer Exchange Market Revenue Share (%), by Product 2024 & 2032
- Figure 26: North America Desalting And Buffer Exchange Market Volume Share (%), by Product 2024 & 2032
- Figure 27: North America Desalting And Buffer Exchange Market Revenue (Million), by Technique 2024 & 2032
- Figure 28: North America Desalting And Buffer Exchange Market Volume (K Unit), by Technique 2024 & 2032
- Figure 29: North America Desalting And Buffer Exchange Market Revenue Share (%), by Technique 2024 & 2032
- Figure 30: North America Desalting And Buffer Exchange Market Volume Share (%), by Technique 2024 & 2032
- Figure 31: North America Desalting And Buffer Exchange Market Revenue (Million), by Application 2024 & 2032
- Figure 32: North America Desalting And Buffer Exchange Market Volume (K Unit), by Application 2024 & 2032
- Figure 33: North America Desalting And Buffer Exchange Market Revenue Share (%), by Application 2024 & 2032
- Figure 34: North America Desalting And Buffer Exchange Market Volume Share (%), by Application 2024 & 2032
- Figure 35: North America Desalting And Buffer Exchange Market Revenue (Million), by Country 2024 & 2032
- Figure 36: North America Desalting And Buffer Exchange Market Volume (K Unit), by Country 2024 & 2032
- Figure 37: North America Desalting And Buffer Exchange Market Revenue Share (%), by Country 2024 & 2032
- Figure 38: North America Desalting And Buffer Exchange Market Volume Share (%), by Country 2024 & 2032
- Figure 39: Europe Desalting And Buffer Exchange Market Revenue (Million), by Product 2024 & 2032
- Figure 40: Europe Desalting And Buffer Exchange Market Volume (K Unit), by Product 2024 & 2032
- Figure 41: Europe Desalting And Buffer Exchange Market Revenue Share (%), by Product 2024 & 2032
- Figure 42: Europe Desalting And Buffer Exchange Market Volume Share (%), by Product 2024 & 2032
- Figure 43: Europe Desalting And Buffer Exchange Market Revenue (Million), by Technique 2024 & 2032
- Figure 44: Europe Desalting And Buffer Exchange Market Volume (K Unit), by Technique 2024 & 2032
- Figure 45: Europe Desalting And Buffer Exchange Market Revenue Share (%), by Technique 2024 & 2032
- Figure 46: Europe Desalting And Buffer Exchange Market Volume Share (%), by Technique 2024 & 2032
- Figure 47: Europe Desalting And Buffer Exchange Market Revenue (Million), by Application 2024 & 2032
- Figure 48: Europe Desalting And Buffer Exchange Market Volume (K Unit), by Application 2024 & 2032
- Figure 49: Europe Desalting And Buffer Exchange Market Revenue Share (%), by Application 2024 & 2032
- Figure 50: Europe Desalting And Buffer Exchange Market Volume Share (%), by Application 2024 & 2032
- Figure 51: Europe Desalting And Buffer Exchange Market Revenue (Million), by Country 2024 & 2032
- Figure 52: Europe Desalting And Buffer Exchange Market Volume (K Unit), by Country 2024 & 2032
- Figure 53: Europe Desalting And Buffer Exchange Market Revenue Share (%), by Country 2024 & 2032
- Figure 54: Europe Desalting And Buffer Exchange Market Volume Share (%), by Country 2024 & 2032
- Figure 55: Asia Pacific Desalting And Buffer Exchange Market Revenue (Million), by Product 2024 & 2032
- Figure 56: Asia Pacific Desalting And Buffer Exchange Market Volume (K Unit), by Product 2024 & 2032
- Figure 57: Asia Pacific Desalting And Buffer Exchange Market Revenue Share (%), by Product 2024 & 2032
- Figure 58: Asia Pacific Desalting And Buffer Exchange Market Volume Share (%), by Product 2024 & 2032
- Figure 59: Asia Pacific Desalting And Buffer Exchange Market Revenue (Million), by Technique 2024 & 2032
- Figure 60: Asia Pacific Desalting And Buffer Exchange Market Volume (K Unit), by Technique 2024 & 2032
- Figure 61: Asia Pacific Desalting And Buffer Exchange Market Revenue Share (%), by Technique 2024 & 2032
- Figure 62: Asia Pacific Desalting And Buffer Exchange Market Volume Share (%), by Technique 2024 & 2032
- Figure 63: Asia Pacific Desalting And Buffer Exchange Market Revenue (Million), by Application 2024 & 2032
- Figure 64: Asia Pacific Desalting And Buffer Exchange Market Volume (K Unit), by Application 2024 & 2032
- Figure 65: Asia Pacific Desalting And Buffer Exchange Market Revenue Share (%), by Application 2024 & 2032
- Figure 66: Asia Pacific Desalting And Buffer Exchange Market Volume Share (%), by Application 2024 & 2032
- Figure 67: Asia Pacific Desalting And Buffer Exchange Market Revenue (Million), by Country 2024 & 2032
- Figure 68: Asia Pacific Desalting And Buffer Exchange Market Volume (K Unit), by Country 2024 & 2032
- Figure 69: Asia Pacific Desalting And Buffer Exchange Market Revenue Share (%), by Country 2024 & 2032
- Figure 70: Asia Pacific Desalting And Buffer Exchange Market Volume Share (%), by Country 2024 & 2032
- Figure 71: Middle East and Africa Desalting And Buffer Exchange Market Revenue (Million), by Product 2024 & 2032
- Figure 72: Middle East and Africa Desalting And Buffer Exchange Market Volume (K Unit), by Product 2024 & 2032
- Figure 73: Middle East and Africa Desalting And Buffer Exchange Market Revenue Share (%), by Product 2024 & 2032
- Figure 74: Middle East and Africa Desalting And Buffer Exchange Market Volume Share (%), by Product 2024 & 2032
- Figure 75: Middle East and Africa Desalting And Buffer Exchange Market Revenue (Million), by Technique 2024 & 2032
- Figure 76: Middle East and Africa Desalting And Buffer Exchange Market Volume (K Unit), by Technique 2024 & 2032
- Figure 77: Middle East and Africa Desalting And Buffer Exchange Market Revenue Share (%), by Technique 2024 & 2032
- Figure 78: Middle East and Africa Desalting And Buffer Exchange Market Volume Share (%), by Technique 2024 & 2032
- Figure 79: Middle East and Africa Desalting And Buffer Exchange Market Revenue (Million), by Application 2024 & 2032
- Figure 80: Middle East and Africa Desalting And Buffer Exchange Market Volume (K Unit), by Application 2024 & 2032
- Figure 81: Middle East and Africa Desalting And Buffer Exchange Market Revenue Share (%), by Application 2024 & 2032
- Figure 82: Middle East and Africa Desalting And Buffer Exchange Market Volume Share (%), by Application 2024 & 2032
- Figure 83: Middle East and Africa Desalting And Buffer Exchange Market Revenue (Million), by Country 2024 & 2032
- Figure 84: Middle East and Africa Desalting And Buffer Exchange Market Volume (K Unit), by Country 2024 & 2032
- Figure 85: Middle East and Africa Desalting And Buffer Exchange Market Revenue Share (%), by Country 2024 & 2032
- Figure 86: Middle East and Africa Desalting And Buffer Exchange Market Volume Share (%), by Country 2024 & 2032
- Figure 87: South America Desalting And Buffer Exchange Market Revenue (Million), by Product 2024 & 2032
- Figure 88: South America Desalting And Buffer Exchange Market Volume (K Unit), by Product 2024 & 2032
- Figure 89: South America Desalting And Buffer Exchange Market Revenue Share (%), by Product 2024 & 2032
- Figure 90: South America Desalting And Buffer Exchange Market Volume Share (%), by Product 2024 & 2032
- Figure 91: South America Desalting And Buffer Exchange Market Revenue (Million), by Technique 2024 & 2032
- Figure 92: South America Desalting And Buffer Exchange Market Volume (K Unit), by Technique 2024 & 2032
- Figure 93: South America Desalting And Buffer Exchange Market Revenue Share (%), by Technique 2024 & 2032
- Figure 94: South America Desalting And Buffer Exchange Market Volume Share (%), by Technique 2024 & 2032
- Figure 95: South America Desalting And Buffer Exchange Market Revenue (Million), by Application 2024 & 2032
- Figure 96: South America Desalting And Buffer Exchange Market Volume (K Unit), by Application 2024 & 2032
- Figure 97: South America Desalting And Buffer Exchange Market Revenue Share (%), by Application 2024 & 2032
- Figure 98: South America Desalting And Buffer Exchange Market Volume Share (%), by Application 2024 & 2032
- Figure 99: South America Desalting And Buffer Exchange Market Revenue (Million), by Country 2024 & 2032
- Figure 100: South America Desalting And Buffer Exchange Market Volume (K Unit), by Country 2024 & 2032
- Figure 101: South America Desalting And Buffer Exchange Market Revenue Share (%), by Country 2024 & 2032
- Figure 102: South America Desalting And Buffer Exchange Market Volume Share (%), by Country 2024 & 2032
List of Tables
- Table 1: Global Desalting And Buffer Exchange Market Revenue Million Forecast, by Region 2019 & 2032
- Table 2: Global Desalting And Buffer Exchange Market Volume K Unit Forecast, by Region 2019 & 2032
- Table 3: Global Desalting And Buffer Exchange Market Revenue Million Forecast, by Product 2019 & 2032
- Table 4: Global Desalting And Buffer Exchange Market Volume K Unit Forecast, by Product 2019 & 2032
- Table 5: Global Desalting And Buffer Exchange Market Revenue Million Forecast, by Technique 2019 & 2032
- Table 6: Global Desalting And Buffer Exchange Market Volume K Unit Forecast, by Technique 2019 & 2032
- Table 7: Global Desalting And Buffer Exchange Market Revenue Million Forecast, by Application 2019 & 2032
- Table 8: Global Desalting And Buffer Exchange Market Volume K Unit Forecast, by Application 2019 & 2032
- Table 9: Global Desalting And Buffer Exchange Market Revenue Million Forecast, by Region 2019 & 2032
- Table 10: Global Desalting And Buffer Exchange Market Volume K Unit Forecast, by Region 2019 & 2032
- Table 11: Global Desalting And Buffer Exchange Market Revenue Million Forecast, by Country 2019 & 2032
- Table 12: Global Desalting And Buffer Exchange Market Volume K Unit Forecast, by Country 2019 & 2032
- Table 13: United States Desalting And Buffer Exchange Market Revenue (Million) Forecast, by Application 2019 & 2032
- Table 14: United States Desalting And Buffer Exchange Market Volume (K Unit) Forecast, by Application 2019 & 2032
- Table 15: Canada Desalting And Buffer Exchange Market Revenue (Million) Forecast, by Application 2019 & 2032
- Table 16: Canada Desalting And Buffer Exchange Market Volume (K Unit) Forecast, by Application 2019 & 2032
- Table 17: Mexico Desalting And Buffer Exchange Market Revenue (Million) Forecast, by Application 2019 & 2032
- Table 18: Mexico Desalting And Buffer Exchange Market Volume (K Unit) Forecast, by Application 2019 & 2032
- Table 19: Global Desalting And Buffer Exchange Market Revenue Million Forecast, by Country 2019 & 2032
- Table 20: Global Desalting And Buffer Exchange Market Volume K Unit Forecast, by Country 2019 & 2032
- Table 21: Germany Desalting And Buffer Exchange Market Revenue (Million) Forecast, by Application 2019 & 2032
- Table 22: Germany Desalting And Buffer Exchange Market Volume (K Unit) Forecast, by Application 2019 & 2032
- Table 23: United Kingdom Desalting And Buffer Exchange Market Revenue (Million) Forecast, by Application 2019 & 2032
- Table 24: United Kingdom Desalting And Buffer Exchange Market Volume (K Unit) Forecast, by Application 2019 & 2032
- Table 25: France Desalting And Buffer Exchange Market Revenue (Million) Forecast, by Application 2019 & 2032
- Table 26: France Desalting And Buffer Exchange Market Volume (K Unit) Forecast, by Application 2019 & 2032
- Table 27: Italy Desalting And Buffer Exchange Market Revenue (Million) Forecast, by Application 2019 & 2032
- Table 28: Italy Desalting And Buffer Exchange Market Volume (K Unit) Forecast, by Application 2019 & 2032
- Table 29: Spain Desalting And Buffer Exchange Market Revenue (Million) Forecast, by Application 2019 & 2032
- Table 30: Spain Desalting And Buffer Exchange Market Volume (K Unit) Forecast, by Application 2019 & 2032
- Table 31: Rest of Europe Desalting And Buffer Exchange Market Revenue (Million) Forecast, by Application 2019 & 2032
- Table 32: Rest of Europe Desalting And Buffer Exchange Market Volume (K Unit) Forecast, by Application 2019 & 2032
- Table 33: Global Desalting And Buffer Exchange Market Revenue Million Forecast, by Country 2019 & 2032
- Table 34: Global Desalting And Buffer Exchange Market Volume K Unit Forecast, by Country 2019 & 2032
- Table 35: China Desalting And Buffer Exchange Market Revenue (Million) Forecast, by Application 2019 & 2032
- Table 36: China Desalting And Buffer Exchange Market Volume (K Unit) Forecast, by Application 2019 & 2032
- Table 37: Japan Desalting And Buffer Exchange Market Revenue (Million) Forecast, by Application 2019 & 2032
- Table 38: Japan Desalting And Buffer Exchange Market Volume (K Unit) Forecast, by Application 2019 & 2032
- Table 39: India Desalting And Buffer Exchange Market Revenue (Million) Forecast, by Application 2019 & 2032
- Table 40: India Desalting And Buffer Exchange Market Volume (K Unit) Forecast, by Application 2019 & 2032
- Table 41: Australia Desalting And Buffer Exchange Market Revenue (Million) Forecast, by Application 2019 & 2032
- Table 42: Australia Desalting And Buffer Exchange Market Volume (K Unit) Forecast, by Application 2019 & 2032
- Table 43: South Korea Desalting And Buffer Exchange Market Revenue (Million) Forecast, by Application 2019 & 2032
- Table 44: South Korea Desalting And Buffer Exchange Market Volume (K Unit) Forecast, by Application 2019 & 2032
- Table 45: Rest of Asia Pacific Desalting And Buffer Exchange Market Revenue (Million) Forecast, by Application 2019 & 2032
- Table 46: Rest of Asia Pacific Desalting And Buffer Exchange Market Volume (K Unit) Forecast, by Application 2019 & 2032
- Table 47: Global Desalting And Buffer Exchange Market Revenue Million Forecast, by Country 2019 & 2032
- Table 48: Global Desalting And Buffer Exchange Market Volume K Unit Forecast, by Country 2019 & 2032
- Table 49: GCC Desalting And Buffer Exchange Market Revenue (Million) Forecast, by Application 2019 & 2032
- Table 50: GCC Desalting And Buffer Exchange Market Volume (K Unit) Forecast, by Application 2019 & 2032
- Table 51: South Africa Desalting And Buffer Exchange Market Revenue (Million) Forecast, by Application 2019 & 2032
- Table 52: South Africa Desalting And Buffer Exchange Market Volume (K Unit) Forecast, by Application 2019 & 2032
- Table 53: Rest of Middle East and Africa Desalting And Buffer Exchange Market Revenue (Million) Forecast, by Application 2019 & 2032
- Table 54: Rest of Middle East and Africa Desalting And Buffer Exchange Market Volume (K Unit) Forecast, by Application 2019 & 2032
- Table 55: Global Desalting And Buffer Exchange Market Revenue Million Forecast, by Country 2019 & 2032
- Table 56: Global Desalting And Buffer Exchange Market Volume K Unit Forecast, by Country 2019 & 2032
- Table 57: Brazil Desalting And Buffer Exchange Market Revenue (Million) Forecast, by Application 2019 & 2032
- Table 58: Brazil Desalting And Buffer Exchange Market Volume (K Unit) Forecast, by Application 2019 & 2032
- Table 59: Argentina Desalting And Buffer Exchange Market Revenue (Million) Forecast, by Application 2019 & 2032
- Table 60: Argentina Desalting And Buffer Exchange Market Volume (K Unit) Forecast, by Application 2019 & 2032
- Table 61: Rest of South America Desalting And Buffer Exchange Market Revenue (Million) Forecast, by Application 2019 & 2032
- Table 62: Rest of South America Desalting And Buffer Exchange Market Volume (K Unit) Forecast, by Application 2019 & 2032
- Table 63: Global Desalting And Buffer Exchange Market Revenue Million Forecast, by Product 2019 & 2032
- Table 64: Global Desalting And Buffer Exchange Market Volume K Unit Forecast, by Product 2019 & 2032
- Table 65: Global Desalting And Buffer Exchange Market Revenue Million Forecast, by Technique 2019 & 2032
- Table 66: Global Desalting And Buffer Exchange Market Volume K Unit Forecast, by Technique 2019 & 2032
- Table 67: Global Desalting And Buffer Exchange Market Revenue Million Forecast, by Application 2019 & 2032
- Table 68: Global Desalting And Buffer Exchange Market Volume K Unit Forecast, by Application 2019 & 2032
- Table 69: Global Desalting And Buffer Exchange Market Revenue Million Forecast, by Country 2019 & 2032
- Table 70: Global Desalting And Buffer Exchange Market Volume K Unit Forecast, by Country 2019 & 2032
- Table 71: United States Desalting And Buffer Exchange Market Revenue (Million) Forecast, by Application 2019 & 2032
- Table 72: United States Desalting And Buffer Exchange Market Volume (K Unit) Forecast, by Application 2019 & 2032
- Table 73: Canada Desalting And Buffer Exchange Market Revenue (Million) Forecast, by Application 2019 & 2032
- Table 74: Canada Desalting And Buffer Exchange Market Volume (K Unit) Forecast, by Application 2019 & 2032
- Table 75: Mexico Desalting And Buffer Exchange Market Revenue (Million) Forecast, by Application 2019 & 2032
- Table 76: Mexico Desalting And Buffer Exchange Market Volume (K Unit) Forecast, by Application 2019 & 2032
- Table 77: Global Desalting And Buffer Exchange Market Revenue Million Forecast, by Product 2019 & 2032
- Table 78: Global Desalting And Buffer Exchange Market Volume K Unit Forecast, by Product 2019 & 2032
- Table 79: Global Desalting And Buffer Exchange Market Revenue Million Forecast, by Technique 2019 & 2032
- Table 80: Global Desalting And Buffer Exchange Market Volume K Unit Forecast, by Technique 2019 & 2032
- Table 81: Global Desalting And Buffer Exchange Market Revenue Million Forecast, by Application 2019 & 2032
- Table 82: Global Desalting And Buffer Exchange Market Volume K Unit Forecast, by Application 2019 & 2032
- Table 83: Global Desalting And Buffer Exchange Market Revenue Million Forecast, by Country 2019 & 2032
- Table 84: Global Desalting And Buffer Exchange Market Volume K Unit Forecast, by Country 2019 & 2032
- Table 85: Germany Desalting And Buffer Exchange Market Revenue (Million) Forecast, by Application 2019 & 2032
- Table 86: Germany Desalting And Buffer Exchange Market Volume (K Unit) Forecast, by Application 2019 & 2032
- Table 87: United Kingdom Desalting And Buffer Exchange Market Revenue (Million) Forecast, by Application 2019 & 2032
- Table 88: United Kingdom Desalting And Buffer Exchange Market Volume (K Unit) Forecast, by Application 2019 & 2032
- Table 89: France Desalting And Buffer Exchange Market Revenue (Million) Forecast, by Application 2019 & 2032
- Table 90: France Desalting And Buffer Exchange Market Volume (K Unit) Forecast, by Application 2019 & 2032
- Table 91: Italy Desalting And Buffer Exchange Market Revenue (Million) Forecast, by Application 2019 & 2032
- Table 92: Italy Desalting And Buffer Exchange Market Volume (K Unit) Forecast, by Application 2019 & 2032
- Table 93: Spain Desalting And Buffer Exchange Market Revenue (Million) Forecast, by Application 2019 & 2032
- Table 94: Spain Desalting And Buffer Exchange Market Volume (K Unit) Forecast, by Application 2019 & 2032
- Table 95: Rest of Europe Desalting And Buffer Exchange Market Revenue (Million) Forecast, by Application 2019 & 2032
- Table 96: Rest of Europe Desalting And Buffer Exchange Market Volume (K Unit) Forecast, by Application 2019 & 2032
- Table 97: Global Desalting And Buffer Exchange Market Revenue Million Forecast, by Product 2019 & 2032
- Table 98: Global Desalting And Buffer Exchange Market Volume K Unit Forecast, by Product 2019 & 2032
- Table 99: Global Desalting And Buffer Exchange Market Revenue Million Forecast, by Technique 2019 & 2032
- Table 100: Global Desalting And Buffer Exchange Market Volume K Unit Forecast, by Technique 2019 & 2032
- Table 101: Global Desalting And Buffer Exchange Market Revenue Million Forecast, by Application 2019 & 2032
- Table 102: Global Desalting And Buffer Exchange Market Volume K Unit Forecast, by Application 2019 & 2032
- Table 103: Global Desalting And Buffer Exchange Market Revenue Million Forecast, by Country 2019 & 2032
- Table 104: Global Desalting And Buffer Exchange Market Volume K Unit Forecast, by Country 2019 & 2032
- Table 105: China Desalting And Buffer Exchange Market Revenue (Million) Forecast, by Application 2019 & 2032
- Table 106: China Desalting And Buffer Exchange Market Volume (K Unit) Forecast, by Application 2019 & 2032
- Table 107: Japan Desalting And Buffer Exchange Market Revenue (Million) Forecast, by Application 2019 & 2032
- Table 108: Japan Desalting And Buffer Exchange Market Volume (K Unit) Forecast, by Application 2019 & 2032
- Table 109: India Desalting And Buffer Exchange Market Revenue (Million) Forecast, by Application 2019 & 2032
- Table 110: India Desalting And Buffer Exchange Market Volume (K Unit) Forecast, by Application 2019 & 2032
- Table 111: Australia Desalting And Buffer Exchange Market Revenue (Million) Forecast, by Application 2019 & 2032
- Table 112: Australia Desalting And Buffer Exchange Market Volume (K Unit) Forecast, by Application 2019 & 2032
- Table 113: South Korea Desalting And Buffer Exchange Market Revenue (Million) Forecast, by Application 2019 & 2032
- Table 114: South Korea Desalting And Buffer Exchange Market Volume (K Unit) Forecast, by Application 2019 & 2032
- Table 115: Rest of Asia Pacific Desalting And Buffer Exchange Market Revenue (Million) Forecast, by Application 2019 & 2032
- Table 116: Rest of Asia Pacific Desalting And Buffer Exchange Market Volume (K Unit) Forecast, by Application 2019 & 2032
- Table 117: Global Desalting And Buffer Exchange Market Revenue Million Forecast, by Product 2019 & 2032
- Table 118: Global Desalting And Buffer Exchange Market Volume K Unit Forecast, by Product 2019 & 2032
- Table 119: Global Desalting And Buffer Exchange Market Revenue Million Forecast, by Technique 2019 & 2032
- Table 120: Global Desalting And Buffer Exchange Market Volume K Unit Forecast, by Technique 2019 & 2032
- Table 121: Global Desalting And Buffer Exchange Market Revenue Million Forecast, by Application 2019 & 2032
- Table 122: Global Desalting And Buffer Exchange Market Volume K Unit Forecast, by Application 2019 & 2032
- Table 123: Global Desalting And Buffer Exchange Market Revenue Million Forecast, by Country 2019 & 2032
- Table 124: Global Desalting And Buffer Exchange Market Volume K Unit Forecast, by Country 2019 & 2032
- Table 125: GCC Desalting And Buffer Exchange Market Revenue (Million) Forecast, by Application 2019 & 2032
- Table 126: GCC Desalting And Buffer Exchange Market Volume (K Unit) Forecast, by Application 2019 & 2032
- Table 127: South Africa Desalting And Buffer Exchange Market Revenue (Million) Forecast, by Application 2019 & 2032
- Table 128: South Africa Desalting And Buffer Exchange Market Volume (K Unit) Forecast, by Application 2019 & 2032
- Table 129: Rest of Middle East and Africa Desalting And Buffer Exchange Market Revenue (Million) Forecast, by Application 2019 & 2032
- Table 130: Rest of Middle East and Africa Desalting And Buffer Exchange Market Volume (K Unit) Forecast, by Application 2019 & 2032
- Table 131: Global Desalting And Buffer Exchange Market Revenue Million Forecast, by Product 2019 & 2032
- Table 132: Global Desalting And Buffer Exchange Market Volume K Unit Forecast, by Product 2019 & 2032
- Table 133: Global Desalting And Buffer Exchange Market Revenue Million Forecast, by Technique 2019 & 2032
- Table 134: Global Desalting And Buffer Exchange Market Volume K Unit Forecast, by Technique 2019 & 2032
- Table 135: Global Desalting And Buffer Exchange Market Revenue Million Forecast, by Application 2019 & 2032
- Table 136: Global Desalting And Buffer Exchange Market Volume K Unit Forecast, by Application 2019 & 2032
- Table 137: Global Desalting And Buffer Exchange Market Revenue Million Forecast, by Country 2019 & 2032
- Table 138: Global Desalting And Buffer Exchange Market Volume K Unit Forecast, by Country 2019 & 2032
- Table 139: Brazil Desalting And Buffer Exchange Market Revenue (Million) Forecast, by Application 2019 & 2032
- Table 140: Brazil Desalting And Buffer Exchange Market Volume (K Unit) Forecast, by Application 2019 & 2032
- Table 141: Argentina Desalting And Buffer Exchange Market Revenue (Million) Forecast, by Application 2019 & 2032
- Table 142: Argentina Desalting And Buffer Exchange Market Volume (K Unit) Forecast, by Application 2019 & 2032
- Table 143: Rest of South America Desalting And Buffer Exchange Market Revenue (Million) Forecast, by Application 2019 & 2032
- Table 144: Rest of South America Desalting And Buffer Exchange Market Volume (K Unit) Forecast, by Application 2019 & 2032
Frequently Asked Questions
1. What is the projected Compound Annual Growth Rate (CAGR) of the Desalting And Buffer Exchange Market?
The projected CAGR is approximately 10.10%.
2. Which companies are prominent players in the Desalting And Buffer Exchange Market?
Key companies in the market include Repligen Corporation, Agilient Technologies Inc, Bio-Rad Laboratories Inc, Merck KGaA, Thermo Fisher Scientific Inc, Danaher Corporation (Cytvia), Bio-Works Technologies, Sartorius AG, GE HealthCare Technologies Inc, Norgen Bioteck Corp.
3. What are the main segments of the Desalting And Buffer Exchange Market?
The market segments include Product, Technique, Application.
4. Can you provide details about the market size?
The market size is estimated to be USD XX Million as of 2022.
5. What are some drivers contributing to market growth?
Increasing Research and Development by Biopharmaceutical Industries; Rising Focus on the Proteomic and Genomic Research.
6. What are the notable trends driving market growth?
The Pharmaceutical and Biotechnology Industries Segment is Expected to Witness Significant Growth Over the Forecast Period.
7. Are there any restraints impacting market growth?
Lack of Skilled Professionals.
8. Can you provide examples of recent developments in the market?
January 2023: Sartorius extended a strategic collaboration partnership agreement with RoosterBio Inc. to address purification challenges and establish scalable downstream manufacturing processes for exosome-based therapies. The collaboration would strengthen the bioprocessing portfolio of the company.
9. What pricing options are available for accessing the report?
Pricing options include single-user, multi-user, and enterprise licenses priced at USD 4750, USD 5250, and USD 8750 respectively.
10. Is the market size provided in terms of value or volume?
The market size is provided in terms of value, measured in Million and volume, measured in K Unit.
11. Are there any specific market keywords associated with the report?
Yes, the market keyword associated with the report is "Desalting And Buffer Exchange Market," which aids in identifying and referencing the specific market segment covered.
12. How do I determine which pricing option suits my needs best?
The pricing options vary based on user requirements and access needs. Individual users may opt for single-user licenses, while businesses requiring broader access may choose multi-user or enterprise licenses for cost-effective access to the report.
13. Are there any additional resources or data provided in the Desalting And Buffer Exchange Market report?
While the report offers comprehensive insights, it's advisable to review the specific contents or supplementary materials provided to ascertain if additional resources or data are available.
14. How can I stay updated on further developments or reports in the Desalting And Buffer Exchange Market?
To stay informed about further developments, trends, and reports in the Desalting And Buffer Exchange Market, consider subscribing to industry newsletters, following relevant companies and organizations, or regularly checking reputable industry news sources and publications.
Methodology
Step 1 - Identification of Relevant Samples Size from Population Database


Step 2 - Approaches for Defining Global Market Size (Value, Volume* & Price*)

Note*: In applicable scenarios
Step 3 - Data Sources
Primary Research
- Web Analytics
- Survey Reports
- Research Institute
- Latest Research Reports
- Opinion Leaders
Secondary Research
- Annual Reports
- White Paper
- Latest Press Release
- Industry Association
- Paid Database
- Investor Presentations

Step 4 - Data Triangulation
Involves using different sources of information in order to increase the validity of a study
These sources are likely to be stakeholders in a program - participants, other researchers, program staff, other community members, and so on.
Then we put all data in single framework & apply various statistical tools to find out the dynamic on the market.
During the analysis stage, feedback from the stakeholder groups would be compared to determine areas of agreement as well as areas of divergence
