

Key Insights
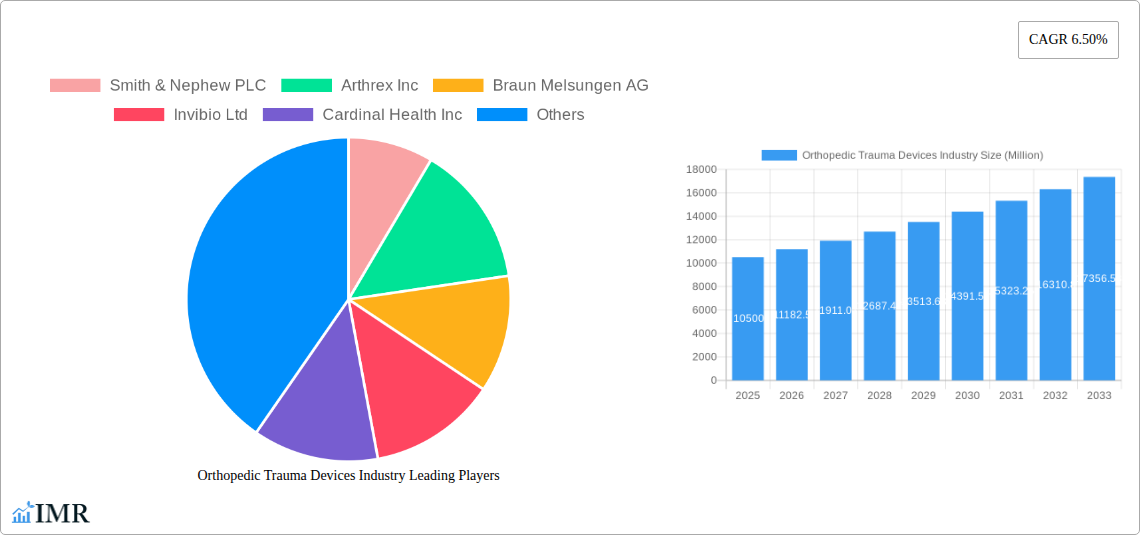
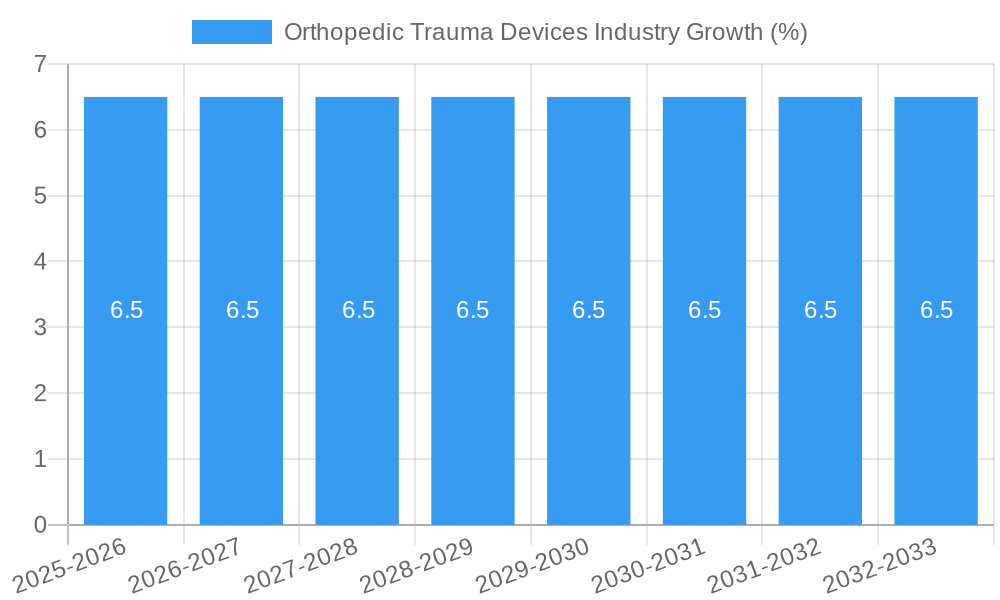
The global Orthopedic Trauma Devices market is poised for robust expansion, with an estimated market size of approximately USD 10,500 million in 2025, projected to grow at a Compound Annual Growth Rate (CAGR) of 6.50% through 2033. This significant growth is underpinned by a confluence of favorable market drivers, including the increasing incidence of orthopedic injuries due to aging populations, a rise in sports-related trauma, and a growing number of road traffic accidents worldwide. Advancements in surgical techniques, coupled with the development of innovative implant materials and minimally invasive fixation devices, are further stimulating market demand. Furthermore, the increasing prevalence of osteoporosis and other bone-weakening conditions, particularly among the elderly, contributes to a higher susceptibility to fractures, thereby driving the need for effective trauma management solutions. The expanding healthcare infrastructure in emerging economies and increased healthcare expenditure are also playing a crucial role in market penetration.
The competitive landscape for orthopedic trauma devices is characterized by a dynamic mix of established global players and emerging innovators, with companies like Stryker Corporation, Zimmer Biomet, and Johnson & Johnson holding significant market shares. The market segmentation offers diverse opportunities, with internal fixators, particularly plates and screws, dominating the type segment due to their widespread application. In terms of surgical site, lower extremities, especially the hip and pelvic regions, represent a substantial market due to the high incidence of fractures in these areas. The rising adoption of ambulatory surgery centers (ASCs) as cost-effective and efficient alternatives to hospitals is another notable trend, alongside an increasing preference for biologics and advanced materials that promote faster bone healing and reduce infection rates. However, market growth could be tempered by stringent regulatory approvals for new devices, the high cost of advanced orthopedic trauma solutions, and the availability of counterfeit products in certain regions.
Comprehensive Orthopedic Trauma Devices Industry Report: Market Dynamics, Growth Forecasts, and Key Player Analysis (2019-2033)
This in-depth report provides a detailed analysis of the global orthopedic trauma devices market, offering critical insights into market dynamics, growth trajectories, and competitive landscapes. With a study period spanning from 2019 to 2033, a base year of 2025, and a forecast period of 2025-2033, this research equips industry professionals with actionable intelligence to navigate the evolving market. The report covers a comprehensive breakdown of segments including Internal Fixators (Plates, Screws, Nails, Others), External Fixators (Unilateral and Bilateral External Fixators, Circular Fixators, Hybrid Fixators), Surgical Sites (Lower Extremities - Hip and Pelvic, Foot and Ankle, Knee, Others; Upper Extremities - Hand and Wrist, Shoulder, Spine), and End Users (Hospitals, Ambulatory Surgery Centers, Other End Users). All quantitative values are presented in Million units for clarity and comparability.
Orthopedic Trauma Devices Industry Market Dynamics & Structure
The orthopedic trauma devices market exhibits a moderately concentrated structure, characterized by the significant presence of established global players alongside a growing number of specialized manufacturers. Technological innovation serves as a primary driver, with continuous advancements in implant materials, surgical techniques, and imaging modalities shaping product development. The increasing prevalence of sports-related injuries, road traffic accidents, and the aging global population, leading to higher incidences of fractures and bone disorders, are key demand stimulants. Regulatory frameworks, particularly the stringent approval processes by bodies like the FDA and EMA, influence market entry and product lifecycle management. Competitive product substitutes, including alternative treatment methods and less invasive surgical options, pose a constant challenge. End-user demographics, with a growing preference for minimally invasive procedures and faster recovery times, are also shaping market demands. Mergers and acquisitions (M&A) trends are prevalent as larger companies seek to expand their product portfolios, geographic reach, and technological capabilities.
- Market Concentration: Dominated by a few key players, but with growing niche market opportunities.
- Technological Innovation: Driven by biomaterials, robotics in surgery, and personalized implant design.
- Regulatory Impact: Strict approval processes for new devices and materials.
- Competitive Landscape: Influence of alternative treatments and less invasive surgical techniques.
- End-User Preferences: Demand for faster recovery, improved patient outcomes, and minimally invasive solutions.
- M&A Activity: Strategic acquisitions to consolidate market share and acquire advanced technologies.
Orthopedic Trauma Devices Industry Growth Trends & Insights
The orthopedic trauma devices market is poised for robust growth, projected to experience a significant Compound Annual Growth Rate (CAGR) over the forecast period. This expansion is fueled by an increasing global incidence of trauma-related injuries and fractures, driven by factors such as road accidents, sports participation, and an aging population susceptible to falls and osteoporosis. The adoption of advanced fixation techniques, including the growing use of innovative materials like biocompatible polymers and titanium alloys, is enhancing implant durability and patient outcomes, thereby accelerating market penetration. Technological disruptions, such as the integration of AI in surgical planning and the development of smart implants with integrated sensors for real-time monitoring, are also playing a crucial role in driving market evolution. Consumer behavior shifts towards seeking quicker recovery times and less invasive surgical procedures are compelling manufacturers to develop advanced and patient-centric solutions. The market size is expected to expand from approximately 7,800 million units in 2025 to over 10,500 million units by 2033, reflecting a steady upward trajectory in demand for effective trauma care solutions. The penetration of specialized trauma fixation devices in emerging economies is also a key growth driver.
Dominant Regions, Countries, or Segments in Orthopedic Trauma Devices Industry
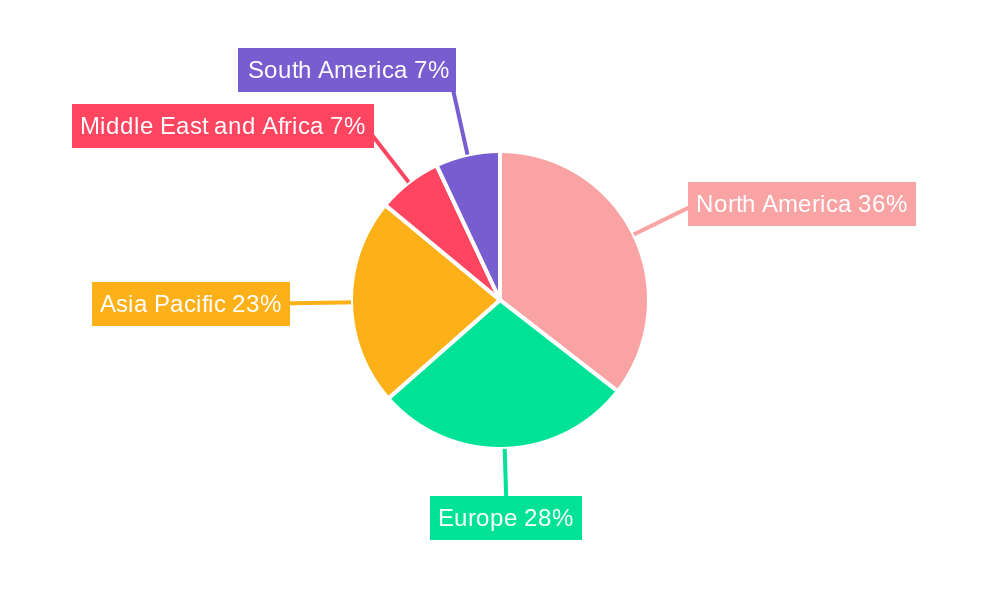
The Lower Extremities segment, specifically the Hip and Pelvic and Knee sub-segments, is expected to remain the dominant force in the global orthopedic trauma devices market. This dominance is attributed to the high incidence of fractures in these areas due to falls, sports injuries, and the increasing prevalence of osteoporosis in the aging global population. North America, led by the United States, is anticipated to be the leading region, driven by a well-established healthcare infrastructure, high healthcare expenditure, advanced technological adoption, and a strong emphasis on research and development.
- Dominant Surgical Site Segment: Lower Extremities (Hip and Pelvic, Knee)
- Drivers: High prevalence of fractures due to aging population, osteoporosis, and increased sports participation.
- Market Share: Expected to command over 45% of the total market.
- Growth Potential: Driven by advancements in joint replacement and fracture fixation techniques.
- Leading Region: North America (United States)
- Dominance Factors: High healthcare spending, advanced medical technology adoption, strong reimbursement policies, and a significant number of orthopedic trauma centers.
- Economic Policies: Favorable regulatory environment for medical devices.
- Infrastructure: Extensive network of hospitals and specialized trauma care facilities.
- Key Countries: United States, Germany, Japan, China, India.
- Growth Drivers in Leading Segments:
- Internal Fixators (Plates, Screws, Nails): Widely used for definitive fracture stabilization, benefiting from advancements in materials and design.
- Hospitals: Primary end-users due to the complexity of trauma cases and the need for advanced surgical interventions.
- Technological Advancements: Introduction of bioabsorbable materials and smart implants enhancing treatment efficacy.
Orthopedic Trauma Devices Industry Product Landscape
The orthopedic trauma devices industry is characterized by continuous product innovation focused on enhancing patient outcomes, minimizing invasiveness, and improving surgical efficiency. Key advancements include the development of next-generation implant materials offering superior biocompatibility and mechanical properties, such as advanced titanium alloys and bioresorbable polymers. Specialized fixation devices tailored for specific fracture patterns and anatomical locations, including patient-specific implants designed using 3D printing technology, are gaining traction. Furthermore, the integration of antimicrobial coatings aims to reduce the incidence of surgical site infections. Performance metrics such as reduced healing times, improved bone integration, and enhanced patient mobility are critical selling propositions driving the adoption of these innovative products.
Key Drivers, Barriers & Challenges in Orthopedic Trauma Devices Industry
Key Drivers:
The orthopedic trauma devices market is propelled by several key forces. Technological advancements in biomaterials, implant design, and surgical instrumentation are creating more effective and less invasive treatment options. The rising global incidence of trauma, driven by an increasing elderly population prone to fractures and a surge in sports-related injuries, directly fuels demand. Furthermore, growing healthcare expenditure globally, coupled with improving access to advanced medical facilities, especially in emerging economies, significantly boosts market growth.
Barriers & Challenges:
Despite robust growth, the industry faces several hurdles. Stringent regulatory approval processes for new devices can be time-consuming and costly, posing a significant barrier to market entry for smaller companies. Supply chain disruptions, as experienced in recent global events, can impact the availability of raw materials and finished products. Intense competition among established players and the increasing threat of counterfeit products also present challenges. Moreover, the high cost of advanced trauma devices can limit accessibility in price-sensitive markets.
Emerging Opportunities in Orthopedic Trauma Devices Industry
Emerging opportunities within the orthopedic trauma devices market lie in the development and adoption of personalized medicine approaches, including patient-specific implants fabricated through advanced 3D printing technologies. The growing demand for minimally invasive surgical techniques is creating opportunities for innovative external fixation devices and novel internal fixation systems that facilitate less invasive procedures. Furthermore, the untapped potential in emerging economies with rapidly expanding healthcare infrastructure and a growing middle class presents significant market expansion avenues. The development of smart implants with integrated sensors for remote patient monitoring and data collection also represents a promising area for future growth and innovation.
Growth Accelerators in the Orthopedic Trauma Devices Industry Industry
Several catalysts are accelerating long-term growth in the orthopedic trauma devices industry. Technological breakthroughs, such as the development of bioabsorbable implants that gradually dissolve as bone heals, are reducing the need for secondary removal surgeries. Strategic partnerships and collaborations between device manufacturers and research institutions are fostering the rapid development and commercialization of cutting-edge technologies. Market expansion strategies, particularly focusing on underserved geographic regions and expanding the application of existing devices to new trauma indications, are also contributing significantly to sustained growth.
Key Players Shaping the Orthopedic Trauma Devices Industry Market
- Smith & Nephew PLC
- Arthrex Inc
- Braun Melsungen AG
- Invibio Ltd
- Cardinal Health Inc
- Medtronic PLC
- Orthofix Medical Inc
- Conmed Corporation
- Johnson & Johnson
- Stryker Corporation
- Zimmer Biomet
Notable Milestones in Orthopedic Trauma Devices Industry Sector
- October 2020: DePuy Synthes (Johnson & Johnson) launched the 'FIBULINK Syndesmosis Repair System' in the United States, designed for treating traumatic syndesmosis injuries.
- July 2020: Orthofix received US FDA and CE Mark approval for its 'JuniOrtho plating system', a device specifically engineered for pediatric patients requiring advanced deformity and trauma reconstruction of the lower extremities.
In-Depth Orthopedic Trauma Devices Industry Market Outlook
The future outlook for the orthopedic trauma devices market is exceptionally promising, driven by a confluence of persistent demand and continuous innovation. The increasing global burden of fractures and trauma injuries, coupled with the demographic shift towards an aging population, ensures a sustained need for effective fixation and stabilization solutions. Growth accelerators such as advancements in robotic-assisted surgery, the integration of artificial intelligence in pre-operative planning, and the development of next-generation biomaterials will further enhance treatment efficacy and patient recovery. Strategic market expansion into emerging economies, coupled with a heightened focus on developing cost-effective and accessible trauma care solutions, presents significant untapped potential for market participants to capitalize on and drive future growth.
Orthopedic Trauma Devices Industry Segmentation
-
1. Type
-
1.1. Internal Fixators
- 1.1.1. Plates
- 1.1.2. Screws
- 1.1.3. Nails
- 1.1.4. Others
-
1.2. External Fixators
- 1.2.1. Unilateral and Bilateral External Fixators
- 1.2.2. Circular Fixators
- 1.2.3. Hybrid Fixators
-
1.1. Internal Fixators
-
2. Surgical Site
-
2.1. Lower Extremities
- 2.1.1. Hip and Pelvic
- 2.1.2. Foot and Ankle
- 2.1.3. Knee
- 2.1.4. Others
-
2.2. Upper Extremities
- 2.2.1. Hand and Wrist
- 2.2.2. Shoulder
- 2.2.3. Spine
-
2.1. Lower Extremities
-
3. End User
- 3.1. Hospitals
- 3.2. Ambulatory Surgery Centers
- 3.3. Other End Users
Orthopedic Trauma Devices Industry Segmentation By Geography
-
1. North America
- 1.1. United States
- 1.2. Canada
- 1.3. Mexico
-
2. Europe
- 2.1. Germany
- 2.2. United Kingdom
- 2.3. France
- 2.4. Italy
- 2.5. Spain
- 2.6. Rest of Europe
-
3. Asia Pacific
- 3.1. China
- 3.2. Japan
- 3.3. India
- 3.4. Australia
- 3.5. South Korea
- 3.6. Rest of Asia Pacific
-
4. Middle East and Africa
- 4.1. GCC
- 4.2. South Africa
- 4.3. Rest of Middle East and Africa
-
5. South America
- 5.1. Brazil
- 5.2. Argentina
- 5.3. Rest of South America
Orthopedic Trauma Devices Industry REPORT HIGHLIGHTS
| Aspects | Details |
|---|---|
| Study Period | 2019-2033 |
| Base Year | 2024 |
| Estimated Year | 2025 |
| Forecast Period | 2025-2033 |
| Historical Period | 2019-2024 |
| Growth Rate | CAGR of 6.50% from 2019-2033 |
| Segmentation |
|
Table of Contents
- 1. Introduction
- 1.1. Research Scope
- 1.2. Market Segmentation
- 1.3. Research Methodology
- 1.4. Definitions and Assumptions
- 2. Executive Summary
- 2.1. Introduction
- 3. Market Dynamics
- 3.1. Introduction
- 3.2. Market Drivers
- 3.2.1. Growing Burden of Bone Degenerative Diseases; Increasing Number of Road Accidents; Technological Advancements in Medical Devices
- 3.3. Market Restrains
- 3.3.1. Lack of Trained Professionals; Stringent Regulatory Issues
- 3.4. Market Trends
- 3.4.1. Circular Fixators Segment is Expected to Hold a Major Share in the Trauma Fixation Devices Market
- 4. Market Factor Analysis
- 4.1. Porters Five Forces
- 4.2. Supply/Value Chain
- 4.3. PESTEL analysis
- 4.4. Market Entropy
- 4.5. Patent/Trademark Analysis
- 5. Global Orthopedic Trauma Devices Industry Analysis, Insights and Forecast, 2019-2031
- 5.1. Market Analysis, Insights and Forecast - by Type
- 5.1.1. Internal Fixators
- 5.1.1.1. Plates
- 5.1.1.2. Screws
- 5.1.1.3. Nails
- 5.1.1.4. Others
- 5.1.2. External Fixators
- 5.1.2.1. Unilateral and Bilateral External Fixators
- 5.1.2.2. Circular Fixators
- 5.1.2.3. Hybrid Fixators
- 5.1.1. Internal Fixators
- 5.2. Market Analysis, Insights and Forecast - by Surgical Site
- 5.2.1. Lower Extremities
- 5.2.1.1. Hip and Pelvic
- 5.2.1.2. Foot and Ankle
- 5.2.1.3. Knee
- 5.2.1.4. Others
- 5.2.2. Upper Extremities
- 5.2.2.1. Hand and Wrist
- 5.2.2.2. Shoulder
- 5.2.2.3. Spine
- 5.2.1. Lower Extremities
- 5.3. Market Analysis, Insights and Forecast - by End User
- 5.3.1. Hospitals
- 5.3.2. Ambulatory Surgery Centers
- 5.3.3. Other End Users
- 5.4. Market Analysis, Insights and Forecast - by Region
- 5.4.1. North America
- 5.4.2. Europe
- 5.4.3. Asia Pacific
- 5.4.4. Middle East and Africa
- 5.4.5. South America
- 5.1. Market Analysis, Insights and Forecast - by Type
- 6. North America Orthopedic Trauma Devices Industry Analysis, Insights and Forecast, 2019-2031
- 6.1. Market Analysis, Insights and Forecast - by Type
- 6.1.1. Internal Fixators
- 6.1.1.1. Plates
- 6.1.1.2. Screws
- 6.1.1.3. Nails
- 6.1.1.4. Others
- 6.1.2. External Fixators
- 6.1.2.1. Unilateral and Bilateral External Fixators
- 6.1.2.2. Circular Fixators
- 6.1.2.3. Hybrid Fixators
- 6.1.1. Internal Fixators
- 6.2. Market Analysis, Insights and Forecast - by Surgical Site
- 6.2.1. Lower Extremities
- 6.2.1.1. Hip and Pelvic
- 6.2.1.2. Foot and Ankle
- 6.2.1.3. Knee
- 6.2.1.4. Others
- 6.2.2. Upper Extremities
- 6.2.2.1. Hand and Wrist
- 6.2.2.2. Shoulder
- 6.2.2.3. Spine
- 6.2.1. Lower Extremities
- 6.3. Market Analysis, Insights and Forecast - by End User
- 6.3.1. Hospitals
- 6.3.2. Ambulatory Surgery Centers
- 6.3.3. Other End Users
- 6.1. Market Analysis, Insights and Forecast - by Type
- 7. Europe Orthopedic Trauma Devices Industry Analysis, Insights and Forecast, 2019-2031
- 7.1. Market Analysis, Insights and Forecast - by Type
- 7.1.1. Internal Fixators
- 7.1.1.1. Plates
- 7.1.1.2. Screws
- 7.1.1.3. Nails
- 7.1.1.4. Others
- 7.1.2. External Fixators
- 7.1.2.1. Unilateral and Bilateral External Fixators
- 7.1.2.2. Circular Fixators
- 7.1.2.3. Hybrid Fixators
- 7.1.1. Internal Fixators
- 7.2. Market Analysis, Insights and Forecast - by Surgical Site
- 7.2.1. Lower Extremities
- 7.2.1.1. Hip and Pelvic
- 7.2.1.2. Foot and Ankle
- 7.2.1.3. Knee
- 7.2.1.4. Others
- 7.2.2. Upper Extremities
- 7.2.2.1. Hand and Wrist
- 7.2.2.2. Shoulder
- 7.2.2.3. Spine
- 7.2.1. Lower Extremities
- 7.3. Market Analysis, Insights and Forecast - by End User
- 7.3.1. Hospitals
- 7.3.2. Ambulatory Surgery Centers
- 7.3.3. Other End Users
- 7.1. Market Analysis, Insights and Forecast - by Type
- 8. Asia Pacific Orthopedic Trauma Devices Industry Analysis, Insights and Forecast, 2019-2031
- 8.1. Market Analysis, Insights and Forecast - by Type
- 8.1.1. Internal Fixators
- 8.1.1.1. Plates
- 8.1.1.2. Screws
- 8.1.1.3. Nails
- 8.1.1.4. Others
- 8.1.2. External Fixators
- 8.1.2.1. Unilateral and Bilateral External Fixators
- 8.1.2.2. Circular Fixators
- 8.1.2.3. Hybrid Fixators
- 8.1.1. Internal Fixators
- 8.2. Market Analysis, Insights and Forecast - by Surgical Site
- 8.2.1. Lower Extremities
- 8.2.1.1. Hip and Pelvic
- 8.2.1.2. Foot and Ankle
- 8.2.1.3. Knee
- 8.2.1.4. Others
- 8.2.2. Upper Extremities
- 8.2.2.1. Hand and Wrist
- 8.2.2.2. Shoulder
- 8.2.2.3. Spine
- 8.2.1. Lower Extremities
- 8.3. Market Analysis, Insights and Forecast - by End User
- 8.3.1. Hospitals
- 8.3.2. Ambulatory Surgery Centers
- 8.3.3. Other End Users
- 8.1. Market Analysis, Insights and Forecast - by Type
- 9. Middle East and Africa Orthopedic Trauma Devices Industry Analysis, Insights and Forecast, 2019-2031
- 9.1. Market Analysis, Insights and Forecast - by Type
- 9.1.1. Internal Fixators
- 9.1.1.1. Plates
- 9.1.1.2. Screws
- 9.1.1.3. Nails
- 9.1.1.4. Others
- 9.1.2. External Fixators
- 9.1.2.1. Unilateral and Bilateral External Fixators
- 9.1.2.2. Circular Fixators
- 9.1.2.3. Hybrid Fixators
- 9.1.1. Internal Fixators
- 9.2. Market Analysis, Insights and Forecast - by Surgical Site
- 9.2.1. Lower Extremities
- 9.2.1.1. Hip and Pelvic
- 9.2.1.2. Foot and Ankle
- 9.2.1.3. Knee
- 9.2.1.4. Others
- 9.2.2. Upper Extremities
- 9.2.2.1. Hand and Wrist
- 9.2.2.2. Shoulder
- 9.2.2.3. Spine
- 9.2.1. Lower Extremities
- 9.3. Market Analysis, Insights and Forecast - by End User
- 9.3.1. Hospitals
- 9.3.2. Ambulatory Surgery Centers
- 9.3.3. Other End Users
- 9.1. Market Analysis, Insights and Forecast - by Type
- 10. South America Orthopedic Trauma Devices Industry Analysis, Insights and Forecast, 2019-2031
- 10.1. Market Analysis, Insights and Forecast - by Type
- 10.1.1. Internal Fixators
- 10.1.1.1. Plates
- 10.1.1.2. Screws
- 10.1.1.3. Nails
- 10.1.1.4. Others
- 10.1.2. External Fixators
- 10.1.2.1. Unilateral and Bilateral External Fixators
- 10.1.2.2. Circular Fixators
- 10.1.2.3. Hybrid Fixators
- 10.1.1. Internal Fixators
- 10.2. Market Analysis, Insights and Forecast - by Surgical Site
- 10.2.1. Lower Extremities
- 10.2.1.1. Hip and Pelvic
- 10.2.1.2. Foot and Ankle
- 10.2.1.3. Knee
- 10.2.1.4. Others
- 10.2.2. Upper Extremities
- 10.2.2.1. Hand and Wrist
- 10.2.2.2. Shoulder
- 10.2.2.3. Spine
- 10.2.1. Lower Extremities
- 10.3. Market Analysis, Insights and Forecast - by End User
- 10.3.1. Hospitals
- 10.3.2. Ambulatory Surgery Centers
- 10.3.3. Other End Users
- 10.1. Market Analysis, Insights and Forecast - by Type
- 11. North America Orthopedic Trauma Devices Industry Analysis, Insights and Forecast, 2019-2031
- 11.1. Market Analysis, Insights and Forecast - By Country/Sub-region
- 11.1.1. undefined
- 12. Europe Orthopedic Trauma Devices Industry Analysis, Insights and Forecast, 2019-2031
- 12.1. Market Analysis, Insights and Forecast - By Country/Sub-region
- 12.1.1. undefined
- 13. Asia Pacific Orthopedic Trauma Devices Industry Analysis, Insights and Forecast, 2019-2031
- 13.1. Market Analysis, Insights and Forecast - By Country/Sub-region
- 13.1.1. undefined
- 14. Middle East and Africa Orthopedic Trauma Devices Industry Analysis, Insights and Forecast, 2019-2031
- 14.1. Market Analysis, Insights and Forecast - By Country/Sub-region
- 14.1.1. undefined
- 15. South America Orthopedic Trauma Devices Industry Analysis, Insights and Forecast, 2019-2031
- 15.1. Market Analysis, Insights and Forecast - By Country/Sub-region
- 15.1.1. undefined
- 16. Competitive Analysis
- 16.1. Global Market Share Analysis 2024
- 16.2. Company Profiles
- 16.2.1 Smith & Nephew PLC
- 16.2.1.1. Overview
- 16.2.1.2. Products
- 16.2.1.3. SWOT Analysis
- 16.2.1.4. Recent Developments
- 16.2.1.5. Financials (Based on Availability)
- 16.2.2 Arthrex Inc
- 16.2.2.1. Overview
- 16.2.2.2. Products
- 16.2.2.3. SWOT Analysis
- 16.2.2.4. Recent Developments
- 16.2.2.5. Financials (Based on Availability)
- 16.2.3 Braun Melsungen AG
- 16.2.3.1. Overview
- 16.2.3.2. Products
- 16.2.3.3. SWOT Analysis
- 16.2.3.4. Recent Developments
- 16.2.3.5. Financials (Based on Availability)
- 16.2.4 Invibio Ltd
- 16.2.4.1. Overview
- 16.2.4.2. Products
- 16.2.4.3. SWOT Analysis
- 16.2.4.4. Recent Developments
- 16.2.4.5. Financials (Based on Availability)
- 16.2.5 Cardinal Health Inc
- 16.2.5.1. Overview
- 16.2.5.2. Products
- 16.2.5.3. SWOT Analysis
- 16.2.5.4. Recent Developments
- 16.2.5.5. Financials (Based on Availability)
- 16.2.6 Medtronic PLC
- 16.2.6.1. Overview
- 16.2.6.2. Products
- 16.2.6.3. SWOT Analysis
- 16.2.6.4. Recent Developments
- 16.2.6.5. Financials (Based on Availability)
- 16.2.7 Orthofix Medical Inc
- 16.2.7.1. Overview
- 16.2.7.2. Products
- 16.2.7.3. SWOT Analysis
- 16.2.7.4. Recent Developments
- 16.2.7.5. Financials (Based on Availability)
- 16.2.8 Conmed Corporation
- 16.2.8.1. Overview
- 16.2.8.2. Products
- 16.2.8.3. SWOT Analysis
- 16.2.8.4. Recent Developments
- 16.2.8.5. Financials (Based on Availability)
- 16.2.9 Johnson & Johnson
- 16.2.9.1. Overview
- 16.2.9.2. Products
- 16.2.9.3. SWOT Analysis
- 16.2.9.4. Recent Developments
- 16.2.9.5. Financials (Based on Availability)
- 16.2.10 Stryker Corporation
- 16.2.10.1. Overview
- 16.2.10.2. Products
- 16.2.10.3. SWOT Analysis
- 16.2.10.4. Recent Developments
- 16.2.10.5. Financials (Based on Availability)
- 16.2.11 Zimmer Biomet
- 16.2.11.1. Overview
- 16.2.11.2. Products
- 16.2.11.3. SWOT Analysis
- 16.2.11.4. Recent Developments
- 16.2.11.5. Financials (Based on Availability)
- 16.2.1 Smith & Nephew PLC
List of Figures
- Figure 1: Global Orthopedic Trauma Devices Industry Revenue Breakdown (Million, %) by Region 2024 & 2032
- Figure 2: Global Orthopedic Trauma Devices Industry Volume Breakdown (K Unit, %) by Region 2024 & 2032
- Figure 3: North America Orthopedic Trauma Devices Industry Revenue (Million), by Country 2024 & 2032
- Figure 4: North America Orthopedic Trauma Devices Industry Volume (K Unit), by Country 2024 & 2032
- Figure 5: North America Orthopedic Trauma Devices Industry Revenue Share (%), by Country 2024 & 2032
- Figure 6: North America Orthopedic Trauma Devices Industry Volume Share (%), by Country 2024 & 2032
- Figure 7: Europe Orthopedic Trauma Devices Industry Revenue (Million), by Country 2024 & 2032
- Figure 8: Europe Orthopedic Trauma Devices Industry Volume (K Unit), by Country 2024 & 2032
- Figure 9: Europe Orthopedic Trauma Devices Industry Revenue Share (%), by Country 2024 & 2032
- Figure 10: Europe Orthopedic Trauma Devices Industry Volume Share (%), by Country 2024 & 2032
- Figure 11: Asia Pacific Orthopedic Trauma Devices Industry Revenue (Million), by Country 2024 & 2032
- Figure 12: Asia Pacific Orthopedic Trauma Devices Industry Volume (K Unit), by Country 2024 & 2032
- Figure 13: Asia Pacific Orthopedic Trauma Devices Industry Revenue Share (%), by Country 2024 & 2032
- Figure 14: Asia Pacific Orthopedic Trauma Devices Industry Volume Share (%), by Country 2024 & 2032
- Figure 15: Middle East and Africa Orthopedic Trauma Devices Industry Revenue (Million), by Country 2024 & 2032
- Figure 16: Middle East and Africa Orthopedic Trauma Devices Industry Volume (K Unit), by Country 2024 & 2032
- Figure 17: Middle East and Africa Orthopedic Trauma Devices Industry Revenue Share (%), by Country 2024 & 2032
- Figure 18: Middle East and Africa Orthopedic Trauma Devices Industry Volume Share (%), by Country 2024 & 2032
- Figure 19: South America Orthopedic Trauma Devices Industry Revenue (Million), by Country 2024 & 2032
- Figure 20: South America Orthopedic Trauma Devices Industry Volume (K Unit), by Country 2024 & 2032
- Figure 21: South America Orthopedic Trauma Devices Industry Revenue Share (%), by Country 2024 & 2032
- Figure 22: South America Orthopedic Trauma Devices Industry Volume Share (%), by Country 2024 & 2032
- Figure 23: North America Orthopedic Trauma Devices Industry Revenue (Million), by Type 2024 & 2032
- Figure 24: North America Orthopedic Trauma Devices Industry Volume (K Unit), by Type 2024 & 2032
- Figure 25: North America Orthopedic Trauma Devices Industry Revenue Share (%), by Type 2024 & 2032
- Figure 26: North America Orthopedic Trauma Devices Industry Volume Share (%), by Type 2024 & 2032
- Figure 27: North America Orthopedic Trauma Devices Industry Revenue (Million), by Surgical Site 2024 & 2032
- Figure 28: North America Orthopedic Trauma Devices Industry Volume (K Unit), by Surgical Site 2024 & 2032
- Figure 29: North America Orthopedic Trauma Devices Industry Revenue Share (%), by Surgical Site 2024 & 2032
- Figure 30: North America Orthopedic Trauma Devices Industry Volume Share (%), by Surgical Site 2024 & 2032
- Figure 31: North America Orthopedic Trauma Devices Industry Revenue (Million), by End User 2024 & 2032
- Figure 32: North America Orthopedic Trauma Devices Industry Volume (K Unit), by End User 2024 & 2032
- Figure 33: North America Orthopedic Trauma Devices Industry Revenue Share (%), by End User 2024 & 2032
- Figure 34: North America Orthopedic Trauma Devices Industry Volume Share (%), by End User 2024 & 2032
- Figure 35: North America Orthopedic Trauma Devices Industry Revenue (Million), by Country 2024 & 2032
- Figure 36: North America Orthopedic Trauma Devices Industry Volume (K Unit), by Country 2024 & 2032
- Figure 37: North America Orthopedic Trauma Devices Industry Revenue Share (%), by Country 2024 & 2032
- Figure 38: North America Orthopedic Trauma Devices Industry Volume Share (%), by Country 2024 & 2032
- Figure 39: Europe Orthopedic Trauma Devices Industry Revenue (Million), by Type 2024 & 2032
- Figure 40: Europe Orthopedic Trauma Devices Industry Volume (K Unit), by Type 2024 & 2032
- Figure 41: Europe Orthopedic Trauma Devices Industry Revenue Share (%), by Type 2024 & 2032
- Figure 42: Europe Orthopedic Trauma Devices Industry Volume Share (%), by Type 2024 & 2032
- Figure 43: Europe Orthopedic Trauma Devices Industry Revenue (Million), by Surgical Site 2024 & 2032
- Figure 44: Europe Orthopedic Trauma Devices Industry Volume (K Unit), by Surgical Site 2024 & 2032
- Figure 45: Europe Orthopedic Trauma Devices Industry Revenue Share (%), by Surgical Site 2024 & 2032
- Figure 46: Europe Orthopedic Trauma Devices Industry Volume Share (%), by Surgical Site 2024 & 2032
- Figure 47: Europe Orthopedic Trauma Devices Industry Revenue (Million), by End User 2024 & 2032
- Figure 48: Europe Orthopedic Trauma Devices Industry Volume (K Unit), by End User 2024 & 2032
- Figure 49: Europe Orthopedic Trauma Devices Industry Revenue Share (%), by End User 2024 & 2032
- Figure 50: Europe Orthopedic Trauma Devices Industry Volume Share (%), by End User 2024 & 2032
- Figure 51: Europe Orthopedic Trauma Devices Industry Revenue (Million), by Country 2024 & 2032
- Figure 52: Europe Orthopedic Trauma Devices Industry Volume (K Unit), by Country 2024 & 2032
- Figure 53: Europe Orthopedic Trauma Devices Industry Revenue Share (%), by Country 2024 & 2032
- Figure 54: Europe Orthopedic Trauma Devices Industry Volume Share (%), by Country 2024 & 2032
- Figure 55: Asia Pacific Orthopedic Trauma Devices Industry Revenue (Million), by Type 2024 & 2032
- Figure 56: Asia Pacific Orthopedic Trauma Devices Industry Volume (K Unit), by Type 2024 & 2032
- Figure 57: Asia Pacific Orthopedic Trauma Devices Industry Revenue Share (%), by Type 2024 & 2032
- Figure 58: Asia Pacific Orthopedic Trauma Devices Industry Volume Share (%), by Type 2024 & 2032
- Figure 59: Asia Pacific Orthopedic Trauma Devices Industry Revenue (Million), by Surgical Site 2024 & 2032
- Figure 60: Asia Pacific Orthopedic Trauma Devices Industry Volume (K Unit), by Surgical Site 2024 & 2032
- Figure 61: Asia Pacific Orthopedic Trauma Devices Industry Revenue Share (%), by Surgical Site 2024 & 2032
- Figure 62: Asia Pacific Orthopedic Trauma Devices Industry Volume Share (%), by Surgical Site 2024 & 2032
- Figure 63: Asia Pacific Orthopedic Trauma Devices Industry Revenue (Million), by End User 2024 & 2032
- Figure 64: Asia Pacific Orthopedic Trauma Devices Industry Volume (K Unit), by End User 2024 & 2032
- Figure 65: Asia Pacific Orthopedic Trauma Devices Industry Revenue Share (%), by End User 2024 & 2032
- Figure 66: Asia Pacific Orthopedic Trauma Devices Industry Volume Share (%), by End User 2024 & 2032
- Figure 67: Asia Pacific Orthopedic Trauma Devices Industry Revenue (Million), by Country 2024 & 2032
- Figure 68: Asia Pacific Orthopedic Trauma Devices Industry Volume (K Unit), by Country 2024 & 2032
- Figure 69: Asia Pacific Orthopedic Trauma Devices Industry Revenue Share (%), by Country 2024 & 2032
- Figure 70: Asia Pacific Orthopedic Trauma Devices Industry Volume Share (%), by Country 2024 & 2032
- Figure 71: Middle East and Africa Orthopedic Trauma Devices Industry Revenue (Million), by Type 2024 & 2032
- Figure 72: Middle East and Africa Orthopedic Trauma Devices Industry Volume (K Unit), by Type 2024 & 2032
- Figure 73: Middle East and Africa Orthopedic Trauma Devices Industry Revenue Share (%), by Type 2024 & 2032
- Figure 74: Middle East and Africa Orthopedic Trauma Devices Industry Volume Share (%), by Type 2024 & 2032
- Figure 75: Middle East and Africa Orthopedic Trauma Devices Industry Revenue (Million), by Surgical Site 2024 & 2032
- Figure 76: Middle East and Africa Orthopedic Trauma Devices Industry Volume (K Unit), by Surgical Site 2024 & 2032
- Figure 77: Middle East and Africa Orthopedic Trauma Devices Industry Revenue Share (%), by Surgical Site 2024 & 2032
- Figure 78: Middle East and Africa Orthopedic Trauma Devices Industry Volume Share (%), by Surgical Site 2024 & 2032
- Figure 79: Middle East and Africa Orthopedic Trauma Devices Industry Revenue (Million), by End User 2024 & 2032
- Figure 80: Middle East and Africa Orthopedic Trauma Devices Industry Volume (K Unit), by End User 2024 & 2032
- Figure 81: Middle East and Africa Orthopedic Trauma Devices Industry Revenue Share (%), by End User 2024 & 2032
- Figure 82: Middle East and Africa Orthopedic Trauma Devices Industry Volume Share (%), by End User 2024 & 2032
- Figure 83: Middle East and Africa Orthopedic Trauma Devices Industry Revenue (Million), by Country 2024 & 2032
- Figure 84: Middle East and Africa Orthopedic Trauma Devices Industry Volume (K Unit), by Country 2024 & 2032
- Figure 85: Middle East and Africa Orthopedic Trauma Devices Industry Revenue Share (%), by Country 2024 & 2032
- Figure 86: Middle East and Africa Orthopedic Trauma Devices Industry Volume Share (%), by Country 2024 & 2032
- Figure 87: South America Orthopedic Trauma Devices Industry Revenue (Million), by Type 2024 & 2032
- Figure 88: South America Orthopedic Trauma Devices Industry Volume (K Unit), by Type 2024 & 2032
- Figure 89: South America Orthopedic Trauma Devices Industry Revenue Share (%), by Type 2024 & 2032
- Figure 90: South America Orthopedic Trauma Devices Industry Volume Share (%), by Type 2024 & 2032
- Figure 91: South America Orthopedic Trauma Devices Industry Revenue (Million), by Surgical Site 2024 & 2032
- Figure 92: South America Orthopedic Trauma Devices Industry Volume (K Unit), by Surgical Site 2024 & 2032
- Figure 93: South America Orthopedic Trauma Devices Industry Revenue Share (%), by Surgical Site 2024 & 2032
- Figure 94: South America Orthopedic Trauma Devices Industry Volume Share (%), by Surgical Site 2024 & 2032
- Figure 95: South America Orthopedic Trauma Devices Industry Revenue (Million), by End User 2024 & 2032
- Figure 96: South America Orthopedic Trauma Devices Industry Volume (K Unit), by End User 2024 & 2032
- Figure 97: South America Orthopedic Trauma Devices Industry Revenue Share (%), by End User 2024 & 2032
- Figure 98: South America Orthopedic Trauma Devices Industry Volume Share (%), by End User 2024 & 2032
- Figure 99: South America Orthopedic Trauma Devices Industry Revenue (Million), by Country 2024 & 2032
- Figure 100: South America Orthopedic Trauma Devices Industry Volume (K Unit), by Country 2024 & 2032
- Figure 101: South America Orthopedic Trauma Devices Industry Revenue Share (%), by Country 2024 & 2032
- Figure 102: South America Orthopedic Trauma Devices Industry Volume Share (%), by Country 2024 & 2032
List of Tables
- Table 1: Global Orthopedic Trauma Devices Industry Revenue Million Forecast, by Region 2019 & 2032
- Table 2: Global Orthopedic Trauma Devices Industry Volume K Unit Forecast, by Region 2019 & 2032
- Table 3: Global Orthopedic Trauma Devices Industry Revenue Million Forecast, by Type 2019 & 2032
- Table 4: Global Orthopedic Trauma Devices Industry Volume K Unit Forecast, by Type 2019 & 2032
- Table 5: Global Orthopedic Trauma Devices Industry Revenue Million Forecast, by Surgical Site 2019 & 2032
- Table 6: Global Orthopedic Trauma Devices Industry Volume K Unit Forecast, by Surgical Site 2019 & 2032
- Table 7: Global Orthopedic Trauma Devices Industry Revenue Million Forecast, by End User 2019 & 2032
- Table 8: Global Orthopedic Trauma Devices Industry Volume K Unit Forecast, by End User 2019 & 2032
- Table 9: Global Orthopedic Trauma Devices Industry Revenue Million Forecast, by Region 2019 & 2032
- Table 10: Global Orthopedic Trauma Devices Industry Volume K Unit Forecast, by Region 2019 & 2032
- Table 11: Global Orthopedic Trauma Devices Industry Revenue Million Forecast, by Country 2019 & 2032
- Table 12: Global Orthopedic Trauma Devices Industry Volume K Unit Forecast, by Country 2019 & 2032
- Table 13: Global Orthopedic Trauma Devices Industry Revenue Million Forecast, by Country 2019 & 2032
- Table 14: Global Orthopedic Trauma Devices Industry Volume K Unit Forecast, by Country 2019 & 2032
- Table 15: Global Orthopedic Trauma Devices Industry Revenue Million Forecast, by Country 2019 & 2032
- Table 16: Global Orthopedic Trauma Devices Industry Volume K Unit Forecast, by Country 2019 & 2032
- Table 17: Global Orthopedic Trauma Devices Industry Revenue Million Forecast, by Country 2019 & 2032
- Table 18: Global Orthopedic Trauma Devices Industry Volume K Unit Forecast, by Country 2019 & 2032
- Table 19: Global Orthopedic Trauma Devices Industry Revenue Million Forecast, by Country 2019 & 2032
- Table 20: Global Orthopedic Trauma Devices Industry Volume K Unit Forecast, by Country 2019 & 2032
- Table 21: Global Orthopedic Trauma Devices Industry Revenue Million Forecast, by Type 2019 & 2032
- Table 22: Global Orthopedic Trauma Devices Industry Volume K Unit Forecast, by Type 2019 & 2032
- Table 23: Global Orthopedic Trauma Devices Industry Revenue Million Forecast, by Surgical Site 2019 & 2032
- Table 24: Global Orthopedic Trauma Devices Industry Volume K Unit Forecast, by Surgical Site 2019 & 2032
- Table 25: Global Orthopedic Trauma Devices Industry Revenue Million Forecast, by End User 2019 & 2032
- Table 26: Global Orthopedic Trauma Devices Industry Volume K Unit Forecast, by End User 2019 & 2032
- Table 27: Global Orthopedic Trauma Devices Industry Revenue Million Forecast, by Country 2019 & 2032
- Table 28: Global Orthopedic Trauma Devices Industry Volume K Unit Forecast, by Country 2019 & 2032
- Table 29: United States Orthopedic Trauma Devices Industry Revenue (Million) Forecast, by Application 2019 & 2032
- Table 30: United States Orthopedic Trauma Devices Industry Volume (K Unit) Forecast, by Application 2019 & 2032
- Table 31: Canada Orthopedic Trauma Devices Industry Revenue (Million) Forecast, by Application 2019 & 2032
- Table 32: Canada Orthopedic Trauma Devices Industry Volume (K Unit) Forecast, by Application 2019 & 2032
- Table 33: Mexico Orthopedic Trauma Devices Industry Revenue (Million) Forecast, by Application 2019 & 2032
- Table 34: Mexico Orthopedic Trauma Devices Industry Volume (K Unit) Forecast, by Application 2019 & 2032
- Table 35: Global Orthopedic Trauma Devices Industry Revenue Million Forecast, by Type 2019 & 2032
- Table 36: Global Orthopedic Trauma Devices Industry Volume K Unit Forecast, by Type 2019 & 2032
- Table 37: Global Orthopedic Trauma Devices Industry Revenue Million Forecast, by Surgical Site 2019 & 2032
- Table 38: Global Orthopedic Trauma Devices Industry Volume K Unit Forecast, by Surgical Site 2019 & 2032
- Table 39: Global Orthopedic Trauma Devices Industry Revenue Million Forecast, by End User 2019 & 2032
- Table 40: Global Orthopedic Trauma Devices Industry Volume K Unit Forecast, by End User 2019 & 2032
- Table 41: Global Orthopedic Trauma Devices Industry Revenue Million Forecast, by Country 2019 & 2032
- Table 42: Global Orthopedic Trauma Devices Industry Volume K Unit Forecast, by Country 2019 & 2032
- Table 43: Germany Orthopedic Trauma Devices Industry Revenue (Million) Forecast, by Application 2019 & 2032
- Table 44: Germany Orthopedic Trauma Devices Industry Volume (K Unit) Forecast, by Application 2019 & 2032
- Table 45: United Kingdom Orthopedic Trauma Devices Industry Revenue (Million) Forecast, by Application 2019 & 2032
- Table 46: United Kingdom Orthopedic Trauma Devices Industry Volume (K Unit) Forecast, by Application 2019 & 2032
- Table 47: France Orthopedic Trauma Devices Industry Revenue (Million) Forecast, by Application 2019 & 2032
- Table 48: France Orthopedic Trauma Devices Industry Volume (K Unit) Forecast, by Application 2019 & 2032
- Table 49: Italy Orthopedic Trauma Devices Industry Revenue (Million) Forecast, by Application 2019 & 2032
- Table 50: Italy Orthopedic Trauma Devices Industry Volume (K Unit) Forecast, by Application 2019 & 2032
- Table 51: Spain Orthopedic Trauma Devices Industry Revenue (Million) Forecast, by Application 2019 & 2032
- Table 52: Spain Orthopedic Trauma Devices Industry Volume (K Unit) Forecast, by Application 2019 & 2032
- Table 53: Rest of Europe Orthopedic Trauma Devices Industry Revenue (Million) Forecast, by Application 2019 & 2032
- Table 54: Rest of Europe Orthopedic Trauma Devices Industry Volume (K Unit) Forecast, by Application 2019 & 2032
- Table 55: Global Orthopedic Trauma Devices Industry Revenue Million Forecast, by Type 2019 & 2032
- Table 56: Global Orthopedic Trauma Devices Industry Volume K Unit Forecast, by Type 2019 & 2032
- Table 57: Global Orthopedic Trauma Devices Industry Revenue Million Forecast, by Surgical Site 2019 & 2032
- Table 58: Global Orthopedic Trauma Devices Industry Volume K Unit Forecast, by Surgical Site 2019 & 2032
- Table 59: Global Orthopedic Trauma Devices Industry Revenue Million Forecast, by End User 2019 & 2032
- Table 60: Global Orthopedic Trauma Devices Industry Volume K Unit Forecast, by End User 2019 & 2032
- Table 61: Global Orthopedic Trauma Devices Industry Revenue Million Forecast, by Country 2019 & 2032
- Table 62: Global Orthopedic Trauma Devices Industry Volume K Unit Forecast, by Country 2019 & 2032
- Table 63: China Orthopedic Trauma Devices Industry Revenue (Million) Forecast, by Application 2019 & 2032
- Table 64: China Orthopedic Trauma Devices Industry Volume (K Unit) Forecast, by Application 2019 & 2032
- Table 65: Japan Orthopedic Trauma Devices Industry Revenue (Million) Forecast, by Application 2019 & 2032
- Table 66: Japan Orthopedic Trauma Devices Industry Volume (K Unit) Forecast, by Application 2019 & 2032
- Table 67: India Orthopedic Trauma Devices Industry Revenue (Million) Forecast, by Application 2019 & 2032
- Table 68: India Orthopedic Trauma Devices Industry Volume (K Unit) Forecast, by Application 2019 & 2032
- Table 69: Australia Orthopedic Trauma Devices Industry Revenue (Million) Forecast, by Application 2019 & 2032
- Table 70: Australia Orthopedic Trauma Devices Industry Volume (K Unit) Forecast, by Application 2019 & 2032
- Table 71: South Korea Orthopedic Trauma Devices Industry Revenue (Million) Forecast, by Application 2019 & 2032
- Table 72: South Korea Orthopedic Trauma Devices Industry Volume (K Unit) Forecast, by Application 2019 & 2032
- Table 73: Rest of Asia Pacific Orthopedic Trauma Devices Industry Revenue (Million) Forecast, by Application 2019 & 2032
- Table 74: Rest of Asia Pacific Orthopedic Trauma Devices Industry Volume (K Unit) Forecast, by Application 2019 & 2032
- Table 75: Global Orthopedic Trauma Devices Industry Revenue Million Forecast, by Type 2019 & 2032
- Table 76: Global Orthopedic Trauma Devices Industry Volume K Unit Forecast, by Type 2019 & 2032
- Table 77: Global Orthopedic Trauma Devices Industry Revenue Million Forecast, by Surgical Site 2019 & 2032
- Table 78: Global Orthopedic Trauma Devices Industry Volume K Unit Forecast, by Surgical Site 2019 & 2032
- Table 79: Global Orthopedic Trauma Devices Industry Revenue Million Forecast, by End User 2019 & 2032
- Table 80: Global Orthopedic Trauma Devices Industry Volume K Unit Forecast, by End User 2019 & 2032
- Table 81: Global Orthopedic Trauma Devices Industry Revenue Million Forecast, by Country 2019 & 2032
- Table 82: Global Orthopedic Trauma Devices Industry Volume K Unit Forecast, by Country 2019 & 2032
- Table 83: GCC Orthopedic Trauma Devices Industry Revenue (Million) Forecast, by Application 2019 & 2032
- Table 84: GCC Orthopedic Trauma Devices Industry Volume (K Unit) Forecast, by Application 2019 & 2032
- Table 85: South Africa Orthopedic Trauma Devices Industry Revenue (Million) Forecast, by Application 2019 & 2032
- Table 86: South Africa Orthopedic Trauma Devices Industry Volume (K Unit) Forecast, by Application 2019 & 2032
- Table 87: Rest of Middle East and Africa Orthopedic Trauma Devices Industry Revenue (Million) Forecast, by Application 2019 & 2032
- Table 88: Rest of Middle East and Africa Orthopedic Trauma Devices Industry Volume (K Unit) Forecast, by Application 2019 & 2032
- Table 89: Global Orthopedic Trauma Devices Industry Revenue Million Forecast, by Type 2019 & 2032
- Table 90: Global Orthopedic Trauma Devices Industry Volume K Unit Forecast, by Type 2019 & 2032
- Table 91: Global Orthopedic Trauma Devices Industry Revenue Million Forecast, by Surgical Site 2019 & 2032
- Table 92: Global Orthopedic Trauma Devices Industry Volume K Unit Forecast, by Surgical Site 2019 & 2032
- Table 93: Global Orthopedic Trauma Devices Industry Revenue Million Forecast, by End User 2019 & 2032
- Table 94: Global Orthopedic Trauma Devices Industry Volume K Unit Forecast, by End User 2019 & 2032
- Table 95: Global Orthopedic Trauma Devices Industry Revenue Million Forecast, by Country 2019 & 2032
- Table 96: Global Orthopedic Trauma Devices Industry Volume K Unit Forecast, by Country 2019 & 2032
- Table 97: Brazil Orthopedic Trauma Devices Industry Revenue (Million) Forecast, by Application 2019 & 2032
- Table 98: Brazil Orthopedic Trauma Devices Industry Volume (K Unit) Forecast, by Application 2019 & 2032
- Table 99: Argentina Orthopedic Trauma Devices Industry Revenue (Million) Forecast, by Application 2019 & 2032
- Table 100: Argentina Orthopedic Trauma Devices Industry Volume (K Unit) Forecast, by Application 2019 & 2032
- Table 101: Rest of South America Orthopedic Trauma Devices Industry Revenue (Million) Forecast, by Application 2019 & 2032
- Table 102: Rest of South America Orthopedic Trauma Devices Industry Volume (K Unit) Forecast, by Application 2019 & 2032
Frequently Asked Questions
1. What is the projected Compound Annual Growth Rate (CAGR) of the Orthopedic Trauma Devices Industry?
The projected CAGR is approximately 6.50%.
2. Which companies are prominent players in the Orthopedic Trauma Devices Industry?
Key companies in the market include Smith & Nephew PLC, Arthrex Inc, Braun Melsungen AG, Invibio Ltd, Cardinal Health Inc, Medtronic PLC, Orthofix Medical Inc, Conmed Corporation, Johnson & Johnson, Stryker Corporation, Zimmer Biomet.
3. What are the main segments of the Orthopedic Trauma Devices Industry?
The market segments include Type, Surgical Site, End User.
4. Can you provide details about the market size?
The market size is estimated to be USD XX Million as of 2022.
5. What are some drivers contributing to market growth?
Growing Burden of Bone Degenerative Diseases; Increasing Number of Road Accidents; Technological Advancements in Medical Devices.
6. What are the notable trends driving market growth?
Circular Fixators Segment is Expected to Hold a Major Share in the Trauma Fixation Devices Market.
7. Are there any restraints impacting market growth?
Lack of Trained Professionals; Stringent Regulatory Issues.
8. Can you provide examples of recent developments in the market?
In October 2020, DePuy Synthes (Johnson & Johnson) introduced the 'FIBULINK Syndesmosis Repair System' in the United States. The device is designed to address traumatic injuries to the syndesmosis.
9. What pricing options are available for accessing the report?
Pricing options include single-user, multi-user, and enterprise licenses priced at USD 4750, USD 5250, and USD 8750 respectively.
10. Is the market size provided in terms of value or volume?
The market size is provided in terms of value, measured in Million and volume, measured in K Unit.
11. Are there any specific market keywords associated with the report?
Yes, the market keyword associated with the report is "Orthopedic Trauma Devices Industry," which aids in identifying and referencing the specific market segment covered.
12. How do I determine which pricing option suits my needs best?
The pricing options vary based on user requirements and access needs. Individual users may opt for single-user licenses, while businesses requiring broader access may choose multi-user or enterprise licenses for cost-effective access to the report.
13. Are there any additional resources or data provided in the Orthopedic Trauma Devices Industry report?
While the report offers comprehensive insights, it's advisable to review the specific contents or supplementary materials provided to ascertain if additional resources or data are available.
14. How can I stay updated on further developments or reports in the Orthopedic Trauma Devices Industry?
To stay informed about further developments, trends, and reports in the Orthopedic Trauma Devices Industry, consider subscribing to industry newsletters, following relevant companies and organizations, or regularly checking reputable industry news sources and publications.
Methodology
Step 1 - Identification of Relevant Samples Size from Population Database


Step 2 - Approaches for Defining Global Market Size (Value, Volume* & Price*)

Note*: In applicable scenarios
Step 3 - Data Sources
Primary Research
- Web Analytics
- Survey Reports
- Research Institute
- Latest Research Reports
- Opinion Leaders
Secondary Research
- Annual Reports
- White Paper
- Latest Press Release
- Industry Association
- Paid Database
- Investor Presentations

Step 4 - Data Triangulation
Involves using different sources of information in order to increase the validity of a study
These sources are likely to be stakeholders in a program - participants, other researchers, program staff, other community members, and so on.
Then we put all data in single framework & apply various statistical tools to find out the dynamic on the market.
During the analysis stage, feedback from the stakeholder groups would be compared to determine areas of agreement as well as areas of divergence
