

Key Insights
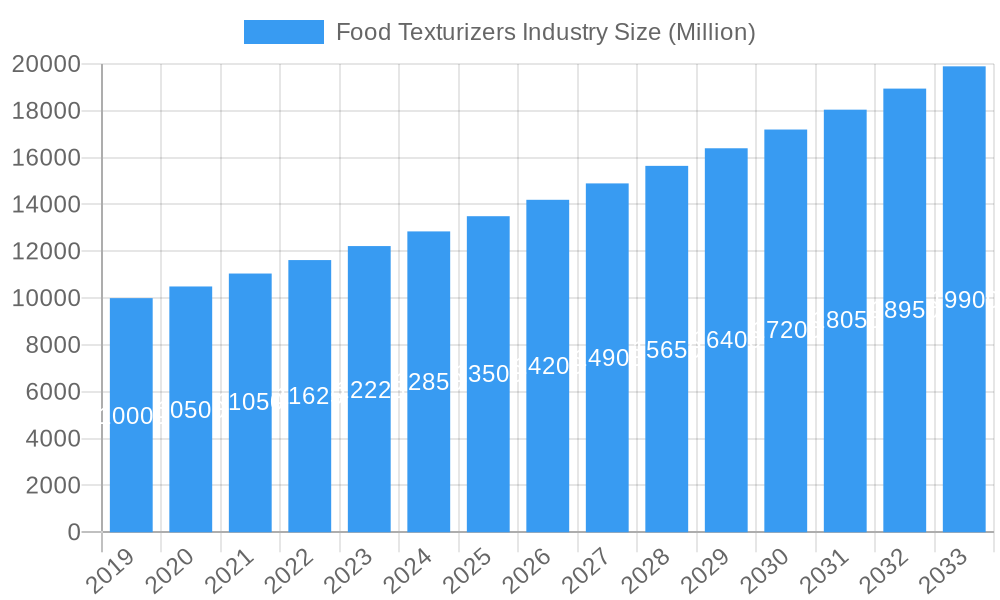
The global Food Texturizers market is poised for robust growth, estimated at USD 12,500 million in 2025, with a projected Compound Annual Growth Rate (CAGR) of 5.10% through 2033. This expansion is primarily fueled by a confluence of escalating consumer demand for processed and convenience foods, a growing awareness of the role of texture in sensory appeal, and significant advancements in texturizer technology. The increasing preference for clean-label ingredients and natural texturizers like cellulose derivatives, gums, pectins, and starches is a prominent trend. These ingredients are instrumental in enhancing mouthfeel, viscosity, emulsification, and stability in a wide array of food products. The dairy and ice cream segment, confectionery, and bakery industries represent major application areas, driven by product innovation and the quest for improved consumer experience. Furthermore, the burgeoning demand for plant-based alternatives and the need for effective texturizing agents in these novel food formulations are also contributing to market buoyancy. Emerging economies, particularly in the Asia Pacific region, are expected to witness substantial growth due to rapid urbanization, rising disposable incomes, and evolving dietary habits.
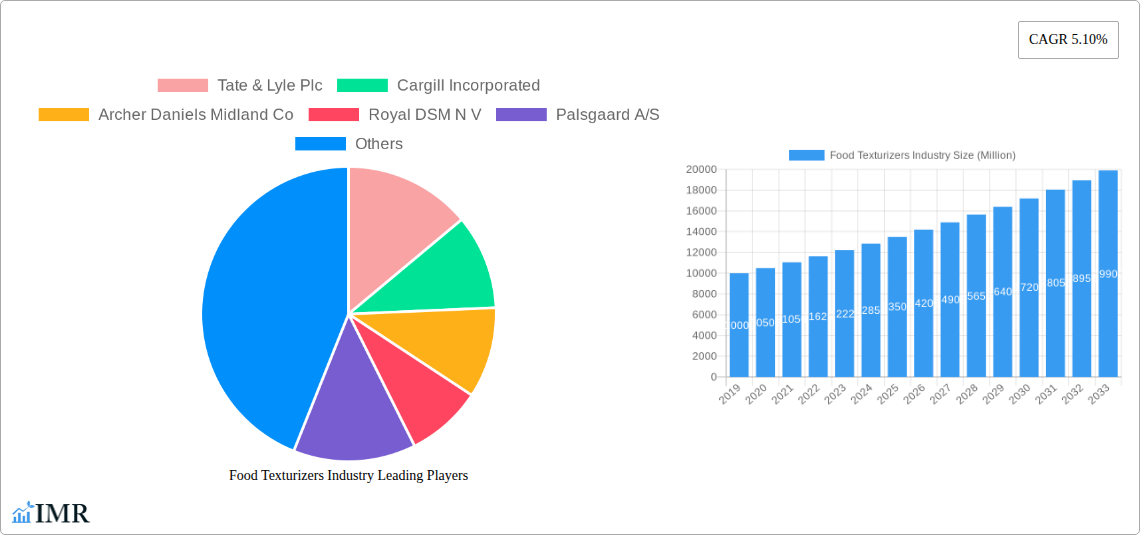
Food Texturizers Industry Market Size (In Billion)
Despite the promising outlook, the market faces certain restraints. The volatile pricing of raw materials, particularly for natural texturizers, can impact profit margins for manufacturers. Stringent regulatory landscapes in different regions regarding food additives and the cost associated with obtaining approvals can also pose challenges. Moreover, the development of innovative and cost-effective texturizing solutions by key players like Tate & Lyle Plc, Cargill Incorporated, and Archer Daniels Midland Co, alongside intense competition, necessitates continuous investment in research and development. The market is also witnessing a rise in demand for customized texturizer blends to achieve specific textural properties, indicating a shift towards more specialized solutions. The forecast period is expected to see continued innovation, focusing on functional benefits beyond texture, such as improved shelf-life and nutritional enhancement, further solidifying the importance of food texturizers in the modern food industry.
Food Texturizers Industry Company Market Share
Unlock critical insights into the global food texturizers market with this comprehensive report. Delve into the evolving landscape of ingredients that define the sensory experience of food and beverages, from creamy dairy products and chewy confectionery to stable baked goods and rich sauces. This report provides an in-depth analysis of market dynamics, growth trends, regional dominance, product innovation, key drivers, challenges, and emerging opportunities within the food additives and hydrocolloids sectors. With a detailed forecast period from 2025 to 2033, and a base year of 2025, this study is essential for stakeholders seeking to navigate the competitive food ingredients market.
Food Texturizers Industry Market Dynamics & Structure
The global food texturizers industry is characterized by a dynamic interplay of technological advancements, evolving consumer preferences for clean labels and natural ingredients, and stringent regulatory frameworks governing food safety and labeling. Market concentration varies across segments, with established players holding significant shares in broad categories like starch and gums, while niche areas see emerging innovation. Technological innovation is driven by the demand for enhanced product performance, cost-effectiveness, and the development of novel texturizing functionalities. The competitive landscape includes direct substitutes such as modified starches, natural gums (e.g., xanthan gum, guar gum), and protein-based texturizers.
- Market Concentration: Moderate to high in dominant segments like starch and cellulose derivatives, with increasing fragmentation in specialized areas.
- Technological Innovation: Driven by demand for clean-label solutions, cost optimization, and unique textural properties.
- Regulatory Frameworks: Stringent food safety standards and labeling requirements influence product development and market entry.
- Competitive Product Substitutes: Modified starches, natural gums, pectin, gelatin, and protein isolates offer functional alternatives.
- End-User Demographics: Growing demand from health-conscious consumers, convenience-seeking individuals, and evolving dietary needs.
- M&A Trends: Strategic acquisitions and partnerships aimed at expanding product portfolios, enhancing R&D capabilities, and gaining market access.
- Innovation Barriers: High R&D costs, lengthy regulatory approval processes, and the need for consumer acceptance of novel ingredients.
Food Texturizers Industry Growth Trends & Insights
The food texturizers market is experiencing robust growth, propelled by several interconnected trends that are reshaping the food and beverage industry. The increasing global population, coupled with rising disposable incomes in emerging economies, is fueling demand for processed and convenience foods, which heavily rely on texturizers to achieve desired consistency, mouthfeel, and stability. Consumer demand for products with "clean labels" – fewer artificial ingredients and more recognizable components – is driving innovation in natural and plant-based texturizers. This shift is supported by technological advancements in extraction, modification, and formulation of these ingredients.
The growth in the dairy products & ice creams segment, particularly for premium and indulgent options, is a significant contributor. Similarly, the confectionery and bakery sectors continue to be strong markets for texturizers, catering to evolving taste preferences and product formats. The ready meals and sauces segments are also expanding as consumers seek convenient and high-quality meal solutions. Key market disruptions include the development of novel texturizing agents that mimic the properties of traditional ingredients but offer improved nutritional profiles or sustainability benefits. The CAGR for the food texturizers market is predicted to be 6.2% from 2025 to 2033, reflecting sustained expansion.
Dominant Regions, Countries, or Segments in Food Texturizers Industry
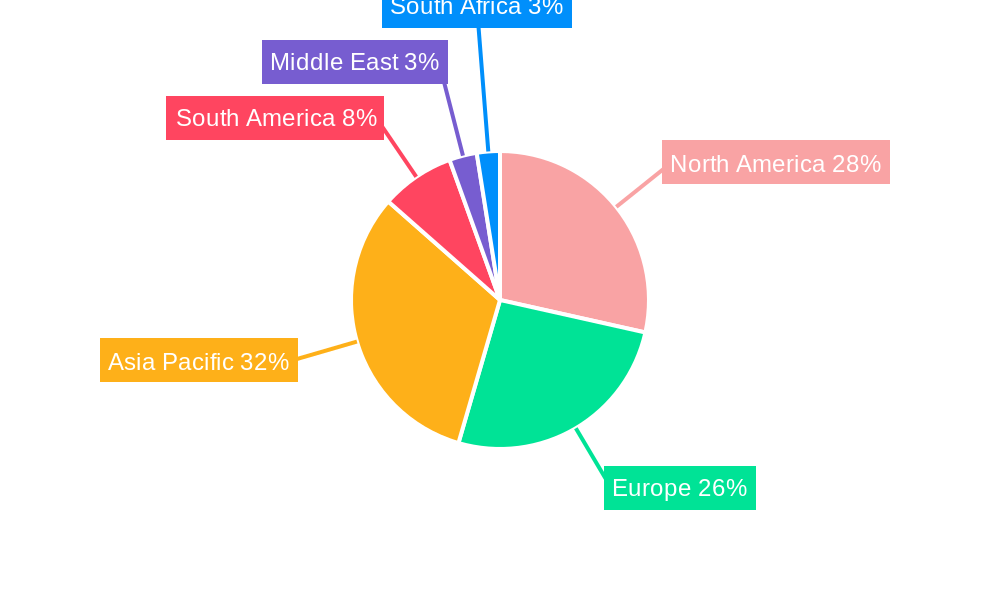
North America, particularly the United States, currently stands as the dominant region in the global food texturizers market. This leadership is attributed to a combination of factors, including a mature food processing industry, high consumer spending on processed foods and beverages, and significant investment in research and development by leading food ingredient manufacturers. The strong presence of major global players like Cargill Incorporated, Archer Daniels Midland Co., and Ingredion Inc. further solidifies North America's position.
Within North America, the Dairy Products & Ice Creams application segment is a primary driver of demand for food texturizers. The region's consumers have a high appetite for a wide variety of dairy-based products, including yogurts, cheeses, ice creams, and frozen desserts, all of which require texturizers for optimal texture, stability, and shelf life. Cellulose derivatives and gums are particularly crucial in this segment, providing emulsification, stabilization, and desired viscosity.
- Leading Region: North America
- Key Countries: United States, Canada
- Dominance Factors:
- Well-established food processing infrastructure.
- High consumer demand for processed and convenience foods.
- Significant R&D investment by global food ingredient companies.
- Strong presence of major food texturizer manufacturers.
- Leading Application Segment: Dairy Products & Ice Creams
- Key Drivers:
- Consumer preference for creamy textures and stable frozen products.
- Innovation in low-fat and plant-based dairy alternatives.
- Demand for longer shelf life and improved product integrity.
- Market Share: Estimated 28% of the total food texturizers market in 2025.
- Growth Potential: Continues to grow with new product development and expansion of plant-based dairy alternatives.
- Key Drivers:
- Leading Type Segment: Starch
- Dominance Factors:
- Versatility and cost-effectiveness.
- Wide range of applications across various food categories.
- Continuous innovation in modified starch functionalities.
- Dominance Factors:
Food Texturizers Industry Product Landscape
The food texturizers industry is characterized by continuous product innovation aimed at meeting evolving consumer demands for natural, functional, and clean-label ingredients. Innovations focus on improving emulsification, stabilization, gelling, thickening, and mouthfeel in a wide array of food products. Key developments include the creation of plant-based texturizers that offer comparable performance to animal-derived ingredients, and the refinement of hydrocolloids for enhanced heat stability and shear resistance.
Companies are also developing texturizers with specific health benefits, such as improved fiber content or reduced sugar impact. The performance metrics of these texturizers are rigorously tested for their impact on viscosity, gel strength, water-holding capacity, and sensory attributes, ensuring they deliver superior product quality and consumer satisfaction across applications like dairy, bakery, and confectionery.
Key Drivers, Barriers & Challenges in Food Texturizers Industry
Key Drivers:
- Growing Demand for Processed & Convenience Foods: Increasing urbanization and busy lifestyles drive demand for ready-to-eat meals, snacks, and beverages, necessitating texturizers for quality and appeal.
- Consumer Preference for Natural and Clean-Label Ingredients: A rising trend towards natural, non-GMO, and minimally processed ingredients fuels innovation in plant-based and naturally derived texturizers.
- Technological Advancements: Continuous R&D leads to the development of novel texturizing agents with enhanced functionalities, cost-effectiveness, and improved sustainability profiles.
- Growth in Emerging Markets: Rising disposable incomes and evolving dietary habits in developing economies present significant growth opportunities.
Barriers & Challenges:
- Supply Chain Volatility and Raw Material Costs: Fluctuations in the availability and pricing of key raw materials (e.g., corn, seaweed, fruits) can impact production costs and profit margins.
- Stringent Regulatory Landscape: Navigating complex and evolving food safety regulations across different regions can be time-consuming and costly.
- Consumer Perception and Acceptance: Educating consumers about the benefits and safety of novel texturizing ingredients can be challenging.
- Competition from Alternative Ingredients: The presence of established and emerging alternative ingredients, including natural alternatives and processed starches, creates competitive pressure.
Emerging Opportunities in Food Texturizers Industry
The food texturizers industry is ripe with emerging opportunities. The burgeoning plant-based food market presents a significant avenue for innovation, with demand for texturizers that can replicate the mouthfeel and texture of animal products in vegan alternatives. Growth in functional foods and beverages, incorporating ingredients for enhanced health and wellness, also opens doors for texturizers that can improve palatability and delivery of active compounds.
Furthermore, the demand for sustainable and ethically sourced ingredients is creating opportunities for texturizers derived from by-products or novel renewable sources. The expansion of online grocery platforms and direct-to-consumer food services also creates opportunities for specialized texturizers that enhance the shelf-life and transportability of food products.
Growth Accelerators in the Food Texturizers Industry Industry
Long-term growth in the food texturizers industry is being significantly accelerated by several key factors. Technological breakthroughs in enzyme modification, fermentation, and plant-based protein extraction are enabling the creation of texturizers with superior functionality and cleaner ingredient profiles. Strategic partnerships between ingredient manufacturers and food companies are fostering co-development of innovative products, driving market penetration.
Market expansion strategies, including the focus on emerging economies with growing middle classes and increasing adoption of processed foods, are also crucial. The development of cost-effective and scalable production methods for novel texturizers will further solidify their competitive position and drive broader market adoption.
Key Players Shaping the Food Texturizers Industry Market
- Tate & Lyle Plc
- Cargill Incorporated
- Archer Daniels Midland Co
- Royal DSM N V
- Palsgaard A/S
- Kerry Inc
- Ingredion Inc
- DuPont
- Fiberstar Inc
- Estelle Chemicals Pvt Ltd
Notable Milestones in Food Texturizers Industry Sector
- April 2022: Cargill Salt announced it will invest USD 68 billion in expanding ST. Clair Plant. Investments being made by Cargill will enhance the plant's production capacity through increased automation, new technology, and efficiency improvements. The multi-year improvement project also includes constructing a new 50,000-square-foot evaporation facility to house a state-of-the-art dry processing line expected to reduce waste and increase capacity by up to 40%.
- October 2021: Cargill Incorporated launched SimPure rice flour, a clean-label bulking agent with a taste, texture, and functionality similar to maltodextrin. The company officially unveiled the new ingredient at the SupplySide West trade show. The primary strategy behind this innovation was to expand the company's product portfolio.
In-Depth Food Texturizers Industry Market Outlook
The future outlook for the food texturizers industry is exceptionally promising, driven by sustained global demand for enhanced food products and evolving consumer preferences. Key growth accelerators include continued investment in research and development for innovative, sustainable, and clean-label texturizers, particularly those derived from plant-based sources. Strategic alliances and acquisitions among market players will likely streamline supply chains and expand product portfolios, catering to diverse application needs.
The increasing penetration of processed and convenience foods in emerging economies, coupled with a growing health and wellness consciousness worldwide, presents significant untapped market potential. Companies that can offer cost-effective, high-performance texturizing solutions with clear labeling and demonstrable benefits will be well-positioned to capitalize on these expanding opportunities.
Food Texturizers Industry Segmentation
-
1. Type
- 1.1. Cellulose Derivatives
- 1.2. Gums
- 1.3. Pectins
- 1.4. Gelatins
- 1.5. Starch
- 1.6. Inulin
- 1.7. Dextrins
- 1.8. Other Types
-
2. Application
- 2.1. Dairy Products & Ice Creams
- 2.2. Confectionery
- 2.3. Jams
- 2.4. Layers
- 2.5. Fillings
- 2.6. Bakery
- 2.7. Meat Products
- 2.8. Ready Meals
- 2.9. Sauces
- 2.10. Beverages
- 2.11. Other Applications
Food Texturizers Industry Segmentation By Geography
-
1. North America
- 1.1. United States
- 1.2. Canada
- 1.3. Mexico
- 1.4. Rest of North America
-
2. Europe
- 2.1. United Kingdom
- 2.2. Germany
- 2.3. France
- 2.4. Russia
- 2.5. Italy
- 2.6. Spain
- 2.7. Rest of Europe
-
3. Asia Pacific
- 3.1. India
- 3.2. China
- 3.3. Japan
- 3.4. Australia
- 3.5. Rest of Asia Pacific
-
4. South America
- 4.1. Brazil
- 4.2. Argentina
- 4.3. Rest of South America
- 5. Middle East
-
6. South Africa
- 6.1. Saudi Arabia
- 6.2. Rest of Middle East
Food Texturizers Industry Regional Market Share
Geographic Coverage of Food Texturizers Industry
Food Texturizers Industry REPORT HIGHLIGHTS
| Aspects | Details |
|---|---|
| Study Period | 2020-2034 |
| Base Year | 2025 |
| Estimated Year | 2026 |
| Forecast Period | 2026-2034 |
| Historical Period | 2020-2025 |
| Growth Rate | CAGR of 7.3% from 2020-2034 |
| Segmentation |
|
Table of Contents
- 1. Introduction
- 1.1. Research Scope
- 1.2. Market Segmentation
- 1.3. Research Objective
- 1.4. Definitions and Assumptions
- 2. Executive Summary
- 2.1. Market Snapshot
- 3. Market Dynamics
- 3.1. Market Drivers
- 3.2. Market Restrains
- 3.3. Market Trends
- 3.4. Market Opportunities
- 4. Market Factor Analysis
- 4.1. Porters Five Forces
- 4.1.1. Bargaining Power of Suppliers
- 4.1.2. Bargaining Power of Buyers
- 4.1.3. Threat of New Entrants
- 4.1.4. Threat of Substitutes
- 4.1.5. Competitive Rivalry
- 4.2. PESTEL analysis
- 4.3. BCG Analysis
- 4.3.1. Stars (High Growth, High Market Share)
- 4.3.2. Cash Cows (Low Growth, High Market Share)
- 4.3.3. Question Mark (High Growth, Low Market Share)
- 4.3.4. Dogs (Low Growth, Low Market Share)
- 4.4. Ansoff Matrix Analysis
- 4.5. Supply Chain Analysis
- 4.6. Regulatory Landscape
- 4.7. Current Market Potential and Opportunity Assessment (TAM–SAM–SOM Framework)
- 4.8. IMR Analyst Note
- 4.1. Porters Five Forces
- 5. Market Analysis, Insights and Forecast 2021-2033
- 5.1. Market Analysis, Insights and Forecast - by Type
- 5.1.1. Cellulose Derivatives
- 5.1.2. Gums
- 5.1.3. Pectins
- 5.1.4. Gelatins
- 5.1.5. Starch
- 5.1.6. Inulin
- 5.1.7. Dextrins
- 5.1.8. Other Types
- 5.2. Market Analysis, Insights and Forecast - by Application
- 5.2.1. Dairy Products & Ice Creams
- 5.2.2. Confectionery
- 5.2.3. Jams
- 5.2.4. Layers
- 5.2.5. Fillings
- 5.2.6. Bakery
- 5.2.7. Meat Products
- 5.2.8. Ready Meals
- 5.2.9. Sauces
- 5.2.10. Beverages
- 5.2.11. Other Applications
- 5.3. Market Analysis, Insights and Forecast - by Region
- 5.3.1. North America
- 5.3.2. Europe
- 5.3.3. Asia Pacific
- 5.3.4. South America
- 5.3.5. Middle East
- 5.3.6. South Africa
- 5.1. Market Analysis, Insights and Forecast - by Type
- 6. Global Food Texturizers Industry Analysis, Insights and Forecast, 2021-2033
- 6.1. Market Analysis, Insights and Forecast - by Type
- 6.1.1. Cellulose Derivatives
- 6.1.2. Gums
- 6.1.3. Pectins
- 6.1.4. Gelatins
- 6.1.5. Starch
- 6.1.6. Inulin
- 6.1.7. Dextrins
- 6.1.8. Other Types
- 6.2. Market Analysis, Insights and Forecast - by Application
- 6.2.1. Dairy Products & Ice Creams
- 6.2.2. Confectionery
- 6.2.3. Jams
- 6.2.4. Layers
- 6.2.5. Fillings
- 6.2.6. Bakery
- 6.2.7. Meat Products
- 6.2.8. Ready Meals
- 6.2.9. Sauces
- 6.2.10. Beverages
- 6.2.11. Other Applications
- 6.1. Market Analysis, Insights and Forecast - by Type
- 7. North America Food Texturizers Industry Analysis, Insights and Forecast, 2020-2032
- 7.1. Market Analysis, Insights and Forecast - by Type
- 7.1.1. Cellulose Derivatives
- 7.1.2. Gums
- 7.1.3. Pectins
- 7.1.4. Gelatins
- 7.1.5. Starch
- 7.1.6. Inulin
- 7.1.7. Dextrins
- 7.1.8. Other Types
- 7.2. Market Analysis, Insights and Forecast - by Application
- 7.2.1. Dairy Products & Ice Creams
- 7.2.2. Confectionery
- 7.2.3. Jams
- 7.2.4. Layers
- 7.2.5. Fillings
- 7.2.6. Bakery
- 7.2.7. Meat Products
- 7.2.8. Ready Meals
- 7.2.9. Sauces
- 7.2.10. Beverages
- 7.2.11. Other Applications
- 7.1. Market Analysis, Insights and Forecast - by Type
- 8. Europe Food Texturizers Industry Analysis, Insights and Forecast, 2020-2032
- 8.1. Market Analysis, Insights and Forecast - by Type
- 8.1.1. Cellulose Derivatives
- 8.1.2. Gums
- 8.1.3. Pectins
- 8.1.4. Gelatins
- 8.1.5. Starch
- 8.1.6. Inulin
- 8.1.7. Dextrins
- 8.1.8. Other Types
- 8.2. Market Analysis, Insights and Forecast - by Application
- 8.2.1. Dairy Products & Ice Creams
- 8.2.2. Confectionery
- 8.2.3. Jams
- 8.2.4. Layers
- 8.2.5. Fillings
- 8.2.6. Bakery
- 8.2.7. Meat Products
- 8.2.8. Ready Meals
- 8.2.9. Sauces
- 8.2.10. Beverages
- 8.2.11. Other Applications
- 8.1. Market Analysis, Insights and Forecast - by Type
- 9. Asia Pacific Food Texturizers Industry Analysis, Insights and Forecast, 2020-2032
- 9.1. Market Analysis, Insights and Forecast - by Type
- 9.1.1. Cellulose Derivatives
- 9.1.2. Gums
- 9.1.3. Pectins
- 9.1.4. Gelatins
- 9.1.5. Starch
- 9.1.6. Inulin
- 9.1.7. Dextrins
- 9.1.8. Other Types
- 9.2. Market Analysis, Insights and Forecast - by Application
- 9.2.1. Dairy Products & Ice Creams
- 9.2.2. Confectionery
- 9.2.3. Jams
- 9.2.4. Layers
- 9.2.5. Fillings
- 9.2.6. Bakery
- 9.2.7. Meat Products
- 9.2.8. Ready Meals
- 9.2.9. Sauces
- 9.2.10. Beverages
- 9.2.11. Other Applications
- 9.1. Market Analysis, Insights and Forecast - by Type
- 10. South America Food Texturizers Industry Analysis, Insights and Forecast, 2020-2032
- 10.1. Market Analysis, Insights and Forecast - by Type
- 10.1.1. Cellulose Derivatives
- 10.1.2. Gums
- 10.1.3. Pectins
- 10.1.4. Gelatins
- 10.1.5. Starch
- 10.1.6. Inulin
- 10.1.7. Dextrins
- 10.1.8. Other Types
- 10.2. Market Analysis, Insights and Forecast - by Application
- 10.2.1. Dairy Products & Ice Creams
- 10.2.2. Confectionery
- 10.2.3. Jams
- 10.2.4. Layers
- 10.2.5. Fillings
- 10.2.6. Bakery
- 10.2.7. Meat Products
- 10.2.8. Ready Meals
- 10.2.9. Sauces
- 10.2.10. Beverages
- 10.2.11. Other Applications
- 10.1. Market Analysis, Insights and Forecast - by Type
- 11. Middle East Food Texturizers Industry Analysis, Insights and Forecast, 2020-2032
- 11.1. Market Analysis, Insights and Forecast - by Type
- 11.1.1. Cellulose Derivatives
- 11.1.2. Gums
- 11.1.3. Pectins
- 11.1.4. Gelatins
- 11.1.5. Starch
- 11.1.6. Inulin
- 11.1.7. Dextrins
- 11.1.8. Other Types
- 11.2. Market Analysis, Insights and Forecast - by Application
- 11.2.1. Dairy Products & Ice Creams
- 11.2.2. Confectionery
- 11.2.3. Jams
- 11.2.4. Layers
- 11.2.5. Fillings
- 11.2.6. Bakery
- 11.2.7. Meat Products
- 11.2.8. Ready Meals
- 11.2.9. Sauces
- 11.2.10. Beverages
- 11.2.11. Other Applications
- 11.1. Market Analysis, Insights and Forecast - by Type
- 12. South Africa Food Texturizers Industry Analysis, Insights and Forecast, 2020-2032
- 12.1. Market Analysis, Insights and Forecast - by Type
- 12.1.1. Cellulose Derivatives
- 12.1.2. Gums
- 12.1.3. Pectins
- 12.1.4. Gelatins
- 12.1.5. Starch
- 12.1.6. Inulin
- 12.1.7. Dextrins
- 12.1.8. Other Types
- 12.2. Market Analysis, Insights and Forecast - by Application
- 12.2.1. Dairy Products & Ice Creams
- 12.2.2. Confectionery
- 12.2.3. Jams
- 12.2.4. Layers
- 12.2.5. Fillings
- 12.2.6. Bakery
- 12.2.7. Meat Products
- 12.2.8. Ready Meals
- 12.2.9. Sauces
- 12.2.10. Beverages
- 12.2.11. Other Applications
- 12.1. Market Analysis, Insights and Forecast - by Type
- 13. Competitive Analysis
- 13.1. Company Profiles
- 13.1.1 Tate & Lyle Plc
- 13.1.1.1. Company Overview
- 13.1.1.2. Products
- 13.1.1.3. Company Financials
- 13.1.1.4. SWOT Analysis
- 13.1.2 Cargill Incorporated
- 13.1.2.1. Company Overview
- 13.1.2.2. Products
- 13.1.2.3. Company Financials
- 13.1.2.4. SWOT Analysis
- 13.1.3 Archer Daniels Midland Co
- 13.1.3.1. Company Overview
- 13.1.3.2. Products
- 13.1.3.3. Company Financials
- 13.1.3.4. SWOT Analysis
- 13.1.4 Royal DSM N V
- 13.1.4.1. Company Overview
- 13.1.4.2. Products
- 13.1.4.3. Company Financials
- 13.1.4.4. SWOT Analysis
- 13.1.5 Palsgaard A/S
- 13.1.5.1. Company Overview
- 13.1.5.2. Products
- 13.1.5.3. Company Financials
- 13.1.5.4. SWOT Analysis
- 13.1.6 Kerry Inc
- 13.1.6.1. Company Overview
- 13.1.6.2. Products
- 13.1.6.3. Company Financials
- 13.1.6.4. SWOT Analysis
- 13.1.7 Ingredion Inc
- 13.1.7.1. Company Overview
- 13.1.7.2. Products
- 13.1.7.3. Company Financials
- 13.1.7.4. SWOT Analysis
- 13.1.8 DuPont
- 13.1.8.1. Company Overview
- 13.1.8.2. Products
- 13.1.8.3. Company Financials
- 13.1.8.4. SWOT Analysis
- 13.1.9 Fiberstar Inc *List Not Exhaustive
- 13.1.9.1. Company Overview
- 13.1.9.2. Products
- 13.1.9.3. Company Financials
- 13.1.9.4. SWOT Analysis
- 13.1.10 Estelle Chemicals Pvt Ltd
- 13.1.10.1. Company Overview
- 13.1.10.2. Products
- 13.1.10.3. Company Financials
- 13.1.10.4. SWOT Analysis
- 13.1.1 Tate & Lyle Plc
- 13.2. Market Entropy
- 13.2.1 Company's Key Areas Served
- 13.2.2 Recent Developments
- 13.3. Company Market Share Analysis 2025
- 13.3.1 Top 5 Companies Market Share Analysis
- 13.3.2 Top 3 Companies Market Share Analysis
- 13.4. List of Potential Customers
- 14. Research Methodology
List of Figures
- Figure 1: Global Food Texturizers Industry Revenue Breakdown (billion, %) by Region 2025 & 2033
- Figure 2: Global Food Texturizers Industry Volume Breakdown (K Tons, %) by Region 2025 & 2033
- Figure 3: North America Food Texturizers Industry Revenue (billion), by Type 2025 & 2033
- Figure 4: North America Food Texturizers Industry Volume (K Tons), by Type 2025 & 2033
- Figure 5: North America Food Texturizers Industry Revenue Share (%), by Type 2025 & 2033
- Figure 6: North America Food Texturizers Industry Volume Share (%), by Type 2025 & 2033
- Figure 7: North America Food Texturizers Industry Revenue (billion), by Application 2025 & 2033
- Figure 8: North America Food Texturizers Industry Volume (K Tons), by Application 2025 & 2033
- Figure 9: North America Food Texturizers Industry Revenue Share (%), by Application 2025 & 2033
- Figure 10: North America Food Texturizers Industry Volume Share (%), by Application 2025 & 2033
- Figure 11: North America Food Texturizers Industry Revenue (billion), by Country 2025 & 2033
- Figure 12: North America Food Texturizers Industry Volume (K Tons), by Country 2025 & 2033
- Figure 13: North America Food Texturizers Industry Revenue Share (%), by Country 2025 & 2033
- Figure 14: North America Food Texturizers Industry Volume Share (%), by Country 2025 & 2033
- Figure 15: Europe Food Texturizers Industry Revenue (billion), by Type 2025 & 2033
- Figure 16: Europe Food Texturizers Industry Volume (K Tons), by Type 2025 & 2033
- Figure 17: Europe Food Texturizers Industry Revenue Share (%), by Type 2025 & 2033
- Figure 18: Europe Food Texturizers Industry Volume Share (%), by Type 2025 & 2033
- Figure 19: Europe Food Texturizers Industry Revenue (billion), by Application 2025 & 2033
- Figure 20: Europe Food Texturizers Industry Volume (K Tons), by Application 2025 & 2033
- Figure 21: Europe Food Texturizers Industry Revenue Share (%), by Application 2025 & 2033
- Figure 22: Europe Food Texturizers Industry Volume Share (%), by Application 2025 & 2033
- Figure 23: Europe Food Texturizers Industry Revenue (billion), by Country 2025 & 2033
- Figure 24: Europe Food Texturizers Industry Volume (K Tons), by Country 2025 & 2033
- Figure 25: Europe Food Texturizers Industry Revenue Share (%), by Country 2025 & 2033
- Figure 26: Europe Food Texturizers Industry Volume Share (%), by Country 2025 & 2033
- Figure 27: Asia Pacific Food Texturizers Industry Revenue (billion), by Type 2025 & 2033
- Figure 28: Asia Pacific Food Texturizers Industry Volume (K Tons), by Type 2025 & 2033
- Figure 29: Asia Pacific Food Texturizers Industry Revenue Share (%), by Type 2025 & 2033
- Figure 30: Asia Pacific Food Texturizers Industry Volume Share (%), by Type 2025 & 2033
- Figure 31: Asia Pacific Food Texturizers Industry Revenue (billion), by Application 2025 & 2033
- Figure 32: Asia Pacific Food Texturizers Industry Volume (K Tons), by Application 2025 & 2033
- Figure 33: Asia Pacific Food Texturizers Industry Revenue Share (%), by Application 2025 & 2033
- Figure 34: Asia Pacific Food Texturizers Industry Volume Share (%), by Application 2025 & 2033
- Figure 35: Asia Pacific Food Texturizers Industry Revenue (billion), by Country 2025 & 2033
- Figure 36: Asia Pacific Food Texturizers Industry Volume (K Tons), by Country 2025 & 2033
- Figure 37: Asia Pacific Food Texturizers Industry Revenue Share (%), by Country 2025 & 2033
- Figure 38: Asia Pacific Food Texturizers Industry Volume Share (%), by Country 2025 & 2033
- Figure 39: South America Food Texturizers Industry Revenue (billion), by Type 2025 & 2033
- Figure 40: South America Food Texturizers Industry Volume (K Tons), by Type 2025 & 2033
- Figure 41: South America Food Texturizers Industry Revenue Share (%), by Type 2025 & 2033
- Figure 42: South America Food Texturizers Industry Volume Share (%), by Type 2025 & 2033
- Figure 43: South America Food Texturizers Industry Revenue (billion), by Application 2025 & 2033
- Figure 44: South America Food Texturizers Industry Volume (K Tons), by Application 2025 & 2033
- Figure 45: South America Food Texturizers Industry Revenue Share (%), by Application 2025 & 2033
- Figure 46: South America Food Texturizers Industry Volume Share (%), by Application 2025 & 2033
- Figure 47: South America Food Texturizers Industry Revenue (billion), by Country 2025 & 2033
- Figure 48: South America Food Texturizers Industry Volume (K Tons), by Country 2025 & 2033
- Figure 49: South America Food Texturizers Industry Revenue Share (%), by Country 2025 & 2033
- Figure 50: South America Food Texturizers Industry Volume Share (%), by Country 2025 & 2033
- Figure 51: Middle East Food Texturizers Industry Revenue (billion), by Type 2025 & 2033
- Figure 52: Middle East Food Texturizers Industry Volume (K Tons), by Type 2025 & 2033
- Figure 53: Middle East Food Texturizers Industry Revenue Share (%), by Type 2025 & 2033
- Figure 54: Middle East Food Texturizers Industry Volume Share (%), by Type 2025 & 2033
- Figure 55: Middle East Food Texturizers Industry Revenue (billion), by Application 2025 & 2033
- Figure 56: Middle East Food Texturizers Industry Volume (K Tons), by Application 2025 & 2033
- Figure 57: Middle East Food Texturizers Industry Revenue Share (%), by Application 2025 & 2033
- Figure 58: Middle East Food Texturizers Industry Volume Share (%), by Application 2025 & 2033
- Figure 59: Middle East Food Texturizers Industry Revenue (billion), by Country 2025 & 2033
- Figure 60: Middle East Food Texturizers Industry Volume (K Tons), by Country 2025 & 2033
- Figure 61: Middle East Food Texturizers Industry Revenue Share (%), by Country 2025 & 2033
- Figure 62: Middle East Food Texturizers Industry Volume Share (%), by Country 2025 & 2033
- Figure 63: South Africa Food Texturizers Industry Revenue (billion), by Type 2025 & 2033
- Figure 64: South Africa Food Texturizers Industry Volume (K Tons), by Type 2025 & 2033
- Figure 65: South Africa Food Texturizers Industry Revenue Share (%), by Type 2025 & 2033
- Figure 66: South Africa Food Texturizers Industry Volume Share (%), by Type 2025 & 2033
- Figure 67: South Africa Food Texturizers Industry Revenue (billion), by Application 2025 & 2033
- Figure 68: South Africa Food Texturizers Industry Volume (K Tons), by Application 2025 & 2033
- Figure 69: South Africa Food Texturizers Industry Revenue Share (%), by Application 2025 & 2033
- Figure 70: South Africa Food Texturizers Industry Volume Share (%), by Application 2025 & 2033
- Figure 71: South Africa Food Texturizers Industry Revenue (billion), by Country 2025 & 2033
- Figure 72: South Africa Food Texturizers Industry Volume (K Tons), by Country 2025 & 2033
- Figure 73: South Africa Food Texturizers Industry Revenue Share (%), by Country 2025 & 2033
- Figure 74: South Africa Food Texturizers Industry Volume Share (%), by Country 2025 & 2033
List of Tables
- Table 1: Global Food Texturizers Industry Revenue billion Forecast, by Type 2020 & 2033
- Table 2: Global Food Texturizers Industry Volume K Tons Forecast, by Type 2020 & 2033
- Table 3: Global Food Texturizers Industry Revenue billion Forecast, by Application 2020 & 2033
- Table 4: Global Food Texturizers Industry Volume K Tons Forecast, by Application 2020 & 2033
- Table 5: Global Food Texturizers Industry Revenue billion Forecast, by Region 2020 & 2033
- Table 6: Global Food Texturizers Industry Volume K Tons Forecast, by Region 2020 & 2033
- Table 7: Global Food Texturizers Industry Revenue billion Forecast, by Type 2020 & 2033
- Table 8: Global Food Texturizers Industry Volume K Tons Forecast, by Type 2020 & 2033
- Table 9: Global Food Texturizers Industry Revenue billion Forecast, by Application 2020 & 2033
- Table 10: Global Food Texturizers Industry Volume K Tons Forecast, by Application 2020 & 2033
- Table 11: Global Food Texturizers Industry Revenue billion Forecast, by Country 2020 & 2033
- Table 12: Global Food Texturizers Industry Volume K Tons Forecast, by Country 2020 & 2033
- Table 13: United States Food Texturizers Industry Revenue (billion) Forecast, by Application 2020 & 2033
- Table 14: United States Food Texturizers Industry Volume (K Tons) Forecast, by Application 2020 & 2033
- Table 15: Canada Food Texturizers Industry Revenue (billion) Forecast, by Application 2020 & 2033
- Table 16: Canada Food Texturizers Industry Volume (K Tons) Forecast, by Application 2020 & 2033
- Table 17: Mexico Food Texturizers Industry Revenue (billion) Forecast, by Application 2020 & 2033
- Table 18: Mexico Food Texturizers Industry Volume (K Tons) Forecast, by Application 2020 & 2033
- Table 19: Rest of North America Food Texturizers Industry Revenue (billion) Forecast, by Application 2020 & 2033
- Table 20: Rest of North America Food Texturizers Industry Volume (K Tons) Forecast, by Application 2020 & 2033
- Table 21: Global Food Texturizers Industry Revenue billion Forecast, by Type 2020 & 2033
- Table 22: Global Food Texturizers Industry Volume K Tons Forecast, by Type 2020 & 2033
- Table 23: Global Food Texturizers Industry Revenue billion Forecast, by Application 2020 & 2033
- Table 24: Global Food Texturizers Industry Volume K Tons Forecast, by Application 2020 & 2033
- Table 25: Global Food Texturizers Industry Revenue billion Forecast, by Country 2020 & 2033
- Table 26: Global Food Texturizers Industry Volume K Tons Forecast, by Country 2020 & 2033
- Table 27: United Kingdom Food Texturizers Industry Revenue (billion) Forecast, by Application 2020 & 2033
- Table 28: United Kingdom Food Texturizers Industry Volume (K Tons) Forecast, by Application 2020 & 2033
- Table 29: Germany Food Texturizers Industry Revenue (billion) Forecast, by Application 2020 & 2033
- Table 30: Germany Food Texturizers Industry Volume (K Tons) Forecast, by Application 2020 & 2033
- Table 31: France Food Texturizers Industry Revenue (billion) Forecast, by Application 2020 & 2033
- Table 32: France Food Texturizers Industry Volume (K Tons) Forecast, by Application 2020 & 2033
- Table 33: Russia Food Texturizers Industry Revenue (billion) Forecast, by Application 2020 & 2033
- Table 34: Russia Food Texturizers Industry Volume (K Tons) Forecast, by Application 2020 & 2033
- Table 35: Italy Food Texturizers Industry Revenue (billion) Forecast, by Application 2020 & 2033
- Table 36: Italy Food Texturizers Industry Volume (K Tons) Forecast, by Application 2020 & 2033
- Table 37: Spain Food Texturizers Industry Revenue (billion) Forecast, by Application 2020 & 2033
- Table 38: Spain Food Texturizers Industry Volume (K Tons) Forecast, by Application 2020 & 2033
- Table 39: Rest of Europe Food Texturizers Industry Revenue (billion) Forecast, by Application 2020 & 2033
- Table 40: Rest of Europe Food Texturizers Industry Volume (K Tons) Forecast, by Application 2020 & 2033
- Table 41: Global Food Texturizers Industry Revenue billion Forecast, by Type 2020 & 2033
- Table 42: Global Food Texturizers Industry Volume K Tons Forecast, by Type 2020 & 2033
- Table 43: Global Food Texturizers Industry Revenue billion Forecast, by Application 2020 & 2033
- Table 44: Global Food Texturizers Industry Volume K Tons Forecast, by Application 2020 & 2033
- Table 45: Global Food Texturizers Industry Revenue billion Forecast, by Country 2020 & 2033
- Table 46: Global Food Texturizers Industry Volume K Tons Forecast, by Country 2020 & 2033
- Table 47: India Food Texturizers Industry Revenue (billion) Forecast, by Application 2020 & 2033
- Table 48: India Food Texturizers Industry Volume (K Tons) Forecast, by Application 2020 & 2033
- Table 49: China Food Texturizers Industry Revenue (billion) Forecast, by Application 2020 & 2033
- Table 50: China Food Texturizers Industry Volume (K Tons) Forecast, by Application 2020 & 2033
- Table 51: Japan Food Texturizers Industry Revenue (billion) Forecast, by Application 2020 & 2033
- Table 52: Japan Food Texturizers Industry Volume (K Tons) Forecast, by Application 2020 & 2033
- Table 53: Australia Food Texturizers Industry Revenue (billion) Forecast, by Application 2020 & 2033
- Table 54: Australia Food Texturizers Industry Volume (K Tons) Forecast, by Application 2020 & 2033
- Table 55: Rest of Asia Pacific Food Texturizers Industry Revenue (billion) Forecast, by Application 2020 & 2033
- Table 56: Rest of Asia Pacific Food Texturizers Industry Volume (K Tons) Forecast, by Application 2020 & 2033
- Table 57: Global Food Texturizers Industry Revenue billion Forecast, by Type 2020 & 2033
- Table 58: Global Food Texturizers Industry Volume K Tons Forecast, by Type 2020 & 2033
- Table 59: Global Food Texturizers Industry Revenue billion Forecast, by Application 2020 & 2033
- Table 60: Global Food Texturizers Industry Volume K Tons Forecast, by Application 2020 & 2033
- Table 61: Global Food Texturizers Industry Revenue billion Forecast, by Country 2020 & 2033
- Table 62: Global Food Texturizers Industry Volume K Tons Forecast, by Country 2020 & 2033
- Table 63: Brazil Food Texturizers Industry Revenue (billion) Forecast, by Application 2020 & 2033
- Table 64: Brazil Food Texturizers Industry Volume (K Tons) Forecast, by Application 2020 & 2033
- Table 65: Argentina Food Texturizers Industry Revenue (billion) Forecast, by Application 2020 & 2033
- Table 66: Argentina Food Texturizers Industry Volume (K Tons) Forecast, by Application 2020 & 2033
- Table 67: Rest of South America Food Texturizers Industry Revenue (billion) Forecast, by Application 2020 & 2033
- Table 68: Rest of South America Food Texturizers Industry Volume (K Tons) Forecast, by Application 2020 & 2033
- Table 69: Global Food Texturizers Industry Revenue billion Forecast, by Type 2020 & 2033
- Table 70: Global Food Texturizers Industry Volume K Tons Forecast, by Type 2020 & 2033
- Table 71: Global Food Texturizers Industry Revenue billion Forecast, by Application 2020 & 2033
- Table 72: Global Food Texturizers Industry Volume K Tons Forecast, by Application 2020 & 2033
- Table 73: Global Food Texturizers Industry Revenue billion Forecast, by Country 2020 & 2033
- Table 74: Global Food Texturizers Industry Volume K Tons Forecast, by Country 2020 & 2033
- Table 75: Global Food Texturizers Industry Revenue billion Forecast, by Type 2020 & 2033
- Table 76: Global Food Texturizers Industry Volume K Tons Forecast, by Type 2020 & 2033
- Table 77: Global Food Texturizers Industry Revenue billion Forecast, by Application 2020 & 2033
- Table 78: Global Food Texturizers Industry Volume K Tons Forecast, by Application 2020 & 2033
- Table 79: Global Food Texturizers Industry Revenue billion Forecast, by Country 2020 & 2033
- Table 80: Global Food Texturizers Industry Volume K Tons Forecast, by Country 2020 & 2033
- Table 81: Saudi Arabia Food Texturizers Industry Revenue (billion) Forecast, by Application 2020 & 2033
- Table 82: Saudi Arabia Food Texturizers Industry Volume (K Tons) Forecast, by Application 2020 & 2033
- Table 83: Rest of Middle East Food Texturizers Industry Revenue (billion) Forecast, by Application 2020 & 2033
- Table 84: Rest of Middle East Food Texturizers Industry Volume (K Tons) Forecast, by Application 2020 & 2033
Frequently Asked Questions
1. What is the projected Compound Annual Growth Rate (CAGR) of the Food Texturizers Industry?
The projected CAGR is approximately 7.3%.
2. Which companies are prominent players in the Food Texturizers Industry?
Key companies in the market include Tate & Lyle Plc, Cargill Incorporated, Archer Daniels Midland Co, Royal DSM N V, Palsgaard A/S, Kerry Inc, Ingredion Inc, DuPont, Fiberstar Inc *List Not Exhaustive, Estelle Chemicals Pvt Ltd.
3. What are the main segments of the Food Texturizers Industry?
The market segments include Type, Application.
4. Can you provide details about the market size?
The market size is estimated to be USD 10 billion as of 2022.
5. What are some drivers contributing to market growth?
Rising Incidence of Obesity and Cadiovascular Diseases; Growing Trend of Veganism Drives the Market.
6. What are the notable trends driving market growth?
Growing Demand for Low Calorie Food Products.
7. Are there any restraints impacting market growth?
Associated Allergies With Plant Proteins.
8. Can you provide examples of recent developments in the market?
April 2022: Cargill Salt announced it will invest USD 68 billion in expanding ST. Clair Plant. Investments being made by Cargill will enhance the plant's production capacity through increased automation, new technology, and efficiency improvements. The multi-year improvement project also includes constructing a new 50,000-square-foot evaporation facility to house a state-of-the-art dry processing line expected to reduce waste and increase capacity by up to 40%.
9. What pricing options are available for accessing the report?
Pricing options include single-user, multi-user, and enterprise licenses priced at USD 4750, USD 5250, and USD 8750 respectively.
10. Is the market size provided in terms of value or volume?
The market size is provided in terms of value, measured in billion and volume, measured in K Tons.
11. Are there any specific market keywords associated with the report?
Yes, the market keyword associated with the report is "Food Texturizers Industry," which aids in identifying and referencing the specific market segment covered.
12. How do I determine which pricing option suits my needs best?
The pricing options vary based on user requirements and access needs. Individual users may opt for single-user licenses, while businesses requiring broader access may choose multi-user or enterprise licenses for cost-effective access to the report.
13. Are there any additional resources or data provided in the Food Texturizers Industry report?
While the report offers comprehensive insights, it's advisable to review the specific contents or supplementary materials provided to ascertain if additional resources or data are available.
14. How can I stay updated on further developments or reports in the Food Texturizers Industry?
To stay informed about further developments, trends, and reports in the Food Texturizers Industry, consider subscribing to industry newsletters, following relevant companies and organizations, or regularly checking reputable industry news sources and publications.
Methodology
Step 1 - Identification of Relevant Samples Size from Population Database


Step 2 - Approaches for Defining Global Market Size (Value, Volume* & Price*)

Note*: In applicable scenarios
Step 3 - Data Sources
Primary Research
- Web Analytics
- Survey Reports
- Research Institute
- Latest Research Reports
- Opinion Leaders
Secondary Research
- Annual Reports
- White Paper
- Latest Press Release
- Industry Association
- Paid Database
- Investor Presentations

Step 4 - Data Triangulation
Involves using different sources of information in order to increase the validity of a study
These sources are likely to be stakeholders in a program - participants, other researchers, program staff, other community members, and so on.
Then we put all data in single framework & apply various statistical tools to find out the dynamic on the market.
During the analysis stage, feedback from the stakeholder groups would be compared to determine areas of agreement as well as areas of divergence