

Key Insights
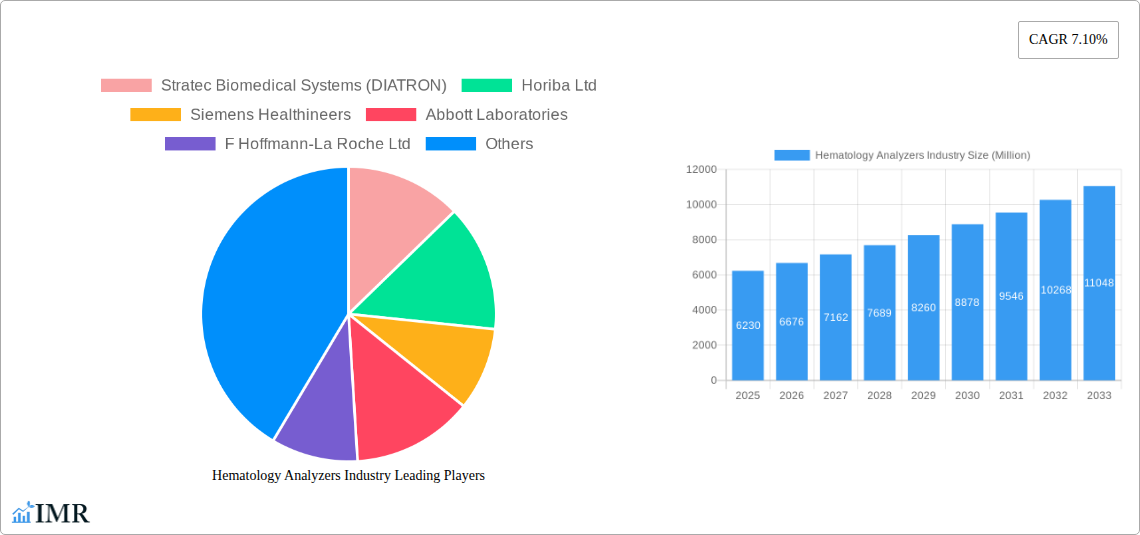
The global hematology analyzers market, valued at $6.23 billion in 2025, is projected to experience robust growth, driven by several key factors. The increasing prevalence of hematological disorders like leukemia, anemia, and blood clotting issues fuels demand for accurate and efficient diagnostic tools. Technological advancements, such as the development of automated hematology analyzers with improved analytical capabilities and higher throughput, are significantly impacting market expansion. Furthermore, the rising geriatric population, who are more susceptible to blood-related diseases, contributes to increased testing volumes. The shift towards point-of-care testing (POCT) and the integration of advanced technologies like artificial intelligence (AI) for improved diagnostic accuracy are further accelerating market growth. Growth is also fueled by the expanding clinical laboratory infrastructure globally, particularly in developing economies experiencing rapid healthcare infrastructure improvements. However, the high cost of advanced hematology analyzers and the need for skilled technicians to operate and maintain them might pose some restraints to market penetration, especially in resource-constrained settings. The market segmentation reveals significant opportunities within the reagents and services sectors, underpinning the continuous growth of the overall market. Hospitals and clinical laboratories remain the largest end-users, but growth is also anticipated from research institutes and other end-users as research and development efforts continue.
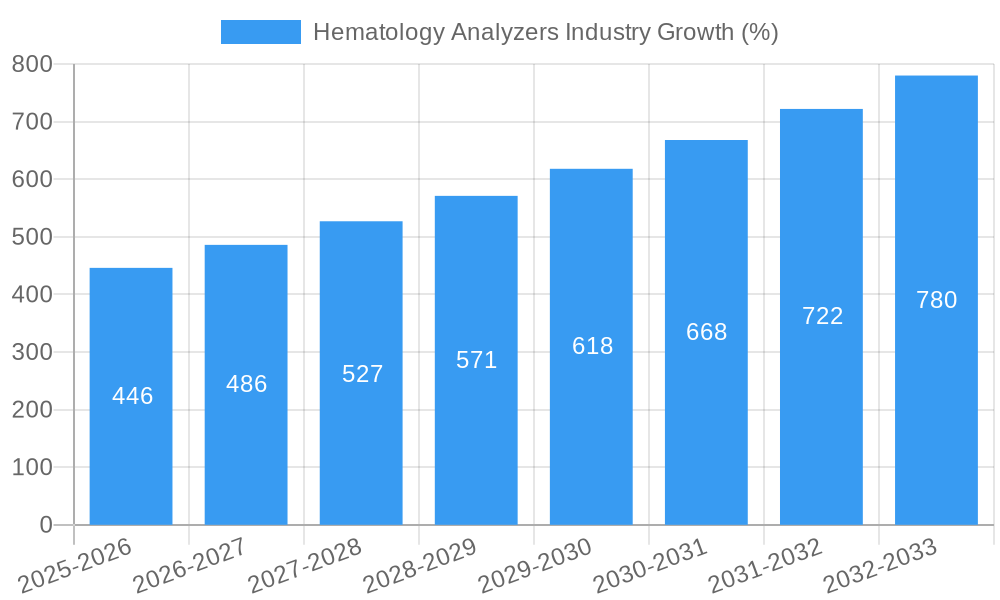
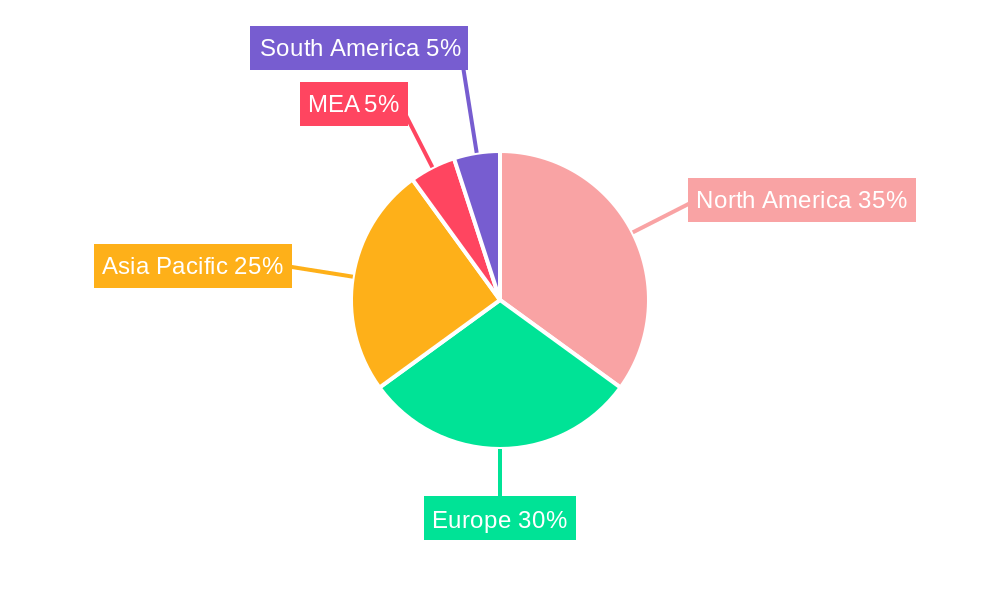
The market is geographically diverse, with North America and Europe currently holding significant market shares due to established healthcare infrastructure and high adoption rates of advanced technologies. However, the Asia-Pacific region is expected to exhibit considerable growth potential in the coming years, driven by rising healthcare expenditure, increasing awareness of hematological diseases, and expanding healthcare infrastructure in countries like China and India. Competitive landscape analysis reveals a mix of established global players and regional manufacturers. This competitive environment fosters innovation and drives down costs, ultimately benefiting patients and healthcare systems worldwide. The forecast period (2025-2033) anticipates a sustained CAGR of 7.10%, indicating a promising future for the hematology analyzers market. This growth is expected to be driven by a combination of factors, including increasing disease prevalence, technological advancements, and expanding healthcare infrastructure globally.
Hematology Analyzers Industry Market Report: 2019-2033
This comprehensive report provides a detailed analysis of the Hematology Analyzers industry, encompassing market dynamics, growth trends, regional dominance, product landscape, challenges, opportunities, and key players. The report covers the period from 2019 to 2033, with 2025 as the base year and a forecast period from 2025 to 2033. The market is segmented by product type (Instruments, Reagents, Services), and end-user (Hospitals, Clinical Laboratories, Research Institutes, Other End Users). The report offers invaluable insights for industry professionals, investors, and stakeholders seeking to understand and capitalize on the growth potential within this vital sector. Estimated market values are presented in million units.
Hematology Analyzers Industry Market Dynamics & Structure
The hematology analyzers market is characterized by a moderately concentrated landscape, with a few major players dominating the global market share. Technological innovation, particularly in automation, miniaturization, and improved diagnostic capabilities, is a significant driver. Stringent regulatory frameworks, varying across geographies, impact market entry and product approvals. Competitive pressures from substitute technologies and the increasing availability of cost-effective alternatives are also shaping the market. End-user demographics, particularly the aging population and the rising prevalence of chronic diseases, fuel the demand for sophisticated hematology analyzers. M&A activity within the industry has been relatively moderate in recent years, with xx deals recorded between 2019 and 2024, resulting in a slight shift in market share dynamics.
- Market Concentration: Moderately concentrated, with top 5 players holding xx% market share in 2024.
- Technological Innovation: Focus on automation, improved accuracy, and faster turnaround times.
- Regulatory Landscape: Stringent regulatory approvals vary across regions, impacting market entry.
- Competitive Substitutes: Presence of alternative diagnostic methods creating competitive pressure.
- M&A Activity: xx deals between 2019 and 2024, leading to minor market share adjustments.
- Innovation Barriers: High R&D costs, stringent regulatory pathways.
Hematology Analyzers Industry Growth Trends & Insights
The global hematology analyzers market experienced significant growth during the historical period (2019-2024), with a CAGR of xx%. This growth is attributed to several factors, including the increasing prevalence of blood-related disorders, technological advancements leading to improved diagnostic accuracy and efficiency, and the rising adoption of hematology analyzers in developing economies. The market is expected to continue its growth trajectory during the forecast period (2025-2033), driven by factors such as increasing healthcare expenditure, growing awareness of hematological diseases, and technological innovations such as point-of-care testing devices and AI-powered diagnostic tools. Market penetration remains relatively high in developed regions, but substantial growth potential exists in emerging markets with rising healthcare infrastructure development. Consumer behavior is shifting towards preference for automated, high-throughput analyzers that reduce manual intervention and enhance efficiency in laboratories.
- Market Size (2024): xx Million Units
- CAGR (2019-2024): xx%
- Projected Market Size (2033): xx Million Units
- Market Penetration (2024): xx% in developed regions, xx% in emerging regions.
Dominant Regions, Countries, or Segments in Hematology Analyzers Industry
North America currently holds the largest market share in the hematology analyzers industry, driven by factors such as advanced healthcare infrastructure, high healthcare expenditure, and a large number of established diagnostic laboratories. However, the Asia-Pacific region is projected to exhibit the highest CAGR during the forecast period, fueled by rapid economic growth, rising healthcare spending, and increasing prevalence of hematological diseases. Within the market segments, the "Instruments" segment commands the largest market share due to the high demand for automated and advanced hematology analyzers. The "Hospitals" segment is the largest end-user segment due to the concentration of hematological testing activities in hospitals.
- Leading Region (2024): North America
- Fastest-Growing Region (2025-2033): Asia-Pacific
- Largest Segment (Product Type): Instruments
- Largest Segment (End User): Hospitals
- Key Drivers (Asia-Pacific): Rising healthcare expenditure, increasing prevalence of chronic diseases, government initiatives to improve healthcare infrastructure.
Hematology Analyzers Industry Product Landscape
Hematology analyzers have witnessed significant advancements, transitioning from basic cell counting devices to sophisticated systems capable of providing comprehensive blood analysis, including complete blood counts (CBC), reticulocyte counts, and differential white blood cell counts. Modern analyzers utilize advanced technologies like flow cytometry, impedance, and laser-based techniques to deliver accurate and rapid results. Key innovations include miniaturization, improved automation, and integration with laboratory information systems (LIS) for streamlined workflow. Unique selling propositions include enhanced speed, accuracy, ease of use, and cost-effectiveness.
Key Drivers, Barriers & Challenges in Hematology Analyzers Industry
Key Drivers: Technological advancements driving improved diagnostic accuracy and efficiency, increasing prevalence of blood-related disorders, rising healthcare expenditure, and growing adoption in developing economies are propelling market growth. Government initiatives supporting healthcare infrastructure development and investment in diagnostic technologies are further catalyzing growth.
Key Challenges: High initial investment costs for advanced analyzers, stringent regulatory approvals, competition from alternative diagnostic methods, and potential supply chain disruptions pose significant challenges. The need for skilled personnel to operate and maintain sophisticated equipment can also be a limiting factor.
Emerging Opportunities in Hematology Analyzers Industry
Untapped markets in developing economies, the increasing demand for point-of-care testing devices, the integration of artificial intelligence (AI) for improved diagnostics, and the growing demand for personalized medicine are major emerging opportunities. Expansion into specialized hematology testing areas like molecular diagnostics and the development of innovative applications for blood analysis are also significant avenues for growth.
Growth Accelerators in the Hematology Analyzers Industry Industry
Technological breakthroughs like AI-driven diagnostics, improved automation, and miniaturization are significantly accelerating market growth. Strategic partnerships between analyzer manufacturers and healthcare providers are creating synergies that enhance market penetration and adoption rates. Market expansion strategies focusing on emerging economies and developing countries are also fueling market expansion and long-term growth.
Key Players Shaping the Hematology Analyzers Industry Market
- Stratec Biomedical Systems (DIATRON)
- Horiba Ltd
- Siemens Healthineers
- Abbott Laboratories
- F Hoffmann-La Roche Ltd
- Ortho Clinical Diagnostics
- Boule Diagnostics AB
- Bio-Rad Laboratories
- Beckman Coulter Inc (Danaher Corporation)
- Sysmex Corporation
- Accurex Biomedical Pvt Ltd
- Nihon Kohden Corporation
Notable Milestones in Hematology Analyzers Industry Sector
- May 2022: Nihon Kohden India established a new hematology analyzer reagent factory.
- March 2022: Mindray launched the BC-700 Series, a revolutionary hematology analyzer series including CBC and ESR tests.
In-Depth Hematology Analyzers Industry Market Outlook
The hematology analyzers market is poised for sustained growth over the next decade, driven by continued technological advancements, expanding healthcare infrastructure in emerging markets, and the increasing prevalence of blood-related diseases. Strategic partnerships, acquisitions, and the development of innovative diagnostic capabilities will further shape the industry landscape. Companies focusing on personalized medicine and point-of-care solutions will likely gain a competitive edge, creating exciting opportunities for both established and emerging players.
Hematology Analyzers Industry Segmentation
-
1. Product Type
-
1.1. Instruments
- 1.1.1. 3 Part Hematology Analyzer
- 1.1.2. 5 Part Hematology Analyzer
- 1.1.3. Point-of-care Testing Hematology Analyzers
- 1.1.4. Others
- 1.2. Reagents
- 1.3. Services
-
1.1. Instruments
-
2. End User
- 2.1. Hospitals
- 2.2. Clinical Laboratories
- 2.3. Research Institutes
- 2.4. Other End Users
Hematology Analyzers Industry Segmentation By Geography
-
1. North America
- 1.1. United States
- 1.2. Canada
- 1.3. Mexico
-
2. Europe
- 2.1. Germany
- 2.2. United Kingdom
- 2.3. France
- 2.4. Italy
- 2.5. Spain
- 2.6. Rest of Europe
-
3. Asia Pacific
- 3.1. China
- 3.2. Japan
- 3.3. India
- 3.4. Australia
- 3.5. South Korea
- 3.6. Rest of Asia Pacific
-
4. Middle East and Africa
- 4.1. GCC
- 4.2. South Africa
- 4.3. Rest of Middle East and Africa
-
5. South America
- 5.1. Brazil
- 5.2. Argentina
- 5.3. Rest of South America
Hematology Analyzers Industry REPORT HIGHLIGHTS
| Aspects | Details |
|---|---|
| Study Period | 2019-2033 |
| Base Year | 2024 |
| Estimated Year | 2025 |
| Forecast Period | 2025-2033 |
| Historical Period | 2019-2024 |
| Growth Rate | CAGR of 7.10% from 2019-2033 |
| Segmentation |
|
Table of Contents
- 1. Introduction
- 1.1. Research Scope
- 1.2. Market Segmentation
- 1.3. Research Methodology
- 1.4. Definitions and Assumptions
- 2. Executive Summary
- 2.1. Introduction
- 3. Market Dynamics
- 3.1. Introduction
- 3.2. Market Drivers
- 3.2.1. Rising Burden of Blood Disorders; Increasing Technological Advancements and Rising Adoption Rates of Automated Hematology Instruments
- 3.3. Market Restrains
- 3.3.1. High Cost of Hematology Analyzers; Time-consuming and Stringent Rregulatory Policies
- 3.4. Market Trends
- 3.4.1. 3 Part Hematology Analyzer is the Segment by Instruments Expected to Hold Significant Market Share Over the Forecast Period
- 4. Market Factor Analysis
- 4.1. Porters Five Forces
- 4.2. Supply/Value Chain
- 4.3. PESTEL analysis
- 4.4. Market Entropy
- 4.5. Patent/Trademark Analysis
- 5. Global Hematology Analyzers Industry Analysis, Insights and Forecast, 2019-2031
- 5.1. Market Analysis, Insights and Forecast - by Product Type
- 5.1.1. Instruments
- 5.1.1.1. 3 Part Hematology Analyzer
- 5.1.1.2. 5 Part Hematology Analyzer
- 5.1.1.3. Point-of-care Testing Hematology Analyzers
- 5.1.1.4. Others
- 5.1.2. Reagents
- 5.1.3. Services
- 5.1.1. Instruments
- 5.2. Market Analysis, Insights and Forecast - by End User
- 5.2.1. Hospitals
- 5.2.2. Clinical Laboratories
- 5.2.3. Research Institutes
- 5.2.4. Other End Users
- 5.3. Market Analysis, Insights and Forecast - by Region
- 5.3.1. North America
- 5.3.2. Europe
- 5.3.3. Asia Pacific
- 5.3.4. Middle East and Africa
- 5.3.5. South America
- 5.1. Market Analysis, Insights and Forecast - by Product Type
- 6. North America Hematology Analyzers Industry Analysis, Insights and Forecast, 2019-2031
- 6.1. Market Analysis, Insights and Forecast - by Product Type
- 6.1.1. Instruments
- 6.1.1.1. 3 Part Hematology Analyzer
- 6.1.1.2. 5 Part Hematology Analyzer
- 6.1.1.3. Point-of-care Testing Hematology Analyzers
- 6.1.1.4. Others
- 6.1.2. Reagents
- 6.1.3. Services
- 6.1.1. Instruments
- 6.2. Market Analysis, Insights and Forecast - by End User
- 6.2.1. Hospitals
- 6.2.2. Clinical Laboratories
- 6.2.3. Research Institutes
- 6.2.4. Other End Users
- 6.1. Market Analysis, Insights and Forecast - by Product Type
- 7. Europe Hematology Analyzers Industry Analysis, Insights and Forecast, 2019-2031
- 7.1. Market Analysis, Insights and Forecast - by Product Type
- 7.1.1. Instruments
- 7.1.1.1. 3 Part Hematology Analyzer
- 7.1.1.2. 5 Part Hematology Analyzer
- 7.1.1.3. Point-of-care Testing Hematology Analyzers
- 7.1.1.4. Others
- 7.1.2. Reagents
- 7.1.3. Services
- 7.1.1. Instruments
- 7.2. Market Analysis, Insights and Forecast - by End User
- 7.2.1. Hospitals
- 7.2.2. Clinical Laboratories
- 7.2.3. Research Institutes
- 7.2.4. Other End Users
- 7.1. Market Analysis, Insights and Forecast - by Product Type
- 8. Asia Pacific Hematology Analyzers Industry Analysis, Insights and Forecast, 2019-2031
- 8.1. Market Analysis, Insights and Forecast - by Product Type
- 8.1.1. Instruments
- 8.1.1.1. 3 Part Hematology Analyzer
- 8.1.1.2. 5 Part Hematology Analyzer
- 8.1.1.3. Point-of-care Testing Hematology Analyzers
- 8.1.1.4. Others
- 8.1.2. Reagents
- 8.1.3. Services
- 8.1.1. Instruments
- 8.2. Market Analysis, Insights and Forecast - by End User
- 8.2.1. Hospitals
- 8.2.2. Clinical Laboratories
- 8.2.3. Research Institutes
- 8.2.4. Other End Users
- 8.1. Market Analysis, Insights and Forecast - by Product Type
- 9. Middle East and Africa Hematology Analyzers Industry Analysis, Insights and Forecast, 2019-2031
- 9.1. Market Analysis, Insights and Forecast - by Product Type
- 9.1.1. Instruments
- 9.1.1.1. 3 Part Hematology Analyzer
- 9.1.1.2. 5 Part Hematology Analyzer
- 9.1.1.3. Point-of-care Testing Hematology Analyzers
- 9.1.1.4. Others
- 9.1.2. Reagents
- 9.1.3. Services
- 9.1.1. Instruments
- 9.2. Market Analysis, Insights and Forecast - by End User
- 9.2.1. Hospitals
- 9.2.2. Clinical Laboratories
- 9.2.3. Research Institutes
- 9.2.4. Other End Users
- 9.1. Market Analysis, Insights and Forecast - by Product Type
- 10. South America Hematology Analyzers Industry Analysis, Insights and Forecast, 2019-2031
- 10.1. Market Analysis, Insights and Forecast - by Product Type
- 10.1.1. Instruments
- 10.1.1.1. 3 Part Hematology Analyzer
- 10.1.1.2. 5 Part Hematology Analyzer
- 10.1.1.3. Point-of-care Testing Hematology Analyzers
- 10.1.1.4. Others
- 10.1.2. Reagents
- 10.1.3. Services
- 10.1.1. Instruments
- 10.2. Market Analysis, Insights and Forecast - by End User
- 10.2.1. Hospitals
- 10.2.2. Clinical Laboratories
- 10.2.3. Research Institutes
- 10.2.4. Other End Users
- 10.1. Market Analysis, Insights and Forecast - by Product Type
- 11. North America Hematology Analyzers Industry Analysis, Insights and Forecast, 2019-2031
- 11.1. Market Analysis, Insights and Forecast - By Country/Sub-region
- 11.1.1 United States
- 11.1.2 Canada
- 11.1.3 Mexico
- 12. South America Hematology Analyzers Industry Analysis, Insights and Forecast, 2019-2031
- 12.1. Market Analysis, Insights and Forecast - By Country/Sub-region
- 12.1.1 Brazil
- 12.1.2 Mexico
- 12.1.3 Rest of South America
- 13. Europe Hematology Analyzers Industry Analysis, Insights and Forecast, 2019-2031
- 13.1. Market Analysis, Insights and Forecast - By Country/Sub-region
- 13.1.1 United Kingdom
- 13.1.2 Germany
- 13.1.3 France
- 13.1.4 Italy
- 13.1.5 Spain
- 13.1.6 Russia
- 13.1.7 Rest of Europe
- 14. Asia Pacific Hematology Analyzers Industry Analysis, Insights and Forecast, 2019-2031
- 14.1. Market Analysis, Insights and Forecast - By Country/Sub-region
- 14.1.1 China
- 14.1.2 Japan
- 14.1.3 India
- 14.1.4 South Korea
- 14.1.5 Taiwan
- 14.1.6 Australia
- 14.1.7 Rest of Asia-Pacific
- 15. MEA Hematology Analyzers Industry Analysis, Insights and Forecast, 2019-2031
- 15.1. Market Analysis, Insights and Forecast - By Country/Sub-region
- 15.1.1 Middle East
- 15.1.2 Africa
- 16. Competitive Analysis
- 16.1. Global Market Share Analysis 2024
- 16.2. Company Profiles
- 16.2.1 Stratec Biomedical Systems (DIATRON)
- 16.2.1.1. Overview
- 16.2.1.2. Products
- 16.2.1.3. SWOT Analysis
- 16.2.1.4. Recent Developments
- 16.2.1.5. Financials (Based on Availability)
- 16.2.2 Horiba Ltd
- 16.2.2.1. Overview
- 16.2.2.2. Products
- 16.2.2.3. SWOT Analysis
- 16.2.2.4. Recent Developments
- 16.2.2.5. Financials (Based on Availability)
- 16.2.3 Siemens Healthineers
- 16.2.3.1. Overview
- 16.2.3.2. Products
- 16.2.3.3. SWOT Analysis
- 16.2.3.4. Recent Developments
- 16.2.3.5. Financials (Based on Availability)
- 16.2.4 Abbott Laboratories
- 16.2.4.1. Overview
- 16.2.4.2. Products
- 16.2.4.3. SWOT Analysis
- 16.2.4.4. Recent Developments
- 16.2.4.5. Financials (Based on Availability)
- 16.2.5 F Hoffmann-La Roche Ltd
- 16.2.5.1. Overview
- 16.2.5.2. Products
- 16.2.5.3. SWOT Analysis
- 16.2.5.4. Recent Developments
- 16.2.5.5. Financials (Based on Availability)
- 16.2.6 Ortho Clinical Diagnostics
- 16.2.6.1. Overview
- 16.2.6.2. Products
- 16.2.6.3. SWOT Analysis
- 16.2.6.4. Recent Developments
- 16.2.6.5. Financials (Based on Availability)
- 16.2.7 Boule Diagnostics AB
- 16.2.7.1. Overview
- 16.2.7.2. Products
- 16.2.7.3. SWOT Analysis
- 16.2.7.4. Recent Developments
- 16.2.7.5. Financials (Based on Availability)
- 16.2.8 Bio-Rad Laboratories
- 16.2.8.1. Overview
- 16.2.8.2. Products
- 16.2.8.3. SWOT Analysis
- 16.2.8.4. Recent Developments
- 16.2.8.5. Financials (Based on Availability)
- 16.2.9 Beckman Coulter Inc (Danaher Corporation)
- 16.2.9.1. Overview
- 16.2.9.2. Products
- 16.2.9.3. SWOT Analysis
- 16.2.9.4. Recent Developments
- 16.2.9.5. Financials (Based on Availability)
- 16.2.10 Sysmex Corporation
- 16.2.10.1. Overview
- 16.2.10.2. Products
- 16.2.10.3. SWOT Analysis
- 16.2.10.4. Recent Developments
- 16.2.10.5. Financials (Based on Availability)
- 16.2.11 Accurex Biomedical Pvt Ltd
- 16.2.11.1. Overview
- 16.2.11.2. Products
- 16.2.11.3. SWOT Analysis
- 16.2.11.4. Recent Developments
- 16.2.11.5. Financials (Based on Availability)
- 16.2.12 Nihon Kohden Corporation
- 16.2.12.1. Overview
- 16.2.12.2. Products
- 16.2.12.3. SWOT Analysis
- 16.2.12.4. Recent Developments
- 16.2.12.5. Financials (Based on Availability)
- 16.2.1 Stratec Biomedical Systems (DIATRON)
List of Figures
- Figure 1: Global Hematology Analyzers Industry Revenue Breakdown (Million, %) by Region 2024 & 2032
- Figure 2: Global Hematology Analyzers Industry Volume Breakdown (K Unit, %) by Region 2024 & 2032
- Figure 3: North America Hematology Analyzers Industry Revenue (Million), by Country 2024 & 2032
- Figure 4: North America Hematology Analyzers Industry Volume (K Unit), by Country 2024 & 2032
- Figure 5: North America Hematology Analyzers Industry Revenue Share (%), by Country 2024 & 2032
- Figure 6: North America Hematology Analyzers Industry Volume Share (%), by Country 2024 & 2032
- Figure 7: South America Hematology Analyzers Industry Revenue (Million), by Country 2024 & 2032
- Figure 8: South America Hematology Analyzers Industry Volume (K Unit), by Country 2024 & 2032
- Figure 9: South America Hematology Analyzers Industry Revenue Share (%), by Country 2024 & 2032
- Figure 10: South America Hematology Analyzers Industry Volume Share (%), by Country 2024 & 2032
- Figure 11: Europe Hematology Analyzers Industry Revenue (Million), by Country 2024 & 2032
- Figure 12: Europe Hematology Analyzers Industry Volume (K Unit), by Country 2024 & 2032
- Figure 13: Europe Hematology Analyzers Industry Revenue Share (%), by Country 2024 & 2032
- Figure 14: Europe Hematology Analyzers Industry Volume Share (%), by Country 2024 & 2032
- Figure 15: Asia Pacific Hematology Analyzers Industry Revenue (Million), by Country 2024 & 2032
- Figure 16: Asia Pacific Hematology Analyzers Industry Volume (K Unit), by Country 2024 & 2032
- Figure 17: Asia Pacific Hematology Analyzers Industry Revenue Share (%), by Country 2024 & 2032
- Figure 18: Asia Pacific Hematology Analyzers Industry Volume Share (%), by Country 2024 & 2032
- Figure 19: MEA Hematology Analyzers Industry Revenue (Million), by Country 2024 & 2032
- Figure 20: MEA Hematology Analyzers Industry Volume (K Unit), by Country 2024 & 2032
- Figure 21: MEA Hematology Analyzers Industry Revenue Share (%), by Country 2024 & 2032
- Figure 22: MEA Hematology Analyzers Industry Volume Share (%), by Country 2024 & 2032
- Figure 23: North America Hematology Analyzers Industry Revenue (Million), by Product Type 2024 & 2032
- Figure 24: North America Hematology Analyzers Industry Volume (K Unit), by Product Type 2024 & 2032
- Figure 25: North America Hematology Analyzers Industry Revenue Share (%), by Product Type 2024 & 2032
- Figure 26: North America Hematology Analyzers Industry Volume Share (%), by Product Type 2024 & 2032
- Figure 27: North America Hematology Analyzers Industry Revenue (Million), by End User 2024 & 2032
- Figure 28: North America Hematology Analyzers Industry Volume (K Unit), by End User 2024 & 2032
- Figure 29: North America Hematology Analyzers Industry Revenue Share (%), by End User 2024 & 2032
- Figure 30: North America Hematology Analyzers Industry Volume Share (%), by End User 2024 & 2032
- Figure 31: North America Hematology Analyzers Industry Revenue (Million), by Country 2024 & 2032
- Figure 32: North America Hematology Analyzers Industry Volume (K Unit), by Country 2024 & 2032
- Figure 33: North America Hematology Analyzers Industry Revenue Share (%), by Country 2024 & 2032
- Figure 34: North America Hematology Analyzers Industry Volume Share (%), by Country 2024 & 2032
- Figure 35: Europe Hematology Analyzers Industry Revenue (Million), by Product Type 2024 & 2032
- Figure 36: Europe Hematology Analyzers Industry Volume (K Unit), by Product Type 2024 & 2032
- Figure 37: Europe Hematology Analyzers Industry Revenue Share (%), by Product Type 2024 & 2032
- Figure 38: Europe Hematology Analyzers Industry Volume Share (%), by Product Type 2024 & 2032
- Figure 39: Europe Hematology Analyzers Industry Revenue (Million), by End User 2024 & 2032
- Figure 40: Europe Hematology Analyzers Industry Volume (K Unit), by End User 2024 & 2032
- Figure 41: Europe Hematology Analyzers Industry Revenue Share (%), by End User 2024 & 2032
- Figure 42: Europe Hematology Analyzers Industry Volume Share (%), by End User 2024 & 2032
- Figure 43: Europe Hematology Analyzers Industry Revenue (Million), by Country 2024 & 2032
- Figure 44: Europe Hematology Analyzers Industry Volume (K Unit), by Country 2024 & 2032
- Figure 45: Europe Hematology Analyzers Industry Revenue Share (%), by Country 2024 & 2032
- Figure 46: Europe Hematology Analyzers Industry Volume Share (%), by Country 2024 & 2032
- Figure 47: Asia Pacific Hematology Analyzers Industry Revenue (Million), by Product Type 2024 & 2032
- Figure 48: Asia Pacific Hematology Analyzers Industry Volume (K Unit), by Product Type 2024 & 2032
- Figure 49: Asia Pacific Hematology Analyzers Industry Revenue Share (%), by Product Type 2024 & 2032
- Figure 50: Asia Pacific Hematology Analyzers Industry Volume Share (%), by Product Type 2024 & 2032
- Figure 51: Asia Pacific Hematology Analyzers Industry Revenue (Million), by End User 2024 & 2032
- Figure 52: Asia Pacific Hematology Analyzers Industry Volume (K Unit), by End User 2024 & 2032
- Figure 53: Asia Pacific Hematology Analyzers Industry Revenue Share (%), by End User 2024 & 2032
- Figure 54: Asia Pacific Hematology Analyzers Industry Volume Share (%), by End User 2024 & 2032
- Figure 55: Asia Pacific Hematology Analyzers Industry Revenue (Million), by Country 2024 & 2032
- Figure 56: Asia Pacific Hematology Analyzers Industry Volume (K Unit), by Country 2024 & 2032
- Figure 57: Asia Pacific Hematology Analyzers Industry Revenue Share (%), by Country 2024 & 2032
- Figure 58: Asia Pacific Hematology Analyzers Industry Volume Share (%), by Country 2024 & 2032
- Figure 59: Middle East and Africa Hematology Analyzers Industry Revenue (Million), by Product Type 2024 & 2032
- Figure 60: Middle East and Africa Hematology Analyzers Industry Volume (K Unit), by Product Type 2024 & 2032
- Figure 61: Middle East and Africa Hematology Analyzers Industry Revenue Share (%), by Product Type 2024 & 2032
- Figure 62: Middle East and Africa Hematology Analyzers Industry Volume Share (%), by Product Type 2024 & 2032
- Figure 63: Middle East and Africa Hematology Analyzers Industry Revenue (Million), by End User 2024 & 2032
- Figure 64: Middle East and Africa Hematology Analyzers Industry Volume (K Unit), by End User 2024 & 2032
- Figure 65: Middle East and Africa Hematology Analyzers Industry Revenue Share (%), by End User 2024 & 2032
- Figure 66: Middle East and Africa Hematology Analyzers Industry Volume Share (%), by End User 2024 & 2032
- Figure 67: Middle East and Africa Hematology Analyzers Industry Revenue (Million), by Country 2024 & 2032
- Figure 68: Middle East and Africa Hematology Analyzers Industry Volume (K Unit), by Country 2024 & 2032
- Figure 69: Middle East and Africa Hematology Analyzers Industry Revenue Share (%), by Country 2024 & 2032
- Figure 70: Middle East and Africa Hematology Analyzers Industry Volume Share (%), by Country 2024 & 2032
- Figure 71: South America Hematology Analyzers Industry Revenue (Million), by Product Type 2024 & 2032
- Figure 72: South America Hematology Analyzers Industry Volume (K Unit), by Product Type 2024 & 2032
- Figure 73: South America Hematology Analyzers Industry Revenue Share (%), by Product Type 2024 & 2032
- Figure 74: South America Hematology Analyzers Industry Volume Share (%), by Product Type 2024 & 2032
- Figure 75: South America Hematology Analyzers Industry Revenue (Million), by End User 2024 & 2032
- Figure 76: South America Hematology Analyzers Industry Volume (K Unit), by End User 2024 & 2032
- Figure 77: South America Hematology Analyzers Industry Revenue Share (%), by End User 2024 & 2032
- Figure 78: South America Hematology Analyzers Industry Volume Share (%), by End User 2024 & 2032
- Figure 79: South America Hematology Analyzers Industry Revenue (Million), by Country 2024 & 2032
- Figure 80: South America Hematology Analyzers Industry Volume (K Unit), by Country 2024 & 2032
- Figure 81: South America Hematology Analyzers Industry Revenue Share (%), by Country 2024 & 2032
- Figure 82: South America Hematology Analyzers Industry Volume Share (%), by Country 2024 & 2032
List of Tables
- Table 1: Global Hematology Analyzers Industry Revenue Million Forecast, by Region 2019 & 2032
- Table 2: Global Hematology Analyzers Industry Volume K Unit Forecast, by Region 2019 & 2032
- Table 3: Global Hematology Analyzers Industry Revenue Million Forecast, by Product Type 2019 & 2032
- Table 4: Global Hematology Analyzers Industry Volume K Unit Forecast, by Product Type 2019 & 2032
- Table 5: Global Hematology Analyzers Industry Revenue Million Forecast, by End User 2019 & 2032
- Table 6: Global Hematology Analyzers Industry Volume K Unit Forecast, by End User 2019 & 2032
- Table 7: Global Hematology Analyzers Industry Revenue Million Forecast, by Region 2019 & 2032
- Table 8: Global Hematology Analyzers Industry Volume K Unit Forecast, by Region 2019 & 2032
- Table 9: Global Hematology Analyzers Industry Revenue Million Forecast, by Country 2019 & 2032
- Table 10: Global Hematology Analyzers Industry Volume K Unit Forecast, by Country 2019 & 2032
- Table 11: United States Hematology Analyzers Industry Revenue (Million) Forecast, by Application 2019 & 2032
- Table 12: United States Hematology Analyzers Industry Volume (K Unit) Forecast, by Application 2019 & 2032
- Table 13: Canada Hematology Analyzers Industry Revenue (Million) Forecast, by Application 2019 & 2032
- Table 14: Canada Hematology Analyzers Industry Volume (K Unit) Forecast, by Application 2019 & 2032
- Table 15: Mexico Hematology Analyzers Industry Revenue (Million) Forecast, by Application 2019 & 2032
- Table 16: Mexico Hematology Analyzers Industry Volume (K Unit) Forecast, by Application 2019 & 2032
- Table 17: Global Hematology Analyzers Industry Revenue Million Forecast, by Country 2019 & 2032
- Table 18: Global Hematology Analyzers Industry Volume K Unit Forecast, by Country 2019 & 2032
- Table 19: Brazil Hematology Analyzers Industry Revenue (Million) Forecast, by Application 2019 & 2032
- Table 20: Brazil Hematology Analyzers Industry Volume (K Unit) Forecast, by Application 2019 & 2032
- Table 21: Mexico Hematology Analyzers Industry Revenue (Million) Forecast, by Application 2019 & 2032
- Table 22: Mexico Hematology Analyzers Industry Volume (K Unit) Forecast, by Application 2019 & 2032
- Table 23: Rest of South America Hematology Analyzers Industry Revenue (Million) Forecast, by Application 2019 & 2032
- Table 24: Rest of South America Hematology Analyzers Industry Volume (K Unit) Forecast, by Application 2019 & 2032
- Table 25: Global Hematology Analyzers Industry Revenue Million Forecast, by Country 2019 & 2032
- Table 26: Global Hematology Analyzers Industry Volume K Unit Forecast, by Country 2019 & 2032
- Table 27: United Kingdom Hematology Analyzers Industry Revenue (Million) Forecast, by Application 2019 & 2032
- Table 28: United Kingdom Hematology Analyzers Industry Volume (K Unit) Forecast, by Application 2019 & 2032
- Table 29: Germany Hematology Analyzers Industry Revenue (Million) Forecast, by Application 2019 & 2032
- Table 30: Germany Hematology Analyzers Industry Volume (K Unit) Forecast, by Application 2019 & 2032
- Table 31: France Hematology Analyzers Industry Revenue (Million) Forecast, by Application 2019 & 2032
- Table 32: France Hematology Analyzers Industry Volume (K Unit) Forecast, by Application 2019 & 2032
- Table 33: Italy Hematology Analyzers Industry Revenue (Million) Forecast, by Application 2019 & 2032
- Table 34: Italy Hematology Analyzers Industry Volume (K Unit) Forecast, by Application 2019 & 2032
- Table 35: Spain Hematology Analyzers Industry Revenue (Million) Forecast, by Application 2019 & 2032
- Table 36: Spain Hematology Analyzers Industry Volume (K Unit) Forecast, by Application 2019 & 2032
- Table 37: Russia Hematology Analyzers Industry Revenue (Million) Forecast, by Application 2019 & 2032
- Table 38: Russia Hematology Analyzers Industry Volume (K Unit) Forecast, by Application 2019 & 2032
- Table 39: Rest of Europe Hematology Analyzers Industry Revenue (Million) Forecast, by Application 2019 & 2032
- Table 40: Rest of Europe Hematology Analyzers Industry Volume (K Unit) Forecast, by Application 2019 & 2032
- Table 41: Global Hematology Analyzers Industry Revenue Million Forecast, by Country 2019 & 2032
- Table 42: Global Hematology Analyzers Industry Volume K Unit Forecast, by Country 2019 & 2032
- Table 43: China Hematology Analyzers Industry Revenue (Million) Forecast, by Application 2019 & 2032
- Table 44: China Hematology Analyzers Industry Volume (K Unit) Forecast, by Application 2019 & 2032
- Table 45: Japan Hematology Analyzers Industry Revenue (Million) Forecast, by Application 2019 & 2032
- Table 46: Japan Hematology Analyzers Industry Volume (K Unit) Forecast, by Application 2019 & 2032
- Table 47: India Hematology Analyzers Industry Revenue (Million) Forecast, by Application 2019 & 2032
- Table 48: India Hematology Analyzers Industry Volume (K Unit) Forecast, by Application 2019 & 2032
- Table 49: South Korea Hematology Analyzers Industry Revenue (Million) Forecast, by Application 2019 & 2032
- Table 50: South Korea Hematology Analyzers Industry Volume (K Unit) Forecast, by Application 2019 & 2032
- Table 51: Taiwan Hematology Analyzers Industry Revenue (Million) Forecast, by Application 2019 & 2032
- Table 52: Taiwan Hematology Analyzers Industry Volume (K Unit) Forecast, by Application 2019 & 2032
- Table 53: Australia Hematology Analyzers Industry Revenue (Million) Forecast, by Application 2019 & 2032
- Table 54: Australia Hematology Analyzers Industry Volume (K Unit) Forecast, by Application 2019 & 2032
- Table 55: Rest of Asia-Pacific Hematology Analyzers Industry Revenue (Million) Forecast, by Application 2019 & 2032
- Table 56: Rest of Asia-Pacific Hematology Analyzers Industry Volume (K Unit) Forecast, by Application 2019 & 2032
- Table 57: Global Hematology Analyzers Industry Revenue Million Forecast, by Country 2019 & 2032
- Table 58: Global Hematology Analyzers Industry Volume K Unit Forecast, by Country 2019 & 2032
- Table 59: Middle East Hematology Analyzers Industry Revenue (Million) Forecast, by Application 2019 & 2032
- Table 60: Middle East Hematology Analyzers Industry Volume (K Unit) Forecast, by Application 2019 & 2032
- Table 61: Africa Hematology Analyzers Industry Revenue (Million) Forecast, by Application 2019 & 2032
- Table 62: Africa Hematology Analyzers Industry Volume (K Unit) Forecast, by Application 2019 & 2032
- Table 63: Global Hematology Analyzers Industry Revenue Million Forecast, by Product Type 2019 & 2032
- Table 64: Global Hematology Analyzers Industry Volume K Unit Forecast, by Product Type 2019 & 2032
- Table 65: Global Hematology Analyzers Industry Revenue Million Forecast, by End User 2019 & 2032
- Table 66: Global Hematology Analyzers Industry Volume K Unit Forecast, by End User 2019 & 2032
- Table 67: Global Hematology Analyzers Industry Revenue Million Forecast, by Country 2019 & 2032
- Table 68: Global Hematology Analyzers Industry Volume K Unit Forecast, by Country 2019 & 2032
- Table 69: United States Hematology Analyzers Industry Revenue (Million) Forecast, by Application 2019 & 2032
- Table 70: United States Hematology Analyzers Industry Volume (K Unit) Forecast, by Application 2019 & 2032
- Table 71: Canada Hematology Analyzers Industry Revenue (Million) Forecast, by Application 2019 & 2032
- Table 72: Canada Hematology Analyzers Industry Volume (K Unit) Forecast, by Application 2019 & 2032
- Table 73: Mexico Hematology Analyzers Industry Revenue (Million) Forecast, by Application 2019 & 2032
- Table 74: Mexico Hematology Analyzers Industry Volume (K Unit) Forecast, by Application 2019 & 2032
- Table 75: Global Hematology Analyzers Industry Revenue Million Forecast, by Product Type 2019 & 2032
- Table 76: Global Hematology Analyzers Industry Volume K Unit Forecast, by Product Type 2019 & 2032
- Table 77: Global Hematology Analyzers Industry Revenue Million Forecast, by End User 2019 & 2032
- Table 78: Global Hematology Analyzers Industry Volume K Unit Forecast, by End User 2019 & 2032
- Table 79: Global Hematology Analyzers Industry Revenue Million Forecast, by Country 2019 & 2032
- Table 80: Global Hematology Analyzers Industry Volume K Unit Forecast, by Country 2019 & 2032
- Table 81: Germany Hematology Analyzers Industry Revenue (Million) Forecast, by Application 2019 & 2032
- Table 82: Germany Hematology Analyzers Industry Volume (K Unit) Forecast, by Application 2019 & 2032
- Table 83: United Kingdom Hematology Analyzers Industry Revenue (Million) Forecast, by Application 2019 & 2032
- Table 84: United Kingdom Hematology Analyzers Industry Volume (K Unit) Forecast, by Application 2019 & 2032
- Table 85: France Hematology Analyzers Industry Revenue (Million) Forecast, by Application 2019 & 2032
- Table 86: France Hematology Analyzers Industry Volume (K Unit) Forecast, by Application 2019 & 2032
- Table 87: Italy Hematology Analyzers Industry Revenue (Million) Forecast, by Application 2019 & 2032
- Table 88: Italy Hematology Analyzers Industry Volume (K Unit) Forecast, by Application 2019 & 2032
- Table 89: Spain Hematology Analyzers Industry Revenue (Million) Forecast, by Application 2019 & 2032
- Table 90: Spain Hematology Analyzers Industry Volume (K Unit) Forecast, by Application 2019 & 2032
- Table 91: Rest of Europe Hematology Analyzers Industry Revenue (Million) Forecast, by Application 2019 & 2032
- Table 92: Rest of Europe Hematology Analyzers Industry Volume (K Unit) Forecast, by Application 2019 & 2032
- Table 93: Global Hematology Analyzers Industry Revenue Million Forecast, by Product Type 2019 & 2032
- Table 94: Global Hematology Analyzers Industry Volume K Unit Forecast, by Product Type 2019 & 2032
- Table 95: Global Hematology Analyzers Industry Revenue Million Forecast, by End User 2019 & 2032
- Table 96: Global Hematology Analyzers Industry Volume K Unit Forecast, by End User 2019 & 2032
- Table 97: Global Hematology Analyzers Industry Revenue Million Forecast, by Country 2019 & 2032
- Table 98: Global Hematology Analyzers Industry Volume K Unit Forecast, by Country 2019 & 2032
- Table 99: China Hematology Analyzers Industry Revenue (Million) Forecast, by Application 2019 & 2032
- Table 100: China Hematology Analyzers Industry Volume (K Unit) Forecast, by Application 2019 & 2032
- Table 101: Japan Hematology Analyzers Industry Revenue (Million) Forecast, by Application 2019 & 2032
- Table 102: Japan Hematology Analyzers Industry Volume (K Unit) Forecast, by Application 2019 & 2032
- Table 103: India Hematology Analyzers Industry Revenue (Million) Forecast, by Application 2019 & 2032
- Table 104: India Hematology Analyzers Industry Volume (K Unit) Forecast, by Application 2019 & 2032
- Table 105: Australia Hematology Analyzers Industry Revenue (Million) Forecast, by Application 2019 & 2032
- Table 106: Australia Hematology Analyzers Industry Volume (K Unit) Forecast, by Application 2019 & 2032
- Table 107: South Korea Hematology Analyzers Industry Revenue (Million) Forecast, by Application 2019 & 2032
- Table 108: South Korea Hematology Analyzers Industry Volume (K Unit) Forecast, by Application 2019 & 2032
- Table 109: Rest of Asia Pacific Hematology Analyzers Industry Revenue (Million) Forecast, by Application 2019 & 2032
- Table 110: Rest of Asia Pacific Hematology Analyzers Industry Volume (K Unit) Forecast, by Application 2019 & 2032
- Table 111: Global Hematology Analyzers Industry Revenue Million Forecast, by Product Type 2019 & 2032
- Table 112: Global Hematology Analyzers Industry Volume K Unit Forecast, by Product Type 2019 & 2032
- Table 113: Global Hematology Analyzers Industry Revenue Million Forecast, by End User 2019 & 2032
- Table 114: Global Hematology Analyzers Industry Volume K Unit Forecast, by End User 2019 & 2032
- Table 115: Global Hematology Analyzers Industry Revenue Million Forecast, by Country 2019 & 2032
- Table 116: Global Hematology Analyzers Industry Volume K Unit Forecast, by Country 2019 & 2032
- Table 117: GCC Hematology Analyzers Industry Revenue (Million) Forecast, by Application 2019 & 2032
- Table 118: GCC Hematology Analyzers Industry Volume (K Unit) Forecast, by Application 2019 & 2032
- Table 119: South Africa Hematology Analyzers Industry Revenue (Million) Forecast, by Application 2019 & 2032
- Table 120: South Africa Hematology Analyzers Industry Volume (K Unit) Forecast, by Application 2019 & 2032
- Table 121: Rest of Middle East and Africa Hematology Analyzers Industry Revenue (Million) Forecast, by Application 2019 & 2032
- Table 122: Rest of Middle East and Africa Hematology Analyzers Industry Volume (K Unit) Forecast, by Application 2019 & 2032
- Table 123: Global Hematology Analyzers Industry Revenue Million Forecast, by Product Type 2019 & 2032
- Table 124: Global Hematology Analyzers Industry Volume K Unit Forecast, by Product Type 2019 & 2032
- Table 125: Global Hematology Analyzers Industry Revenue Million Forecast, by End User 2019 & 2032
- Table 126: Global Hematology Analyzers Industry Volume K Unit Forecast, by End User 2019 & 2032
- Table 127: Global Hematology Analyzers Industry Revenue Million Forecast, by Country 2019 & 2032
- Table 128: Global Hematology Analyzers Industry Volume K Unit Forecast, by Country 2019 & 2032
- Table 129: Brazil Hematology Analyzers Industry Revenue (Million) Forecast, by Application 2019 & 2032
- Table 130: Brazil Hematology Analyzers Industry Volume (K Unit) Forecast, by Application 2019 & 2032
- Table 131: Argentina Hematology Analyzers Industry Revenue (Million) Forecast, by Application 2019 & 2032
- Table 132: Argentina Hematology Analyzers Industry Volume (K Unit) Forecast, by Application 2019 & 2032
- Table 133: Rest of South America Hematology Analyzers Industry Revenue (Million) Forecast, by Application 2019 & 2032
- Table 134: Rest of South America Hematology Analyzers Industry Volume (K Unit) Forecast, by Application 2019 & 2032
Frequently Asked Questions
1. What is the projected Compound Annual Growth Rate (CAGR) of the Hematology Analyzers Industry?
The projected CAGR is approximately 7.10%.
2. Which companies are prominent players in the Hematology Analyzers Industry?
Key companies in the market include Stratec Biomedical Systems (DIATRON), Horiba Ltd, Siemens Healthineers, Abbott Laboratories, F Hoffmann-La Roche Ltd, Ortho Clinical Diagnostics, Boule Diagnostics AB, Bio-Rad Laboratories, Beckman Coulter Inc (Danaher Corporation), Sysmex Corporation, Accurex Biomedical Pvt Ltd , Nihon Kohden Corporation.
3. What are the main segments of the Hematology Analyzers Industry?
The market segments include Product Type, End User.
4. Can you provide details about the market size?
The market size is estimated to be USD 6.23 Million as of 2022.
5. What are some drivers contributing to market growth?
Rising Burden of Blood Disorders; Increasing Technological Advancements and Rising Adoption Rates of Automated Hematology Instruments.
6. What are the notable trends driving market growth?
3 Part Hematology Analyzer is the Segment by Instruments Expected to Hold Significant Market Share Over the Forecast Period.
7. Are there any restraints impacting market growth?
High Cost of Hematology Analyzers; Time-consuming and Stringent Rregulatory Policies.
8. Can you provide examples of recent developments in the market?
In May 2022, Nihon Kohden India established a new hematology analyzer reagent factory.
9. What pricing options are available for accessing the report?
Pricing options include single-user, multi-user, and enterprise licenses priced at USD 4750, USD 5250, and USD 8750 respectively.
10. Is the market size provided in terms of value or volume?
The market size is provided in terms of value, measured in Million and volume, measured in K Unit.
11. Are there any specific market keywords associated with the report?
Yes, the market keyword associated with the report is "Hematology Analyzers Industry," which aids in identifying and referencing the specific market segment covered.
12. How do I determine which pricing option suits my needs best?
The pricing options vary based on user requirements and access needs. Individual users may opt for single-user licenses, while businesses requiring broader access may choose multi-user or enterprise licenses for cost-effective access to the report.
13. Are there any additional resources or data provided in the Hematology Analyzers Industry report?
While the report offers comprehensive insights, it's advisable to review the specific contents or supplementary materials provided to ascertain if additional resources or data are available.
14. How can I stay updated on further developments or reports in the Hematology Analyzers Industry?
To stay informed about further developments, trends, and reports in the Hematology Analyzers Industry, consider subscribing to industry newsletters, following relevant companies and organizations, or regularly checking reputable industry news sources and publications.
Methodology
Step 1 - Identification of Relevant Samples Size from Population Database


Step 2 - Approaches for Defining Global Market Size (Value, Volume* & Price*)

Note*: In applicable scenarios
Step 3 - Data Sources
Primary Research
- Web Analytics
- Survey Reports
- Research Institute
- Latest Research Reports
- Opinion Leaders
Secondary Research
- Annual Reports
- White Paper
- Latest Press Release
- Industry Association
- Paid Database
- Investor Presentations

Step 4 - Data Triangulation
Involves using different sources of information in order to increase the validity of a study
These sources are likely to be stakeholders in a program - participants, other researchers, program staff, other community members, and so on.
Then we put all data in single framework & apply various statistical tools to find out the dynamic on the market.
During the analysis stage, feedback from the stakeholder groups would be compared to determine areas of agreement as well as areas of divergence
