

Key Insights
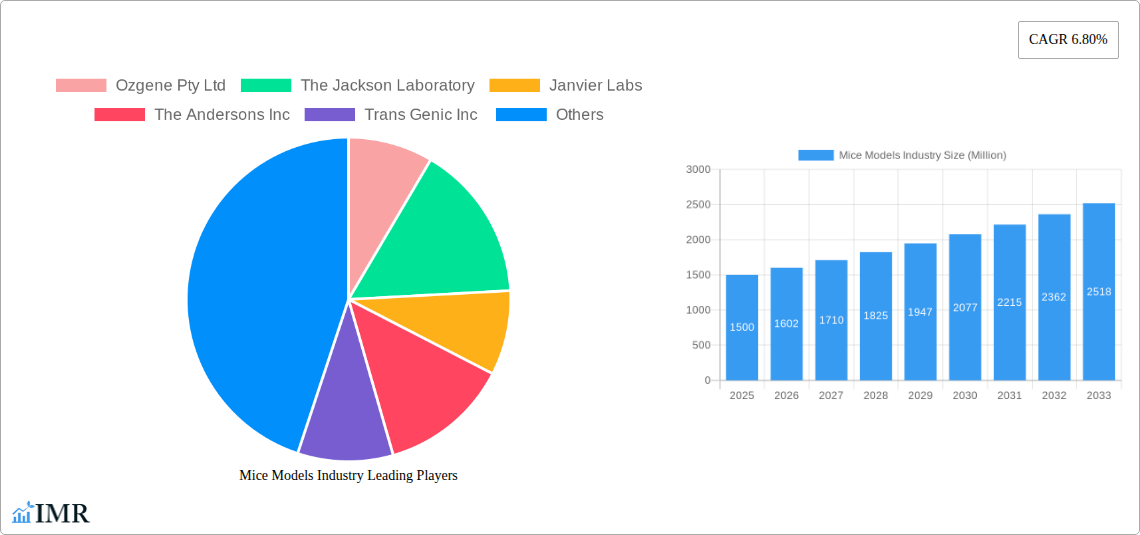
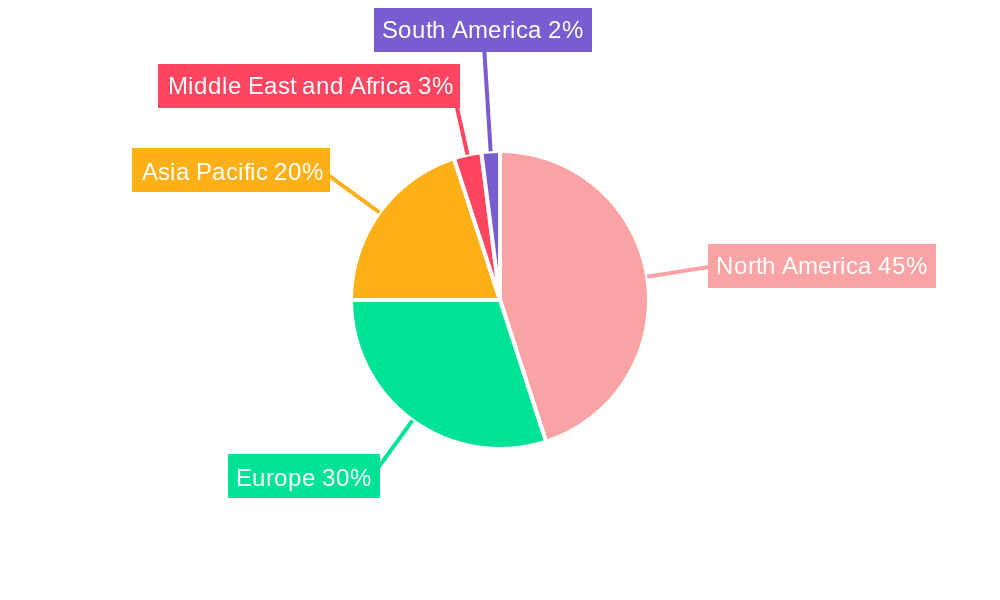
The global mice models market, valued at $1.5 billion in 2025, is projected to experience robust growth, driven by the increasing demand for preclinical research in drug discovery and development. This growth is fueled by several key factors. Firstly, the rising prevalence of chronic diseases such as cancer, cardiovascular diseases, and neurological disorders necessitates extensive preclinical testing, making mice models indispensable. Secondly, advancements in genetic engineering technologies, particularly CRISPR/Cas9, are enabling the creation of highly specific and accurate mouse models, mirroring human diseases with greater fidelity. This leads to more reliable and translatable research outcomes. Finally, the growing outsourcing of research activities to contract research organizations (CROs) and the increasing adoption of sophisticated breeding and cryopreservation techniques further contribute to market expansion. The market is segmented by type (Inbred, Outbred, Genetically Engineered, Hybrid/Congenic, Other), service (Breeding, Cryopreservation, Model in-Licensing, Genetic Testing, Other), technology (CRISPR/CAS, Embryonic Stem Cell Injection, Nuclear Transfer, Other), and application (Oncology, Cardiovascular Studies, Neurology, Other). North America currently holds a significant market share due to the presence of major research institutions and CROs. However, Asia Pacific is expected to witness rapid growth due to increasing investments in life sciences research and development in countries like China and India.
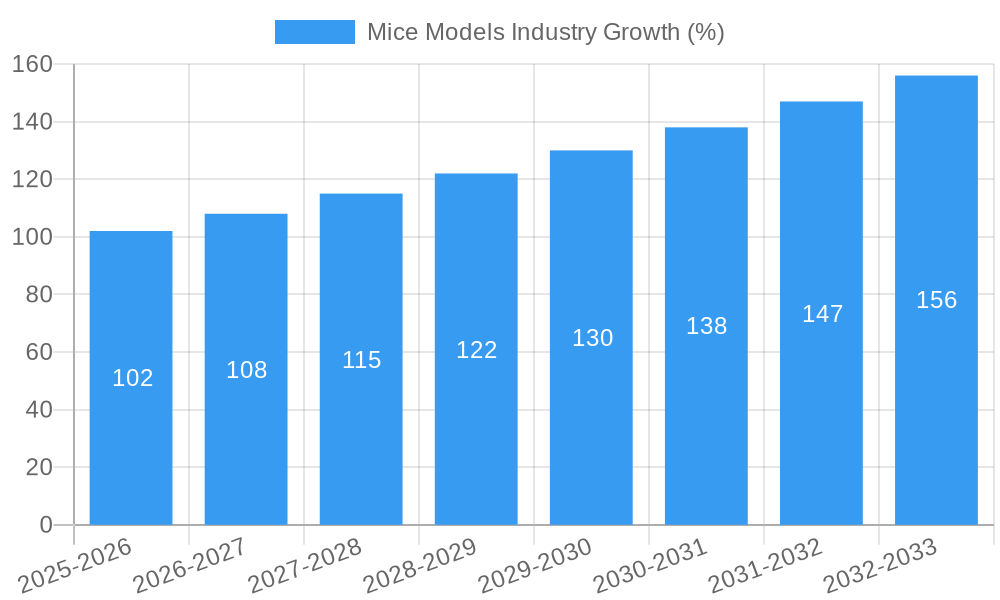
The market's CAGR of 6.80% from 2025 to 2033 signifies a consistently expanding market. While restraints may include ethical considerations surrounding animal research and regulatory hurdles, the overall positive market trajectory is firmly established by the undeniable need for effective preclinical models in advancing biomedical research. Competition among key players like Charles River Laboratories, Taconic Biosciences, and Jackson Laboratory is intensifying, driving innovation and the development of more sophisticated and cost-effective mice models. Future growth will likely be influenced by ongoing technological advancements, expanding therapeutic areas, and government regulations related to animal welfare and research ethics. The market's expansion will necessitate a continuous refinement of ethical guidelines and efficient resource allocation to sustain the responsible development and utilization of mice models.
Mice Models Industry Market Report: 2019-2033
This comprehensive report provides a detailed analysis of the Mice Models industry, encompassing market dynamics, growth trends, regional segmentation, product landscape, key players, and future outlook. The study period spans from 2019 to 2033, with 2025 serving as the base and estimated year. The report leverages extensive market research and data analysis to deliver actionable insights for industry professionals. The market is segmented by type (Inbred Mice, Outbred Mice, Genetically Engineered Mice, Hybrid/Congenic Mice, Other Types), service (Breeding, Cryopreservation, Model in-Licensing, Genetic Testing, Other Services), technology (CRISPR/CAS, Embryonic Stem Cell Injection, Nuclear Transfer, Other Technologies), and application (Oncology, Cardiovascular Studies, Neurology, Other Applications). Key players analyzed include Ozgene Pty Ltd, The Jackson Laboratory, Janvier Labs, The Andersons Inc, Trans Genic Inc, Ingenious Targeting Laboratory, ENVIGO, Charles River Laboratories International Inc, Taconic Biosciences Inc, Genoway, Horizon Discovery Group PLC (Sage Labs Inc), Allentown LLC, Harbour Biomed, and PolyGene.
Mice Models Industry Market Dynamics & Structure
The global mice models market is characterized by a moderately concentrated landscape, with a few large players holding significant market share. Technological innovation, primarily driven by advancements in gene editing technologies like CRISPR/Cas9, is a key growth driver. Stringent regulatory frameworks governing animal research influence market operations, while the availability of alternative research methods presents competitive substitution pressures. The market exhibits substantial end-user diversity, spanning academic research institutions, pharmaceutical companies, and biotechnology firms. M&A activity in the sector remains moderate, with a focus on expanding service offerings and geographical reach. In 2024, approximately xx M&A deals were recorded, resulting in a xx% increase in market concentration.
- Market Concentration: Moderately concentrated, with top 5 players holding approximately 60% market share in 2025.
- Technological Innovation: CRISPR/Cas9, embryonic stem cell injection, and nuclear transfer are key technological drivers.
- Regulatory Framework: Stringent regulations regarding animal welfare and research ethics impact market dynamics.
- Competitive Substitutes: Alternative research methods, such as in silico modeling, pose competitive pressure.
- End-User Demographics: Primarily academic institutions (45%), pharmaceutical companies (35%), and biotech firms (20%).
- M&A Trends: Moderate activity, driven by expansion strategies and service diversification.
Mice Models Industry Growth Trends & Insights
The global mice models market witnessed significant growth during the historical period (2019-2024), expanding from $xx million in 2019 to $xx million in 2024, exhibiting a CAGR of xx%. This growth is attributed to increasing research and development activities in the pharmaceutical and biotechnology sectors, coupled with the rising adoption of genetically engineered mouse models for disease research. Technological advancements in gene editing and other related technologies have further accelerated market growth. The market penetration rate for genetically engineered mice models is expected to increase from xx% in 2025 to xx% by 2033. Consumer behavior shifts towards more precise and efficient research models are driving the demand for advanced mice models, including those with specific genetic modifications. The forecast period (2025-2033) projects continued expansion, with a projected market value of $xx million by 2033 and a CAGR of xx%.
Dominant Regions, Countries, or Segments in Mice Models Industry
North America currently dominates the mice models market, driven by extensive research infrastructure, substantial funding for biomedical research, and the presence of major players in the industry. Within North America, the United States holds the largest market share. Europe follows as a significant market, fueled by increasing investments in life sciences research. Genetically Engineered Mice represents the fastest-growing segment, driven by increasing demand for disease modeling and drug discovery research. Breeding services account for the largest share of the services segment.
- Key Drivers:
- North America: Strong research infrastructure, significant R&D funding.
- Europe: Growing investments in life sciences, expanding pharmaceutical sector.
- Asia-Pacific: Emerging economies, rising healthcare spending.
- Dominant Segments:
- Genetically Engineered Mice: High demand for disease modeling and drug discovery.
- Breeding Services: Largest share within the services segment.
Mice Models Industry Product Landscape
The mice models market offers a diverse range of products, including inbred, outbred, and genetically engineered mice, catering to various research needs. Recent innovations have focused on enhancing the fidelity and accuracy of models, incorporating humanized immune systems or specific genetic mutations relevant to target diseases. The CRISPR/Cas9 technology plays a significant role in developing customized mouse models, enabling precise gene editing and generation of novel models. Key performance metrics include reproducibility, phenotype consistency, and disease modeling accuracy. The unique selling proposition of many products lies in their ability to provide highly specific and reliable models for complex human diseases.
Key Drivers, Barriers & Challenges in Mice Models Industry
Key Drivers: The increasing prevalence of chronic diseases, coupled with the rising demand for effective treatments, drives the growth of the mice models market. Advances in gene editing technologies, such as CRISPR-Cas9, allow for the creation of highly specific and customized models for research purposes, enhancing the market's growth. The expanding pharmaceutical and biotechnology industry, along with increased research funding, contributes significantly to this growth.
Key Barriers and Challenges: Stringent regulatory requirements for animal research pose a significant challenge to market expansion. The high cost associated with developing and maintaining genetically modified mice models can limit accessibility for smaller research organizations. Competition from alternative research methodologies such as in silico modeling also presents a challenge. Estimated regulatory hurdles add xx million USD in extra costs per annum. Supply chain disruptions can also impact the availability and cost of mice models.
Emerging Opportunities in Mice Models Industry
Emerging opportunities include the development of humanized mouse models, which more closely mimic human physiology, allowing for better translation of research findings to humans. There is growing interest in developing models for personalized medicine, enabling researchers to study individual patient responses to disease and treatments. The development of novel mouse models for orphan diseases or rare conditions offers substantial market potential. Expanding applications in areas such as immunology and regenerative medicine provide additional growth avenues.
Growth Accelerators in the Mice Models Industry
Technological advancements in gene editing, particularly CRISPR-Cas9 technology, are primary drivers of long-term growth. Strategic partnerships between research institutions, pharmaceutical companies, and model providers enhance market expansion. The expanding application of mice models to investigate various disease mechanisms and treatment strategies supports sustained growth. Increased investment in research and development, particularly in the field of personalized medicine, strengthens market potential.
Key Players Shaping the Mice Models Industry Market
- Ozgene Pty Ltd
- The Jackson Laboratory
- Janvier Labs
- The Andersons Inc
- Trans Genic Inc
- Ingenious Targeting Laboratory
- ENVIGO
- Charles River Laboratories International Inc
- Taconic Biosciences Inc
- Genoway
- Horizon Discovery Group PLC (Sage Labs Inc)
- Allentown LLC
- Harbour Biomed
- PolyGene
Notable Milestones in Mice Models Industry Sector
- November 2023: Scientists at the UCI MODEL-AD group developed the Trem2R47H NSS mouse model for Alzheimer's disease research.
- February 2024: University of Texas Southwestern Medical Center introduced a new compound extending survival in an ALS mouse model.
In-Depth Mice Models Industry Market Outlook
The mice models market is poised for sustained growth over the forecast period, driven by technological advancements, expanding research activities, and increasing demand for precise disease models. Strategic partnerships and collaborations within the industry are expected to further accelerate market expansion. The emergence of novel applications and the development of more sophisticated mouse models will continue to shape market dynamics. The market's future potential lies in the application of advanced technologies, personalized medicine research, and the investigation of complex diseases, promising significant growth opportunities for industry stakeholders.
Mice Models Industry Segmentation
-
1. Type
- 1.1. Inbred Mice
- 1.2. Outbred Mice
- 1.3. Genetically Engineered Mice
- 1.4. Hybrid/Congenic Mice
- 1.5. Other Types
-
2. Service
- 2.1. Breeding
- 2.2. Cryopreservation
- 2.3. Model in-Licensing
- 2.4. Genetic Testing
- 2.5. Other Services
-
3. Technology
- 3.1. CRISPR/CAS9
- 3.2. Embryonic Stem Cell Injection
- 3.3. Nuclear Transfer
- 3.4. Other Technologies
-
4. Application
- 4.1. Oncology
- 4.2. Cardiovascular Studies
- 4.3. Neurology
- 4.4. Other Applications
Mice Models Industry Segmentation By Geography
-
1. North America
- 1.1. United States
- 1.2. Canada
- 1.3. Mexico
-
2. Europe
- 2.1. Germany
- 2.2. United Kingdom
- 2.3. France
- 2.4. Italy
- 2.5. Spain
- 2.6. Rest of Europe
-
3. Asia Pacific
- 3.1. China
- 3.2. Japan
- 3.3. India
- 3.4. Australia
- 3.5. South Korea
- 3.6. Rest of Asia Pacific
-
4. Middle East and Africa
- 4.1. GCC
- 4.2. South Africa
- 4.3. Rest of Middle East and Africa
-
5. South America
- 5.1. Brazil
- 5.2. Argentina
- 5.3. Rest of South America
Mice Models Industry REPORT HIGHLIGHTS
| Aspects | Details |
|---|---|
| Study Period | 2019-2033 |
| Base Year | 2024 |
| Estimated Year | 2025 |
| Forecast Period | 2025-2033 |
| Historical Period | 2019-2024 |
| Growth Rate | CAGR of 6.80% from 2019-2033 |
| Segmentation |
|
Table of Contents
- 1. Introduction
- 1.1. Research Scope
- 1.2. Market Segmentation
- 1.3. Research Methodology
- 1.4. Definitions and Assumptions
- 2. Executive Summary
- 2.1. Introduction
- 3. Market Dynamics
- 3.1. Introduction
- 3.2. Market Drivers
- 3.2.1. Increasing Innovation in Mice Models; Rising Demand for Personalized Medicine; Growing Pipeline of Pharmaceutical and Biophamraceutical Companies
- 3.3. Market Restrains
- 3.3.1. Alternatives to Animal Testing; Regulations for the Ethical Use of Animals
- 3.4. Market Trends
- 3.4.1. The Oncology Segment is Expected to Hold a Significant Market Share Over the Forecast Period
- 4. Market Factor Analysis
- 4.1. Porters Five Forces
- 4.2. Supply/Value Chain
- 4.3. PESTEL analysis
- 4.4. Market Entropy
- 4.5. Patent/Trademark Analysis
- 5. Global Mice Models Industry Analysis, Insights and Forecast, 2019-2031
- 5.1. Market Analysis, Insights and Forecast - by Type
- 5.1.1. Inbred Mice
- 5.1.2. Outbred Mice
- 5.1.3. Genetically Engineered Mice
- 5.1.4. Hybrid/Congenic Mice
- 5.1.5. Other Types
- 5.2. Market Analysis, Insights and Forecast - by Service
- 5.2.1. Breeding
- 5.2.2. Cryopreservation
- 5.2.3. Model in-Licensing
- 5.2.4. Genetic Testing
- 5.2.5. Other Services
- 5.3. Market Analysis, Insights and Forecast - by Technology
- 5.3.1. CRISPR/CAS9
- 5.3.2. Embryonic Stem Cell Injection
- 5.3.3. Nuclear Transfer
- 5.3.4. Other Technologies
- 5.4. Market Analysis, Insights and Forecast - by Application
- 5.4.1. Oncology
- 5.4.2. Cardiovascular Studies
- 5.4.3. Neurology
- 5.4.4. Other Applications
- 5.5. Market Analysis, Insights and Forecast - by Region
- 5.5.1. North America
- 5.5.2. Europe
- 5.5.3. Asia Pacific
- 5.5.4. Middle East and Africa
- 5.5.5. South America
- 5.1. Market Analysis, Insights and Forecast - by Type
- 6. North America Mice Models Industry Analysis, Insights and Forecast, 2019-2031
- 6.1. Market Analysis, Insights and Forecast - by Type
- 6.1.1. Inbred Mice
- 6.1.2. Outbred Mice
- 6.1.3. Genetically Engineered Mice
- 6.1.4. Hybrid/Congenic Mice
- 6.1.5. Other Types
- 6.2. Market Analysis, Insights and Forecast - by Service
- 6.2.1. Breeding
- 6.2.2. Cryopreservation
- 6.2.3. Model in-Licensing
- 6.2.4. Genetic Testing
- 6.2.5. Other Services
- 6.3. Market Analysis, Insights and Forecast - by Technology
- 6.3.1. CRISPR/CAS9
- 6.3.2. Embryonic Stem Cell Injection
- 6.3.3. Nuclear Transfer
- 6.3.4. Other Technologies
- 6.4. Market Analysis, Insights and Forecast - by Application
- 6.4.1. Oncology
- 6.4.2. Cardiovascular Studies
- 6.4.3. Neurology
- 6.4.4. Other Applications
- 6.1. Market Analysis, Insights and Forecast - by Type
- 7. Europe Mice Models Industry Analysis, Insights and Forecast, 2019-2031
- 7.1. Market Analysis, Insights and Forecast - by Type
- 7.1.1. Inbred Mice
- 7.1.2. Outbred Mice
- 7.1.3. Genetically Engineered Mice
- 7.1.4. Hybrid/Congenic Mice
- 7.1.5. Other Types
- 7.2. Market Analysis, Insights and Forecast - by Service
- 7.2.1. Breeding
- 7.2.2. Cryopreservation
- 7.2.3. Model in-Licensing
- 7.2.4. Genetic Testing
- 7.2.5. Other Services
- 7.3. Market Analysis, Insights and Forecast - by Technology
- 7.3.1. CRISPR/CAS9
- 7.3.2. Embryonic Stem Cell Injection
- 7.3.3. Nuclear Transfer
- 7.3.4. Other Technologies
- 7.4. Market Analysis, Insights and Forecast - by Application
- 7.4.1. Oncology
- 7.4.2. Cardiovascular Studies
- 7.4.3. Neurology
- 7.4.4. Other Applications
- 7.1. Market Analysis, Insights and Forecast - by Type
- 8. Asia Pacific Mice Models Industry Analysis, Insights and Forecast, 2019-2031
- 8.1. Market Analysis, Insights and Forecast - by Type
- 8.1.1. Inbred Mice
- 8.1.2. Outbred Mice
- 8.1.3. Genetically Engineered Mice
- 8.1.4. Hybrid/Congenic Mice
- 8.1.5. Other Types
- 8.2. Market Analysis, Insights and Forecast - by Service
- 8.2.1. Breeding
- 8.2.2. Cryopreservation
- 8.2.3. Model in-Licensing
- 8.2.4. Genetic Testing
- 8.2.5. Other Services
- 8.3. Market Analysis, Insights and Forecast - by Technology
- 8.3.1. CRISPR/CAS9
- 8.3.2. Embryonic Stem Cell Injection
- 8.3.3. Nuclear Transfer
- 8.3.4. Other Technologies
- 8.4. Market Analysis, Insights and Forecast - by Application
- 8.4.1. Oncology
- 8.4.2. Cardiovascular Studies
- 8.4.3. Neurology
- 8.4.4. Other Applications
- 8.1. Market Analysis, Insights and Forecast - by Type
- 9. Middle East and Africa Mice Models Industry Analysis, Insights and Forecast, 2019-2031
- 9.1. Market Analysis, Insights and Forecast - by Type
- 9.1.1. Inbred Mice
- 9.1.2. Outbred Mice
- 9.1.3. Genetically Engineered Mice
- 9.1.4. Hybrid/Congenic Mice
- 9.1.5. Other Types
- 9.2. Market Analysis, Insights and Forecast - by Service
- 9.2.1. Breeding
- 9.2.2. Cryopreservation
- 9.2.3. Model in-Licensing
- 9.2.4. Genetic Testing
- 9.2.5. Other Services
- 9.3. Market Analysis, Insights and Forecast - by Technology
- 9.3.1. CRISPR/CAS9
- 9.3.2. Embryonic Stem Cell Injection
- 9.3.3. Nuclear Transfer
- 9.3.4. Other Technologies
- 9.4. Market Analysis, Insights and Forecast - by Application
- 9.4.1. Oncology
- 9.4.2. Cardiovascular Studies
- 9.4.3. Neurology
- 9.4.4. Other Applications
- 9.1. Market Analysis, Insights and Forecast - by Type
- 10. South America Mice Models Industry Analysis, Insights and Forecast, 2019-2031
- 10.1. Market Analysis, Insights and Forecast - by Type
- 10.1.1. Inbred Mice
- 10.1.2. Outbred Mice
- 10.1.3. Genetically Engineered Mice
- 10.1.4. Hybrid/Congenic Mice
- 10.1.5. Other Types
- 10.2. Market Analysis, Insights and Forecast - by Service
- 10.2.1. Breeding
- 10.2.2. Cryopreservation
- 10.2.3. Model in-Licensing
- 10.2.4. Genetic Testing
- 10.2.5. Other Services
- 10.3. Market Analysis, Insights and Forecast - by Technology
- 10.3.1. CRISPR/CAS9
- 10.3.2. Embryonic Stem Cell Injection
- 10.3.3. Nuclear Transfer
- 10.3.4. Other Technologies
- 10.4. Market Analysis, Insights and Forecast - by Application
- 10.4.1. Oncology
- 10.4.2. Cardiovascular Studies
- 10.4.3. Neurology
- 10.4.4. Other Applications
- 10.1. Market Analysis, Insights and Forecast - by Type
- 11. North America Mice Models Industry Analysis, Insights and Forecast, 2019-2031
- 11.1. Market Analysis, Insights and Forecast - By Country/Sub-region
- 11.1.1 United States
- 11.1.2 Canada
- 11.1.3 Mexico
- 12. Europe Mice Models Industry Analysis, Insights and Forecast, 2019-2031
- 12.1. Market Analysis, Insights and Forecast - By Country/Sub-region
- 12.1.1 Germany
- 12.1.2 United Kingdom
- 12.1.3 France
- 12.1.4 Italy
- 12.1.5 Spain
- 12.1.6 Rest of Europe
- 13. Asia Pacific Mice Models Industry Analysis, Insights and Forecast, 2019-2031
- 13.1. Market Analysis, Insights and Forecast - By Country/Sub-region
- 13.1.1 China
- 13.1.2 Japan
- 13.1.3 India
- 13.1.4 Australia
- 13.1.5 South Korea
- 13.1.6 Rest of Asia Pacific
- 14. Middle East and Africa Mice Models Industry Analysis, Insights and Forecast, 2019-2031
- 14.1. Market Analysis, Insights and Forecast - By Country/Sub-region
- 14.1.1 GCC
- 14.1.2 South Africa
- 14.1.3 Rest of Middle East and Africa
- 15. South America Mice Models Industry Analysis, Insights and Forecast, 2019-2031
- 15.1. Market Analysis, Insights and Forecast - By Country/Sub-region
- 15.1.1 Brazil
- 15.1.2 Argentina
- 15.1.3 Rest of South America
- 16. Competitive Analysis
- 16.1. Global Market Share Analysis 2024
- 16.2. Company Profiles
- 16.2.1 Ozgene Pty Ltd
- 16.2.1.1. Overview
- 16.2.1.2. Products
- 16.2.1.3. SWOT Analysis
- 16.2.1.4. Recent Developments
- 16.2.1.5. Financials (Based on Availability)
- 16.2.2 The Jackson Laboratory
- 16.2.2.1. Overview
- 16.2.2.2. Products
- 16.2.2.3. SWOT Analysis
- 16.2.2.4. Recent Developments
- 16.2.2.5. Financials (Based on Availability)
- 16.2.3 Janvier Labs
- 16.2.3.1. Overview
- 16.2.3.2. Products
- 16.2.3.3. SWOT Analysis
- 16.2.3.4. Recent Developments
- 16.2.3.5. Financials (Based on Availability)
- 16.2.4 The Andersons Inc
- 16.2.4.1. Overview
- 16.2.4.2. Products
- 16.2.4.3. SWOT Analysis
- 16.2.4.4. Recent Developments
- 16.2.4.5. Financials (Based on Availability)
- 16.2.5 Trans Genic Inc
- 16.2.5.1. Overview
- 16.2.5.2. Products
- 16.2.5.3. SWOT Analysis
- 16.2.5.4. Recent Developments
- 16.2.5.5. Financials (Based on Availability)
- 16.2.6 Ingenious Targeting Laboratory
- 16.2.6.1. Overview
- 16.2.6.2. Products
- 16.2.6.3. SWOT Analysis
- 16.2.6.4. Recent Developments
- 16.2.6.5. Financials (Based on Availability)
- 16.2.7 ENVIGO
- 16.2.7.1. Overview
- 16.2.7.2. Products
- 16.2.7.3. SWOT Analysis
- 16.2.7.4. Recent Developments
- 16.2.7.5. Financials (Based on Availability)
- 16.2.8 Charles River Laboratories International Inc
- 16.2.8.1. Overview
- 16.2.8.2. Products
- 16.2.8.3. SWOT Analysis
- 16.2.8.4. Recent Developments
- 16.2.8.5. Financials (Based on Availability)
- 16.2.9 Taconic Biosciences Inc
- 16.2.9.1. Overview
- 16.2.9.2. Products
- 16.2.9.3. SWOT Analysis
- 16.2.9.4. Recent Developments
- 16.2.9.5. Financials (Based on Availability)
- 16.2.10 Genoway
- 16.2.10.1. Overview
- 16.2.10.2. Products
- 16.2.10.3. SWOT Analysis
- 16.2.10.4. Recent Developments
- 16.2.10.5. Financials (Based on Availability)
- 16.2.11 Horizon Discovery Group PLC (Sage Labs Inc )
- 16.2.11.1. Overview
- 16.2.11.2. Products
- 16.2.11.3. SWOT Analysis
- 16.2.11.4. Recent Developments
- 16.2.11.5. Financials (Based on Availability)
- 16.2.12 Allentown LLC
- 16.2.12.1. Overview
- 16.2.12.2. Products
- 16.2.12.3. SWOT Analysis
- 16.2.12.4. Recent Developments
- 16.2.12.5. Financials (Based on Availability)
- 16.2.13 Harbour Biomed
- 16.2.13.1. Overview
- 16.2.13.2. Products
- 16.2.13.3. SWOT Analysis
- 16.2.13.4. Recent Developments
- 16.2.13.5. Financials (Based on Availability)
- 16.2.14 PolyGene
- 16.2.14.1. Overview
- 16.2.14.2. Products
- 16.2.14.3. SWOT Analysis
- 16.2.14.4. Recent Developments
- 16.2.14.5. Financials (Based on Availability)
- 16.2.1 Ozgene Pty Ltd
List of Figures
- Figure 1: Global Mice Models Industry Revenue Breakdown (Million, %) by Region 2024 & 2032
- Figure 2: Global Mice Models Industry Volume Breakdown (K Unit, %) by Region 2024 & 2032
- Figure 3: North America Mice Models Industry Revenue (Million), by Country 2024 & 2032
- Figure 4: North America Mice Models Industry Volume (K Unit), by Country 2024 & 2032
- Figure 5: North America Mice Models Industry Revenue Share (%), by Country 2024 & 2032
- Figure 6: North America Mice Models Industry Volume Share (%), by Country 2024 & 2032
- Figure 7: Europe Mice Models Industry Revenue (Million), by Country 2024 & 2032
- Figure 8: Europe Mice Models Industry Volume (K Unit), by Country 2024 & 2032
- Figure 9: Europe Mice Models Industry Revenue Share (%), by Country 2024 & 2032
- Figure 10: Europe Mice Models Industry Volume Share (%), by Country 2024 & 2032
- Figure 11: Asia Pacific Mice Models Industry Revenue (Million), by Country 2024 & 2032
- Figure 12: Asia Pacific Mice Models Industry Volume (K Unit), by Country 2024 & 2032
- Figure 13: Asia Pacific Mice Models Industry Revenue Share (%), by Country 2024 & 2032
- Figure 14: Asia Pacific Mice Models Industry Volume Share (%), by Country 2024 & 2032
- Figure 15: Middle East and Africa Mice Models Industry Revenue (Million), by Country 2024 & 2032
- Figure 16: Middle East and Africa Mice Models Industry Volume (K Unit), by Country 2024 & 2032
- Figure 17: Middle East and Africa Mice Models Industry Revenue Share (%), by Country 2024 & 2032
- Figure 18: Middle East and Africa Mice Models Industry Volume Share (%), by Country 2024 & 2032
- Figure 19: South America Mice Models Industry Revenue (Million), by Country 2024 & 2032
- Figure 20: South America Mice Models Industry Volume (K Unit), by Country 2024 & 2032
- Figure 21: South America Mice Models Industry Revenue Share (%), by Country 2024 & 2032
- Figure 22: South America Mice Models Industry Volume Share (%), by Country 2024 & 2032
- Figure 23: North America Mice Models Industry Revenue (Million), by Type 2024 & 2032
- Figure 24: North America Mice Models Industry Volume (K Unit), by Type 2024 & 2032
- Figure 25: North America Mice Models Industry Revenue Share (%), by Type 2024 & 2032
- Figure 26: North America Mice Models Industry Volume Share (%), by Type 2024 & 2032
- Figure 27: North America Mice Models Industry Revenue (Million), by Service 2024 & 2032
- Figure 28: North America Mice Models Industry Volume (K Unit), by Service 2024 & 2032
- Figure 29: North America Mice Models Industry Revenue Share (%), by Service 2024 & 2032
- Figure 30: North America Mice Models Industry Volume Share (%), by Service 2024 & 2032
- Figure 31: North America Mice Models Industry Revenue (Million), by Technology 2024 & 2032
- Figure 32: North America Mice Models Industry Volume (K Unit), by Technology 2024 & 2032
- Figure 33: North America Mice Models Industry Revenue Share (%), by Technology 2024 & 2032
- Figure 34: North America Mice Models Industry Volume Share (%), by Technology 2024 & 2032
- Figure 35: North America Mice Models Industry Revenue (Million), by Application 2024 & 2032
- Figure 36: North America Mice Models Industry Volume (K Unit), by Application 2024 & 2032
- Figure 37: North America Mice Models Industry Revenue Share (%), by Application 2024 & 2032
- Figure 38: North America Mice Models Industry Volume Share (%), by Application 2024 & 2032
- Figure 39: North America Mice Models Industry Revenue (Million), by Country 2024 & 2032
- Figure 40: North America Mice Models Industry Volume (K Unit), by Country 2024 & 2032
- Figure 41: North America Mice Models Industry Revenue Share (%), by Country 2024 & 2032
- Figure 42: North America Mice Models Industry Volume Share (%), by Country 2024 & 2032
- Figure 43: Europe Mice Models Industry Revenue (Million), by Type 2024 & 2032
- Figure 44: Europe Mice Models Industry Volume (K Unit), by Type 2024 & 2032
- Figure 45: Europe Mice Models Industry Revenue Share (%), by Type 2024 & 2032
- Figure 46: Europe Mice Models Industry Volume Share (%), by Type 2024 & 2032
- Figure 47: Europe Mice Models Industry Revenue (Million), by Service 2024 & 2032
- Figure 48: Europe Mice Models Industry Volume (K Unit), by Service 2024 & 2032
- Figure 49: Europe Mice Models Industry Revenue Share (%), by Service 2024 & 2032
- Figure 50: Europe Mice Models Industry Volume Share (%), by Service 2024 & 2032
- Figure 51: Europe Mice Models Industry Revenue (Million), by Technology 2024 & 2032
- Figure 52: Europe Mice Models Industry Volume (K Unit), by Technology 2024 & 2032
- Figure 53: Europe Mice Models Industry Revenue Share (%), by Technology 2024 & 2032
- Figure 54: Europe Mice Models Industry Volume Share (%), by Technology 2024 & 2032
- Figure 55: Europe Mice Models Industry Revenue (Million), by Application 2024 & 2032
- Figure 56: Europe Mice Models Industry Volume (K Unit), by Application 2024 & 2032
- Figure 57: Europe Mice Models Industry Revenue Share (%), by Application 2024 & 2032
- Figure 58: Europe Mice Models Industry Volume Share (%), by Application 2024 & 2032
- Figure 59: Europe Mice Models Industry Revenue (Million), by Country 2024 & 2032
- Figure 60: Europe Mice Models Industry Volume (K Unit), by Country 2024 & 2032
- Figure 61: Europe Mice Models Industry Revenue Share (%), by Country 2024 & 2032
- Figure 62: Europe Mice Models Industry Volume Share (%), by Country 2024 & 2032
- Figure 63: Asia Pacific Mice Models Industry Revenue (Million), by Type 2024 & 2032
- Figure 64: Asia Pacific Mice Models Industry Volume (K Unit), by Type 2024 & 2032
- Figure 65: Asia Pacific Mice Models Industry Revenue Share (%), by Type 2024 & 2032
- Figure 66: Asia Pacific Mice Models Industry Volume Share (%), by Type 2024 & 2032
- Figure 67: Asia Pacific Mice Models Industry Revenue (Million), by Service 2024 & 2032
- Figure 68: Asia Pacific Mice Models Industry Volume (K Unit), by Service 2024 & 2032
- Figure 69: Asia Pacific Mice Models Industry Revenue Share (%), by Service 2024 & 2032
- Figure 70: Asia Pacific Mice Models Industry Volume Share (%), by Service 2024 & 2032
- Figure 71: Asia Pacific Mice Models Industry Revenue (Million), by Technology 2024 & 2032
- Figure 72: Asia Pacific Mice Models Industry Volume (K Unit), by Technology 2024 & 2032
- Figure 73: Asia Pacific Mice Models Industry Revenue Share (%), by Technology 2024 & 2032
- Figure 74: Asia Pacific Mice Models Industry Volume Share (%), by Technology 2024 & 2032
- Figure 75: Asia Pacific Mice Models Industry Revenue (Million), by Application 2024 & 2032
- Figure 76: Asia Pacific Mice Models Industry Volume (K Unit), by Application 2024 & 2032
- Figure 77: Asia Pacific Mice Models Industry Revenue Share (%), by Application 2024 & 2032
- Figure 78: Asia Pacific Mice Models Industry Volume Share (%), by Application 2024 & 2032
- Figure 79: Asia Pacific Mice Models Industry Revenue (Million), by Country 2024 & 2032
- Figure 80: Asia Pacific Mice Models Industry Volume (K Unit), by Country 2024 & 2032
- Figure 81: Asia Pacific Mice Models Industry Revenue Share (%), by Country 2024 & 2032
- Figure 82: Asia Pacific Mice Models Industry Volume Share (%), by Country 2024 & 2032
- Figure 83: Middle East and Africa Mice Models Industry Revenue (Million), by Type 2024 & 2032
- Figure 84: Middle East and Africa Mice Models Industry Volume (K Unit), by Type 2024 & 2032
- Figure 85: Middle East and Africa Mice Models Industry Revenue Share (%), by Type 2024 & 2032
- Figure 86: Middle East and Africa Mice Models Industry Volume Share (%), by Type 2024 & 2032
- Figure 87: Middle East and Africa Mice Models Industry Revenue (Million), by Service 2024 & 2032
- Figure 88: Middle East and Africa Mice Models Industry Volume (K Unit), by Service 2024 & 2032
- Figure 89: Middle East and Africa Mice Models Industry Revenue Share (%), by Service 2024 & 2032
- Figure 90: Middle East and Africa Mice Models Industry Volume Share (%), by Service 2024 & 2032
- Figure 91: Middle East and Africa Mice Models Industry Revenue (Million), by Technology 2024 & 2032
- Figure 92: Middle East and Africa Mice Models Industry Volume (K Unit), by Technology 2024 & 2032
- Figure 93: Middle East and Africa Mice Models Industry Revenue Share (%), by Technology 2024 & 2032
- Figure 94: Middle East and Africa Mice Models Industry Volume Share (%), by Technology 2024 & 2032
- Figure 95: Middle East and Africa Mice Models Industry Revenue (Million), by Application 2024 & 2032
- Figure 96: Middle East and Africa Mice Models Industry Volume (K Unit), by Application 2024 & 2032
- Figure 97: Middle East and Africa Mice Models Industry Revenue Share (%), by Application 2024 & 2032
- Figure 98: Middle East and Africa Mice Models Industry Volume Share (%), by Application 2024 & 2032
- Figure 99: Middle East and Africa Mice Models Industry Revenue (Million), by Country 2024 & 2032
- Figure 100: Middle East and Africa Mice Models Industry Volume (K Unit), by Country 2024 & 2032
- Figure 101: Middle East and Africa Mice Models Industry Revenue Share (%), by Country 2024 & 2032
- Figure 102: Middle East and Africa Mice Models Industry Volume Share (%), by Country 2024 & 2032
- Figure 103: South America Mice Models Industry Revenue (Million), by Type 2024 & 2032
- Figure 104: South America Mice Models Industry Volume (K Unit), by Type 2024 & 2032
- Figure 105: South America Mice Models Industry Revenue Share (%), by Type 2024 & 2032
- Figure 106: South America Mice Models Industry Volume Share (%), by Type 2024 & 2032
- Figure 107: South America Mice Models Industry Revenue (Million), by Service 2024 & 2032
- Figure 108: South America Mice Models Industry Volume (K Unit), by Service 2024 & 2032
- Figure 109: South America Mice Models Industry Revenue Share (%), by Service 2024 & 2032
- Figure 110: South America Mice Models Industry Volume Share (%), by Service 2024 & 2032
- Figure 111: South America Mice Models Industry Revenue (Million), by Technology 2024 & 2032
- Figure 112: South America Mice Models Industry Volume (K Unit), by Technology 2024 & 2032
- Figure 113: South America Mice Models Industry Revenue Share (%), by Technology 2024 & 2032
- Figure 114: South America Mice Models Industry Volume Share (%), by Technology 2024 & 2032
- Figure 115: South America Mice Models Industry Revenue (Million), by Application 2024 & 2032
- Figure 116: South America Mice Models Industry Volume (K Unit), by Application 2024 & 2032
- Figure 117: South America Mice Models Industry Revenue Share (%), by Application 2024 & 2032
- Figure 118: South America Mice Models Industry Volume Share (%), by Application 2024 & 2032
- Figure 119: South America Mice Models Industry Revenue (Million), by Country 2024 & 2032
- Figure 120: South America Mice Models Industry Volume (K Unit), by Country 2024 & 2032
- Figure 121: South America Mice Models Industry Revenue Share (%), by Country 2024 & 2032
- Figure 122: South America Mice Models Industry Volume Share (%), by Country 2024 & 2032
List of Tables
- Table 1: Global Mice Models Industry Revenue Million Forecast, by Region 2019 & 2032
- Table 2: Global Mice Models Industry Volume K Unit Forecast, by Region 2019 & 2032
- Table 3: Global Mice Models Industry Revenue Million Forecast, by Type 2019 & 2032
- Table 4: Global Mice Models Industry Volume K Unit Forecast, by Type 2019 & 2032
- Table 5: Global Mice Models Industry Revenue Million Forecast, by Service 2019 & 2032
- Table 6: Global Mice Models Industry Volume K Unit Forecast, by Service 2019 & 2032
- Table 7: Global Mice Models Industry Revenue Million Forecast, by Technology 2019 & 2032
- Table 8: Global Mice Models Industry Volume K Unit Forecast, by Technology 2019 & 2032
- Table 9: Global Mice Models Industry Revenue Million Forecast, by Application 2019 & 2032
- Table 10: Global Mice Models Industry Volume K Unit Forecast, by Application 2019 & 2032
- Table 11: Global Mice Models Industry Revenue Million Forecast, by Region 2019 & 2032
- Table 12: Global Mice Models Industry Volume K Unit Forecast, by Region 2019 & 2032
- Table 13: Global Mice Models Industry Revenue Million Forecast, by Country 2019 & 2032
- Table 14: Global Mice Models Industry Volume K Unit Forecast, by Country 2019 & 2032
- Table 15: United States Mice Models Industry Revenue (Million) Forecast, by Application 2019 & 2032
- Table 16: United States Mice Models Industry Volume (K Unit) Forecast, by Application 2019 & 2032
- Table 17: Canada Mice Models Industry Revenue (Million) Forecast, by Application 2019 & 2032
- Table 18: Canada Mice Models Industry Volume (K Unit) Forecast, by Application 2019 & 2032
- Table 19: Mexico Mice Models Industry Revenue (Million) Forecast, by Application 2019 & 2032
- Table 20: Mexico Mice Models Industry Volume (K Unit) Forecast, by Application 2019 & 2032
- Table 21: Global Mice Models Industry Revenue Million Forecast, by Country 2019 & 2032
- Table 22: Global Mice Models Industry Volume K Unit Forecast, by Country 2019 & 2032
- Table 23: Germany Mice Models Industry Revenue (Million) Forecast, by Application 2019 & 2032
- Table 24: Germany Mice Models Industry Volume (K Unit) Forecast, by Application 2019 & 2032
- Table 25: United Kingdom Mice Models Industry Revenue (Million) Forecast, by Application 2019 & 2032
- Table 26: United Kingdom Mice Models Industry Volume (K Unit) Forecast, by Application 2019 & 2032
- Table 27: France Mice Models Industry Revenue (Million) Forecast, by Application 2019 & 2032
- Table 28: France Mice Models Industry Volume (K Unit) Forecast, by Application 2019 & 2032
- Table 29: Italy Mice Models Industry Revenue (Million) Forecast, by Application 2019 & 2032
- Table 30: Italy Mice Models Industry Volume (K Unit) Forecast, by Application 2019 & 2032
- Table 31: Spain Mice Models Industry Revenue (Million) Forecast, by Application 2019 & 2032
- Table 32: Spain Mice Models Industry Volume (K Unit) Forecast, by Application 2019 & 2032
- Table 33: Rest of Europe Mice Models Industry Revenue (Million) Forecast, by Application 2019 & 2032
- Table 34: Rest of Europe Mice Models Industry Volume (K Unit) Forecast, by Application 2019 & 2032
- Table 35: Global Mice Models Industry Revenue Million Forecast, by Country 2019 & 2032
- Table 36: Global Mice Models Industry Volume K Unit Forecast, by Country 2019 & 2032
- Table 37: China Mice Models Industry Revenue (Million) Forecast, by Application 2019 & 2032
- Table 38: China Mice Models Industry Volume (K Unit) Forecast, by Application 2019 & 2032
- Table 39: Japan Mice Models Industry Revenue (Million) Forecast, by Application 2019 & 2032
- Table 40: Japan Mice Models Industry Volume (K Unit) Forecast, by Application 2019 & 2032
- Table 41: India Mice Models Industry Revenue (Million) Forecast, by Application 2019 & 2032
- Table 42: India Mice Models Industry Volume (K Unit) Forecast, by Application 2019 & 2032
- Table 43: Australia Mice Models Industry Revenue (Million) Forecast, by Application 2019 & 2032
- Table 44: Australia Mice Models Industry Volume (K Unit) Forecast, by Application 2019 & 2032
- Table 45: South Korea Mice Models Industry Revenue (Million) Forecast, by Application 2019 & 2032
- Table 46: South Korea Mice Models Industry Volume (K Unit) Forecast, by Application 2019 & 2032
- Table 47: Rest of Asia Pacific Mice Models Industry Revenue (Million) Forecast, by Application 2019 & 2032
- Table 48: Rest of Asia Pacific Mice Models Industry Volume (K Unit) Forecast, by Application 2019 & 2032
- Table 49: Global Mice Models Industry Revenue Million Forecast, by Country 2019 & 2032
- Table 50: Global Mice Models Industry Volume K Unit Forecast, by Country 2019 & 2032
- Table 51: GCC Mice Models Industry Revenue (Million) Forecast, by Application 2019 & 2032
- Table 52: GCC Mice Models Industry Volume (K Unit) Forecast, by Application 2019 & 2032
- Table 53: South Africa Mice Models Industry Revenue (Million) Forecast, by Application 2019 & 2032
- Table 54: South Africa Mice Models Industry Volume (K Unit) Forecast, by Application 2019 & 2032
- Table 55: Rest of Middle East and Africa Mice Models Industry Revenue (Million) Forecast, by Application 2019 & 2032
- Table 56: Rest of Middle East and Africa Mice Models Industry Volume (K Unit) Forecast, by Application 2019 & 2032
- Table 57: Global Mice Models Industry Revenue Million Forecast, by Country 2019 & 2032
- Table 58: Global Mice Models Industry Volume K Unit Forecast, by Country 2019 & 2032
- Table 59: Brazil Mice Models Industry Revenue (Million) Forecast, by Application 2019 & 2032
- Table 60: Brazil Mice Models Industry Volume (K Unit) Forecast, by Application 2019 & 2032
- Table 61: Argentina Mice Models Industry Revenue (Million) Forecast, by Application 2019 & 2032
- Table 62: Argentina Mice Models Industry Volume (K Unit) Forecast, by Application 2019 & 2032
- Table 63: Rest of South America Mice Models Industry Revenue (Million) Forecast, by Application 2019 & 2032
- Table 64: Rest of South America Mice Models Industry Volume (K Unit) Forecast, by Application 2019 & 2032
- Table 65: Global Mice Models Industry Revenue Million Forecast, by Type 2019 & 2032
- Table 66: Global Mice Models Industry Volume K Unit Forecast, by Type 2019 & 2032
- Table 67: Global Mice Models Industry Revenue Million Forecast, by Service 2019 & 2032
- Table 68: Global Mice Models Industry Volume K Unit Forecast, by Service 2019 & 2032
- Table 69: Global Mice Models Industry Revenue Million Forecast, by Technology 2019 & 2032
- Table 70: Global Mice Models Industry Volume K Unit Forecast, by Technology 2019 & 2032
- Table 71: Global Mice Models Industry Revenue Million Forecast, by Application 2019 & 2032
- Table 72: Global Mice Models Industry Volume K Unit Forecast, by Application 2019 & 2032
- Table 73: Global Mice Models Industry Revenue Million Forecast, by Country 2019 & 2032
- Table 74: Global Mice Models Industry Volume K Unit Forecast, by Country 2019 & 2032
- Table 75: United States Mice Models Industry Revenue (Million) Forecast, by Application 2019 & 2032
- Table 76: United States Mice Models Industry Volume (K Unit) Forecast, by Application 2019 & 2032
- Table 77: Canada Mice Models Industry Revenue (Million) Forecast, by Application 2019 & 2032
- Table 78: Canada Mice Models Industry Volume (K Unit) Forecast, by Application 2019 & 2032
- Table 79: Mexico Mice Models Industry Revenue (Million) Forecast, by Application 2019 & 2032
- Table 80: Mexico Mice Models Industry Volume (K Unit) Forecast, by Application 2019 & 2032
- Table 81: Global Mice Models Industry Revenue Million Forecast, by Type 2019 & 2032
- Table 82: Global Mice Models Industry Volume K Unit Forecast, by Type 2019 & 2032
- Table 83: Global Mice Models Industry Revenue Million Forecast, by Service 2019 & 2032
- Table 84: Global Mice Models Industry Volume K Unit Forecast, by Service 2019 & 2032
- Table 85: Global Mice Models Industry Revenue Million Forecast, by Technology 2019 & 2032
- Table 86: Global Mice Models Industry Volume K Unit Forecast, by Technology 2019 & 2032
- Table 87: Global Mice Models Industry Revenue Million Forecast, by Application 2019 & 2032
- Table 88: Global Mice Models Industry Volume K Unit Forecast, by Application 2019 & 2032
- Table 89: Global Mice Models Industry Revenue Million Forecast, by Country 2019 & 2032
- Table 90: Global Mice Models Industry Volume K Unit Forecast, by Country 2019 & 2032
- Table 91: Germany Mice Models Industry Revenue (Million) Forecast, by Application 2019 & 2032
- Table 92: Germany Mice Models Industry Volume (K Unit) Forecast, by Application 2019 & 2032
- Table 93: United Kingdom Mice Models Industry Revenue (Million) Forecast, by Application 2019 & 2032
- Table 94: United Kingdom Mice Models Industry Volume (K Unit) Forecast, by Application 2019 & 2032
- Table 95: France Mice Models Industry Revenue (Million) Forecast, by Application 2019 & 2032
- Table 96: France Mice Models Industry Volume (K Unit) Forecast, by Application 2019 & 2032
- Table 97: Italy Mice Models Industry Revenue (Million) Forecast, by Application 2019 & 2032
- Table 98: Italy Mice Models Industry Volume (K Unit) Forecast, by Application 2019 & 2032
- Table 99: Spain Mice Models Industry Revenue (Million) Forecast, by Application 2019 & 2032
- Table 100: Spain Mice Models Industry Volume (K Unit) Forecast, by Application 2019 & 2032
- Table 101: Rest of Europe Mice Models Industry Revenue (Million) Forecast, by Application 2019 & 2032
- Table 102: Rest of Europe Mice Models Industry Volume (K Unit) Forecast, by Application 2019 & 2032
- Table 103: Global Mice Models Industry Revenue Million Forecast, by Type 2019 & 2032
- Table 104: Global Mice Models Industry Volume K Unit Forecast, by Type 2019 & 2032
- Table 105: Global Mice Models Industry Revenue Million Forecast, by Service 2019 & 2032
- Table 106: Global Mice Models Industry Volume K Unit Forecast, by Service 2019 & 2032
- Table 107: Global Mice Models Industry Revenue Million Forecast, by Technology 2019 & 2032
- Table 108: Global Mice Models Industry Volume K Unit Forecast, by Technology 2019 & 2032
- Table 109: Global Mice Models Industry Revenue Million Forecast, by Application 2019 & 2032
- Table 110: Global Mice Models Industry Volume K Unit Forecast, by Application 2019 & 2032
- Table 111: Global Mice Models Industry Revenue Million Forecast, by Country 2019 & 2032
- Table 112: Global Mice Models Industry Volume K Unit Forecast, by Country 2019 & 2032
- Table 113: China Mice Models Industry Revenue (Million) Forecast, by Application 2019 & 2032
- Table 114: China Mice Models Industry Volume (K Unit) Forecast, by Application 2019 & 2032
- Table 115: Japan Mice Models Industry Revenue (Million) Forecast, by Application 2019 & 2032
- Table 116: Japan Mice Models Industry Volume (K Unit) Forecast, by Application 2019 & 2032
- Table 117: India Mice Models Industry Revenue (Million) Forecast, by Application 2019 & 2032
- Table 118: India Mice Models Industry Volume (K Unit) Forecast, by Application 2019 & 2032
- Table 119: Australia Mice Models Industry Revenue (Million) Forecast, by Application 2019 & 2032
- Table 120: Australia Mice Models Industry Volume (K Unit) Forecast, by Application 2019 & 2032
- Table 121: South Korea Mice Models Industry Revenue (Million) Forecast, by Application 2019 & 2032
- Table 122: South Korea Mice Models Industry Volume (K Unit) Forecast, by Application 2019 & 2032
- Table 123: Rest of Asia Pacific Mice Models Industry Revenue (Million) Forecast, by Application 2019 & 2032
- Table 124: Rest of Asia Pacific Mice Models Industry Volume (K Unit) Forecast, by Application 2019 & 2032
- Table 125: Global Mice Models Industry Revenue Million Forecast, by Type 2019 & 2032
- Table 126: Global Mice Models Industry Volume K Unit Forecast, by Type 2019 & 2032
- Table 127: Global Mice Models Industry Revenue Million Forecast, by Service 2019 & 2032
- Table 128: Global Mice Models Industry Volume K Unit Forecast, by Service 2019 & 2032
- Table 129: Global Mice Models Industry Revenue Million Forecast, by Technology 2019 & 2032
- Table 130: Global Mice Models Industry Volume K Unit Forecast, by Technology 2019 & 2032
- Table 131: Global Mice Models Industry Revenue Million Forecast, by Application 2019 & 2032
- Table 132: Global Mice Models Industry Volume K Unit Forecast, by Application 2019 & 2032
- Table 133: Global Mice Models Industry Revenue Million Forecast, by Country 2019 & 2032
- Table 134: Global Mice Models Industry Volume K Unit Forecast, by Country 2019 & 2032
- Table 135: GCC Mice Models Industry Revenue (Million) Forecast, by Application 2019 & 2032
- Table 136: GCC Mice Models Industry Volume (K Unit) Forecast, by Application 2019 & 2032
- Table 137: South Africa Mice Models Industry Revenue (Million) Forecast, by Application 2019 & 2032
- Table 138: South Africa Mice Models Industry Volume (K Unit) Forecast, by Application 2019 & 2032
- Table 139: Rest of Middle East and Africa Mice Models Industry Revenue (Million) Forecast, by Application 2019 & 2032
- Table 140: Rest of Middle East and Africa Mice Models Industry Volume (K Unit) Forecast, by Application 2019 & 2032
- Table 141: Global Mice Models Industry Revenue Million Forecast, by Type 2019 & 2032
- Table 142: Global Mice Models Industry Volume K Unit Forecast, by Type 2019 & 2032
- Table 143: Global Mice Models Industry Revenue Million Forecast, by Service 2019 & 2032
- Table 144: Global Mice Models Industry Volume K Unit Forecast, by Service 2019 & 2032
- Table 145: Global Mice Models Industry Revenue Million Forecast, by Technology 2019 & 2032
- Table 146: Global Mice Models Industry Volume K Unit Forecast, by Technology 2019 & 2032
- Table 147: Global Mice Models Industry Revenue Million Forecast, by Application 2019 & 2032
- Table 148: Global Mice Models Industry Volume K Unit Forecast, by Application 2019 & 2032
- Table 149: Global Mice Models Industry Revenue Million Forecast, by Country 2019 & 2032
- Table 150: Global Mice Models Industry Volume K Unit Forecast, by Country 2019 & 2032
- Table 151: Brazil Mice Models Industry Revenue (Million) Forecast, by Application 2019 & 2032
- Table 152: Brazil Mice Models Industry Volume (K Unit) Forecast, by Application 2019 & 2032
- Table 153: Argentina Mice Models Industry Revenue (Million) Forecast, by Application 2019 & 2032
- Table 154: Argentina Mice Models Industry Volume (K Unit) Forecast, by Application 2019 & 2032
- Table 155: Rest of South America Mice Models Industry Revenue (Million) Forecast, by Application 2019 & 2032
- Table 156: Rest of South America Mice Models Industry Volume (K Unit) Forecast, by Application 2019 & 2032
Frequently Asked Questions
1. What is the projected Compound Annual Growth Rate (CAGR) of the Mice Models Industry?
The projected CAGR is approximately 6.80%.
2. Which companies are prominent players in the Mice Models Industry?
Key companies in the market include Ozgene Pty Ltd, The Jackson Laboratory, Janvier Labs, The Andersons Inc, Trans Genic Inc , Ingenious Targeting Laboratory, ENVIGO, Charles River Laboratories International Inc, Taconic Biosciences Inc, Genoway, Horizon Discovery Group PLC (Sage Labs Inc ), Allentown LLC, Harbour Biomed, PolyGene.
3. What are the main segments of the Mice Models Industry?
The market segments include Type, Service, Technology, Application.
4. Can you provide details about the market size?
The market size is estimated to be USD 1.5 Million as of 2022.
5. What are some drivers contributing to market growth?
Increasing Innovation in Mice Models; Rising Demand for Personalized Medicine; Growing Pipeline of Pharmaceutical and Biophamraceutical Companies.
6. What are the notable trends driving market growth?
The Oncology Segment is Expected to Hold a Significant Market Share Over the Forecast Period.
7. Are there any restraints impacting market growth?
Alternatives to Animal Testing; Regulations for the Ethical Use of Animals.
8. Can you provide examples of recent developments in the market?
In February 2024, University of Texas Southwestern Medical Center introduced a new compound that significantly extended survival in a mouse model of amyotrophic lateral sclerosis (ALS) by blocking the activity of a group of proteins called MAP4Ks.
9. What pricing options are available for accessing the report?
Pricing options include single-user, multi-user, and enterprise licenses priced at USD 4750, USD 5250, and USD 8750 respectively.
10. Is the market size provided in terms of value or volume?
The market size is provided in terms of value, measured in Million and volume, measured in K Unit.
11. Are there any specific market keywords associated with the report?
Yes, the market keyword associated with the report is "Mice Models Industry," which aids in identifying and referencing the specific market segment covered.
12. How do I determine which pricing option suits my needs best?
The pricing options vary based on user requirements and access needs. Individual users may opt for single-user licenses, while businesses requiring broader access may choose multi-user or enterprise licenses for cost-effective access to the report.
13. Are there any additional resources or data provided in the Mice Models Industry report?
While the report offers comprehensive insights, it's advisable to review the specific contents or supplementary materials provided to ascertain if additional resources or data are available.
14. How can I stay updated on further developments or reports in the Mice Models Industry?
To stay informed about further developments, trends, and reports in the Mice Models Industry, consider subscribing to industry newsletters, following relevant companies and organizations, or regularly checking reputable industry news sources and publications.
Methodology
Step 1 - Identification of Relevant Samples Size from Population Database


Step 2 - Approaches for Defining Global Market Size (Value, Volume* & Price*)

Note*: In applicable scenarios
Step 3 - Data Sources
Primary Research
- Web Analytics
- Survey Reports
- Research Institute
- Latest Research Reports
- Opinion Leaders
Secondary Research
- Annual Reports
- White Paper
- Latest Press Release
- Industry Association
- Paid Database
- Investor Presentations

Step 4 - Data Triangulation
Involves using different sources of information in order to increase the validity of a study
These sources are likely to be stakeholders in a program - participants, other researchers, program staff, other community members, and so on.
Then we put all data in single framework & apply various statistical tools to find out the dynamic on the market.
During the analysis stage, feedback from the stakeholder groups would be compared to determine areas of agreement as well as areas of divergence
